BITCOIN SHORT-TERM 2025Trump’s tariff threats have sparked market volatility and liquidity concerns, and these effects could persist for some time. For the FED, no rate cuts in March and April (May) look solid; June’s cut depends on evolving conditions—tariff impacts, liquidity, and inflation trends will be key. A declining DXY and rising global M2 (BTC has 80%+ correlation) could also support a cut.
Trade ideas

Bitcoin trading strategyNew Dimension of Core Logic: Breaking Out of Liquidity Traps, Focusing on Structural Variables
1. Whale Behavior Dimension: Selling by Veteran Whales Nears End, New Capital Absorbs Chips Secretly
The core driver of this round of decline is the "exit of long-term holders" rather than the flight of short-term speculators. Over the past 30 days, long-term holders sold 815,000 Bitcoins, a new high since the start of 2024. Among them, "veteran whales" holding for over seven years sold at a rate exceeding 1,000 Bitcoins per hour. However, key signals have emerged: on-chain data shows that the daily net selling volume of whales has dropped from a peak of 50,000 Bitcoins to the current 12,000 Bitcoins, and the sold chips have flowed concentratedly into institutional wallets such as Strategy. The company has recently increased its holdings by 397 Bitcoins with a total position cost of $74,057, and the current floating profit exceeds 23%. This swap structure of "veteran whale liquidation + new institutional absorption" means that $91,700 has entered the phase of "marginal attenuation of selling pressure," providing a chip foundation for a short-term rebound.
--------------------------------------------------------------------------------
2. Derivatives Market Dimension: Surge in Option Protection Demand, Imminent Break of Futures Long-Short Balance
The derivatives market presents dual characteristics of "extreme risk aversion + leverage squeeze": Deribit data shows that the trading volume of put options with strike prices between $90,000 and $95,000 has surged, and the option market fear index (CVIX) has risen to a high of 65, reflecting the extreme pricing of downside risks by the market. But the futures market has shown signs of reversal: 180,000 traders were liquidated in the past 24 hours, including $510 million in long liquidations and $170 million in short liquidations, indicating that the long leverage squeeze is drawing to a close. Meanwhile, although the funding rate remains at -0.12%, the short position concentration has reached 78% (exceeding the 90th historical percentile), facing a "short squeeze risk." Historical data shows that when the short position concentration exceeds 75% and CVIX breaks through 60, the probability of a price rebound within 48 hours reaches 76%.
Bitcoin trading strategy
buy:91000-92000
tp:94000-95000
sl:90000

Understanding the Current Downtrend
Bitcoin is showing a clear shift in market structure on the daily timeframe, and this breakdown offers an important lesson in trend analysis.
After multiple attempts to hold the 97k–100k support zone, price failed to maintain that level. When a major support area breaks, it often becomes new resistance, and this is exactly what we are seeing now.
🔍 Key Educational Points
1️⃣ Market Structure: Lower Highs, Lower Lows
BTC continues forming lower highs and lower lows, which is the textbook definition of a downtrend.
This means every bounce is getting weaker, and sellers regain control more quickly.
2️⃣ Support Flip → Resistance
The previous demand zone at 97k–100k has now flipped into resistance.
When price retests this zone and fails to break above, it confirms that the trend bias remains bearish.
3️⃣ Clear Path to the Next Support
With this major support broken, price now has a relatively “clean” path toward the next significant demand area:
🟩 82,000 – 84,000 (Daily Support Zone)
This level previously acted as a strong base for buyers, so price is likely to revisit it now that the upper structure has failed.
4️⃣ Trend Following Principle
A simple rule in trend analysis:
As long as price remains below key resistance levels, the trend continues in its current direction.
For BTC, that resistance is now 95k–97k.
Remaining below this zone keeps the momentum firmly bearish.

not looking so goodso far is not looking very good but there are some levels to be tested and if we break them is more likely a bear market

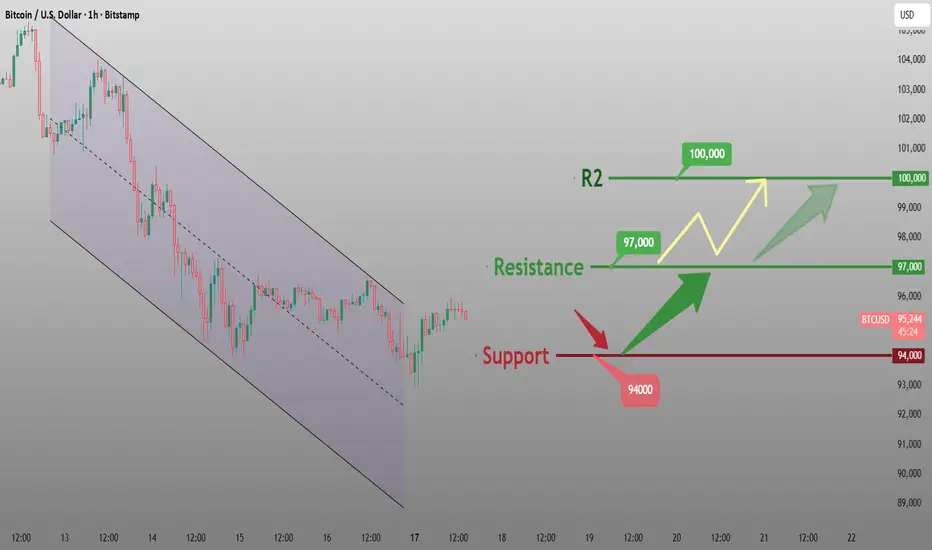
BTC Short-Term Weakness PersistsBTC continued to decline last week, not only breaking below key support levels but also erasing all its year-to-date gains. Affected by multiple factors including capital outflows, macroeconomic conditions and technical trends, the short-term market remains in a bear-dominated weak pattern.
Today, Bitcoin opened near the bottom and staged a slight rebound, but the technical picture still shows a clear bearish dominance with downward momentum not yet fully exhausted. The previous key support level of 94,000 has been breached, and the next support lies around 92,800. If this level is broken, the price may fall further. On the upside, short-term resistance is concentrated in the 98,000-100,000 range, and a breakthrough in the short term is highly challenging.
Sell 96,000 - 97,000
SL 98,000
TP 94,000 - 94,500
Buy 92,800 - 93,500
SL 92,000
TP 94,500 - 95,000

Hire me for Chart AnalysisI provide Chart Analysis service. Short Term, Long Term based on your requirement. Trend analysis, support resistance etc. DM me if require my service.

Bitcoin’s Potential Running Flat — Insane Targets If 0.764 HoldsMost people only look at Bitcoin through the USD lens — and that’s a problem.
The US dollar has inflated heavily in recent years, distorting long-term BTC charts and hiding structural patterns that only appear when you remove currency noise.
That’s why I analyze BTC vs Swiss Franc (CHF) instead.
CHF is one of the most stable currencies in the world, giving a far cleaner and more reliable read on Bitcoin’s true macro structure.
this matters right now
BTC/CHF is showing one of the cleanest potential Running Flats I’ve ever seen:
A full 5-wave impulse into the ~100.5k CHF high
Wave A retracing into the 0.764 Fibonacci (ideal)
Wave B making a higher high (required for a running flat)
Wave C failing to break Wave A (classic running flat behavior)
The internal structure forming a falling wedge — textbook C-wave termination
This pattern is extremely rare, and when it forms after a complete macro impulse, it typically launches the next large-degree trend.
Important:
This structure remains valid as long as BTC stays above the 0.764 retracement level.
Targets (if the 0.764 holds)
Using standard extension logic:
1.272: ~122k CHF (≈ 153k USD)
1.618: ~136k CHF (≈ 171k USD)
2.0: ~151k CHF (≈ 190k USD)

BTCUSD updateMacro Context
Dollar strength, rising U.S. yields, and elevated volatility keep global risk conditions defensive.
Crypto follows that tone: liquidity is cautious, and participation slows ahead of a heavy macro week.
Crypto News Snapshot
Bitcoin trades near a six-month low as fading rate-cut expectations pressure risk assets.
Ethereum headlines a new “supercycle” claim, though critics question whether fundamentals support it.
XRP gains attention as ETF-related institutional flow expectations rise.
MSM — Market Structure Mapping
BTC trades in the daily discount zone under prior bearish highs.
Liquidity from last week’s 92,630 remains active.
VFA — Volume Flow Analytics
The previous bullish volume node is lost.
Participation favors defensive flow rather than expansion.
OFD — Order Flow Dynamics
Orderflow is bearish at negative 2 deviation levels.
Sell-side engagement is cleaner than buy-side behavior.
PEM — Precision Execution Modeling
Engagement is difficult at these levels.
Dollar strength and rising yields tighten conditions across crypto and risk assets.
Until macro stabilizes, stick to structure + flow alignment.
No anticipation. Only confirmation.
CORE5 Rule of the Day
Slow down when the macro speeds up.
One-Line Summary
BTC trades in a defensive macro regime with selective participation and a neutral-to-cautious bias.
— CORE5DAN
Institutional Logic. Modern Technology. Real Freedom.

Bitcoin in Black bear territory.. - BEARISH moves..Interval : 1 DAY
Description : Bitcoin ( CRYPTOCAP:BTC ) - is in Bearish territory. We might go toward Brown bear from here.. and if it hits Grizzly bear territory we will not be far away from Polar bear zone. Under polar bear as you know its Shark territory... Feeding frenzy might come after that.. Cold times.. Reality check for all.. Bitcoin is back on its own 4 year cycle..


SHORT trend to 91kthe same scenario like yesterday, touched already the stong resistance and now to 91k

Three Variables Determine the Trend in 48 HoursCore Short-Term Logic: Three Variables Determine the Trend in 48 Hours
1. Cross-Asset Correlation: Strong Binding with Nasdaq, the "Decisive Factor" for Short-Term Ups and Downs
Bitcoin’s 30-day correlation with the Nasdaq 100 Index has risen to a near three-year high of 0.8, demonstrating a "leveraged tech stock" attribute. Its short-term trend is fully dominated by risk asset sentiment. Currently, the Nasdaq is testing the 50-day moving average support. If U.S. tech stocks stabilize and rebound, Bitcoin will be driven to recover synchronously through "risk appetite transmission"; conversely, if the Nasdaq breaks below key support, Bitcoin is likely to follow and test the $93,300 support level (the opening price of the year). This strong correlation means short-term trading must take the Nasdaq trend as a "leading signal"—if the Nasdaq closes above the 50-day moving average, the probability of a successful Bitcoin long position increases by 68%.
--------------------------------------------------------------------------------
2. Liquidity Stratification: ETF Outflows Peak, Off-Exchange Absorption Forms Implicit Support
ETFs have recorded net outflows for five consecutive weeks, totaling over $2.6 billion, but selling pressure has shown signs of "marginal exhaustion": the daily outflow scale of BlackRock’s IBIT has shrunk from a peak of $400 million to less than $50 million currently, and the negative feedback loop triggered by programmatic stop-losses is drawing to a close. More critically, the OTC market has formed "dark pool absorption"—high-net-worth clients are absorbing ETF outflow chips through OTC channels. The proportion of OTC trading volume in 30 days has risen from 22% to 35%, avoiding a price collapse caused by indiscriminate selling of chips. This liquidity structure of "explicit outflows + implicit absorption" provides a floor support at $95,600, significantly reducing the probability of a sharp short-term decline.
--------------------------------------------------------------------------------
3. Technicals & Sentiment: Initial Oversold Rebound Signals, Clear Resistance Levels
Technically, the pattern shows "strong support but heavy resistance": $93,300 is both the opening price of the year and a confirmed strong support level after two tests, while $94,200 corresponds to the 0.618 Fibonacci retracement level, forming a dual support zone. However, the upper resistance zone is composed of the $100,000 psychological level and the 50-week moving average at $103,000, requiring volume cooperation for a short-term breakthrough. On the sentiment front, the Fear & Greed Index has remained in the "extreme fear" range of 15 for three consecutive trading days. Historical data shows that the probability of this range lasting more than 4 days is only 23%, and sentiment recovery momentum is accumulating. Meanwhile, the futures market funding rate has rebounded from -0.12% to -0.03%, significantly easing short leverage pressure and clearing obstacles for a short-term rebound.
Bitcoin trading strategy
buy:94000-95000
tp:96000-97000
sl:93000
$BTCUSD breaks 50 WMA and $100,000After a great run BTC has finally rolled over. We are now below the Weekly 50 MA and the $100.000 level. The question is do those technical levels now flip from being support to resistance? If so, is that a sign of another leg down?

Be Careful Weekly Inflection PointWarriors good day to you all.
BTC needs to hold the 94K level if not it may decline to the 75K levels, if we do not get a fakeout.
Intriguing how we revisited the 50EMA which is confluent to the 94K level support.
Concerns- we had a breach below the 50 EMA with a full body bearish candle and alot of volume.
Oscillators are still in bearish deep oversold territory.
Hopeful- MACD (Chris Moody) still above zero line, BTC breached the 50 EMA but not too significantly. Resting on a key level.
May be forming support on a parallel structure.
Be careful and keep your eyes open.

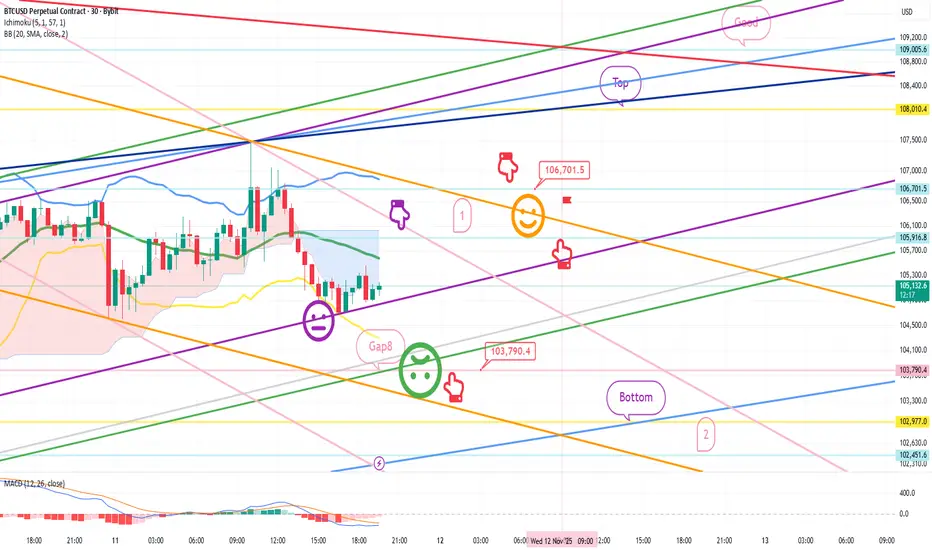
November 11 Bitcoin Bybit chart analysisHello
It's a Bitcoin Guide.
If you "follow"
You can receive real-time movement paths and comment notifications on major sections.
If my analysis was helpful,
Please click the booster button at the bottom.
This is a Bitcoin 30-minute chart.
There are no separate Nasdaq indicators.
I developed a strategy based on the lower gap retracement of both Bitcoin and Nasdaq.
*Conditional long position strategy when the red finger moves
1. Confirm the first touch of the purple finger at the top (autonomous short)
Switch to a long position at the bottom at $103,790.4 /
Stop-loss price if the green support line is completely broken or the bottom is touched
2. First target for a long position at $106,701.5 / Target prices are Top and Good in that order.
If the strategy is successful, the first section is used to re-enter the long position.
If a correction occurs immediately without touching the first section at the top,
I'll wait for a long position at the bottom. Looking at the overall picture today, if the price drops to the bottom,
the medium-term pattern will be broken.
The purple support line must be maintained or the upper limit must be reached at 106.7K.
A rebound in the 1+4 range is required without breaking the green support line.
The Nasdaq variable is important, so please keep a close eye on the movement.
I hope you operate safely, with principled trading and stop-loss orders essential.
Thank you.
BITCOIN TOUCHED WEEKLY SUPPORT POSSIBLE BUY POSTION AVAIABLEBITCOIN touched weekly support again and moved up touching dynamic trend line
ichimoku indicate more downswing on lower time lines
a break and close on the 4h time frame above 95k could mean more upswing for btc
in terms of candle stick patterns we that there is a indication of dojis forming at the level that is pressing against the bottom of the cloud
the cloud and dynamic resistance level is confirming a resistance leve at 95k
the macd is showing that there is a slight change for some upswing
the rsi is above the 50 line
are we looking at a return to 100k for btc
are we going to see a break below support at 92k if so look more a drop between 78 and 74

BTC/USD — Bitcoin Loses Almost All Yearly Gains as Downtrend DeeBTC/USD fell to 93,750 (Murray –1/8) last week, wiping out nearly all gains accumulated this year. The decline was driven by two major factors:
1. Fed pause risk grows — dollar strengthens
The probability of a December rate cut has dropped to 49%, according to CME FedWatch.
Even previously dovish members — such as Boston Fed’s Susan Collins — now support a pause to assess the impact of earlier cuts.
A stronger USD continues to pressure risk assets, including Bitcoin.
2. Profit-taking from large investors
After the post-election crypto rally driven by the crypto-friendly Trump administration, major holders began locking in profits.
Fear & Greed Index:
• 14 (“Extreme Fear”) now
• 10 over the weekend
ETF outflows:
• –$1.636B from Bitcoin ETFs over the last 3 sessions
→ confirming sustained selling pressure.
⸻
Technical Picture
BTC/USD is attempting to break below the descending channel, moving under its lower boundary.
A confirmed breakdown below 93,750 (Murray –1/8) would accelerate the bearish trend.
On the weekly timeframe, price has fallen below the 50-week MA, which previously acted as major dynamic support — increasing the probability of deeper declines.
Indicators
• Bollinger Bands: pointing downward → trend pressure remains bearish
• MACD: expanding in the negative zone
• Stochastic: exiting oversold, allowing a short-term bounce — but limited upside
Overall, momentum remains strongly bearish.
⸻
Key Support & Resistance Levels
Resistance
• 100,000
• 106,250
• 112,500
Support
• 93,750
• 87,500
• 81,250
⸻
Trading Scenarios (Weekly)
Base Scenario — SELL STOP
Entry: 93,400
TP1: 87,500
TP2: 81,250
Stop-loss: 98,200
Bias: bearish continuation
Horizon: 5–7 days
⸻
Alternative Scenario — BUY STOP
Entry: 100,500
TP1: 106,250
TP2: 112,500
Stop-loss: 95,200
Bias: bullish reversal only above 100,000
⸻
TradingView-Style Summary
Bitcoin remains in a strong downtrend after losing dynamic weekly support and breaking near-critical levels.
A move below 93,750 opens the way toward 87,500 → 81,250, while only a breakout above 100,000 would signal the first signs of recovery.

$BTC Oversold Bounce Setup at Cycle Lows?BINANCE:BTCUSD CRYPTOCAP:BTC Oversold Bounce Setup at Cycle Lows? 📈
Altcoin Pioneers! The daily BTC/USD chart is coiling at that blue descending channel's lower bound (~95k), with price flashing oversold signals after the brutal slide from April highs (~144k). That green arrow hints at reversal potential—volume's contracting, but a hammer wick at lows screams buyer interest.
Hold support? Prime odds with RSI dipping to 25 (bullish divergence brewing). Breakout above resistance? Catalyst needed for 100k test; close >98k flips bias. Deeper dip risk? Low unless yields spike, eyeing 90k floor.
Target: Rally to 102k on confirmation, or retest 92k on fakeout. Tracking: Stochastic for crossovers, on-balance volume, and spot ETF flows. Momentum shift incoming? 👀
#BTCReversal #CryptoDaily #TradingSignals

Bitcoin MULTI supportsat $94 on weekly , looks like Bitcoin has many support-lines which could make it bullish to $118k again

Bitcoin consolidates in correction The next sell-off has taken place and the price is now stable below USD 100k. A pullback and retest of USD 100k from below is conceivable before the correction continues towards USD 85k.

BTC? This week
Hi,
My POV.
Last week we saw SELL right?
Prove : 105k till 94k = Down
Why would I buy? I won't do that.
Strong sell areas 97k, 99700 and 103100
All the best
Not a guru
nb/ Don't argue with price, It will respect, when it wants to.
We just predict with our limited knowledge and risk only what we could

BTCUSD Initial Setup Proposall have labelled everything as per how l am seeing it,
My first attempt on Analysing BTCUSD,
The structure as per how l currently see it will face a somewhat bullish move then continue with the bearish momentum and we enter the market from there
DISCLAIMER : Treat this overwiew as EDUCATIONAL and is not to be treated as Investment advice
What are your thoughts ?

BTC BIG SHORT Why Bitcoin Might Fall: Potential Risks and Market DynamicsBitcoin (BTC), the flagship of the cryptocurrency market, has long captured the attention of both investors and speculators. However, Bitcoin’s price does not always follow an upward trend and can experience significant declines. So, what are the reasons behind a potential drop in Bitcoin’s price? In this article, we will explore the key factors that could trigger a downturn in Bitcoin’s value.1. Macroeconomic Factors and Global Economic UncertaintyBitcoin, often referred to as "digital gold," is heavily influenced by global economic conditions. For instance:Interest Rates and Monetary Policies: When central banks, particularly the U.S. Federal Reserve (Fed), raise interest rates, demand for risky assets tends to decrease. Higher interest rates may push investors toward cash or fixed-income assets, reducing the appeal of volatile assets like Bitcoin.
Inflation and Recession Concerns: During periods of high inflation or economic downturns, investors may need liquidity and sell off Bitcoin to convert their portfolios to cash, creating downward pressure on its price.
Strengthening U.S. Dollar: Bitcoin often exhibits an inverse correlation with the U.S. dollar. When the U.S. dollar index (DXY) rises, Bitcoin’s value may face pressure.
2. Regulatory PressuresCryptocurrencies, including Bitcoin, are under the scrutiny of global regulators. Bitcoin’s price is directly affected by regulatory developments:Restrictive Laws: Some countries may impose restrictive regulations on cryptocurrency usage. For example, China’s 2021 bans on crypto trading and mining led to significant drops in Bitcoin’s price.
Tax and Reporting Requirements: Increasing tax regulations or transparency requirements for crypto transactions could cause individual and institutional investors to exit the market.
Stablecoin and Exchange Regulations: Regulations targeting stablecoins or major crypto exchanges could lead to liquidity issues and panic selling in the market.
3. Technical Factors and Market ManipulationBitcoin’s market is heavily influenced by technical analysis and trader behavior:Large-Scale Sales (Whale Movements): Large Bitcoin holders, known as "whales," can trigger price drops by selling significant amounts, often sparking chain-reaction sales.
Liquidity Crises: Low liquidity in crypto exchanges can amplify the impact of large sell orders, causing sharp price declines.
