The most probable area for a BTC fall.My charts are signaling a shift.
CRYPTOCAP:BTC appears to be transitioning from its bullish momentum into a defined bearish channel.
Here's what I'm seeing:
Open Interest Down:
Bitcoin's aggregate Open Interest has dropped ~5% to $68.25B. This tells me traders are closing their positions,
indicating a cooling off and potential weakening of the prior trend.
Channel Breakout:
We've broken down from the previous sideways consolidation and are now forming a clear bearish channel.
Downside Targets: If this structure holds, I'm watching a potential move down to the $94,000 - $84,000 zone.
Liquidity Watch:
The liquidation Heatmap shows significant liquidity pools building around $90,000 and, more notably, $84,000.
These levels act like magnets for price.
In short ; The momentum has shifted. The path of least resistance appears to be down for now, targeting the liquidity zones below.
What's your take? Are you leaning long or short?
#Bitcoin #BTC #Crypto #Liquidation
Trade ideas

Btc update .Here’s a short, clear description you can use for your Bitcoin chart 👇
“Bitcoin is rebounding from the lower support zone near $102K after testing the 61.8% Fibonacci level. The RSI indicates potential recovery momentum, suggesting BTC could aim for the $103.5K–$104K resistance area if bullish pressure continues.”
Have a good day

BTC/USD Technical Outlook📅 BTC/USD Technical Outlook (November 5, 2025)
🔹Technical Outlook
The Bitcoin price (BTC/USD) is currently trading at 101,411.
The chart shows that after falling from the 111,000 level, the price has dropped below both the 50- and 200-period moving averages. This indicates that the medium-term downtrend is strengthening.
The 106,369 level, which previously served as support, has now become a strong resistance area. Below, the 98,831 and 93,568 regions stand out as important horizontal supports. In particular, daily closes below 98,800 could accelerate the downtrend.
Support Levels: 98,831 – 93,568 – 90,000
Resistance Levels: 106,369 – 111,089 – 113,133
🔹Conclusion
Short-term downward pressure is clearly evident in Bitcoin's technical outlook.
📉 Closings below 98,800 support the continuation of the decline.
📈 However, rallies may remain temporary unless a recovery above 106,000 is seen.

expanding triangle, head and shouldersworst case scenario of bitcoin is to fall below the expanding triangle and move down to the head and shoulders target.
bitcoin is trading in a expanding triangle pattern and found support on the bottom line of the triangle.
bitcoin was also trading inside a head and shoulders pattern but has broken out to the downside.
worst case scenario is lose the expanding triangle support and move down to the 88k level.
in the bull case we could just move back to the top of the expanding triangle. and maybe even break the triangle upside with targets of 150k-180k

I WILL GO FOR SHORT BTCUSD IN THIS AREA 📊 BTCUSD Analysis – CMP Zone Setup
I expect BTCUSD to test the , based on my CMP (Current Market Price) technique — a method I use to identify potential reaction areas and key levels from a technical perspective.
🔍 Technical Outlook:
Price is approaching a CMP zone that may act as a reaction point.
I’ll be monitoring closely for a bearish engulfing pattern as confirmation before taking any entry.
🎯 Trade Plan:
Stop Loss: 50 pips
Take Profit: 1:2 or 1:3 R:R
Setup Type: CMP Reaction + Engulfing Confirmation
⚠️ Disclaimer:
This analysis is based on my personal technical view and is not financial advice. Always do your own research before entering any trade.

#BITCOIN UPDATE $BTC OUR MAIN TARGET AT 100K HIT#BITCOIN UPDATE
CRYPTOCAP:BTC our main target at 100K hit 🎯 exactly as planned.
I’ve been warning for quite some time now, and everything is playing out perfectly. I told you many times the market was topping out and a big crash was coming… now it’s happening. ⚠️
100K is the strongest support of this entire bull market. If we lose this level and start closing below it, forget about any altseason it’s over. That would confirm we’re entering the danger zone the bear market gear. 🐻
As I said before, I’ll only close my short positions once we break and confirm below 100K. For now, I’m still holding my shorts strong. 💪
Our inner circle members are getting live updates including market news, rumors, and micro-level signals.
I’ll keep updating you in real time if I open or close new positions.
Stay sharp the next few days are critical. ⚠️

Whipsaw of US$100K on BTC/USD?Touching back in on BTC/USD, you can see that recent price action briefly dipped beneath US$100,000, with buyers currently defending the big figure.
However, with November down 7.0%, and following the major Cryptocurrency pair trading under key support between US$104,866 and US$107,692 (1M levels) – which is now set as resistance – a dip lower could still be on the table to support between US$93,902 (3M) and US$97,578 (1M). This could also set up a whipsaw scenario, where price snaps under US$100,000, filling stops under the big number, and then rebounds from nearby support at US$93,902-US$97,578, as per the red arrows.
Written by the FP Markets Research Team

NEW BITCOIN SCENARIO SELL SELL SELLThis set up is a strong confluence of bitcoin loosing it's popualrity as a lot of crypto positions got liquidated , the bitcoin is the major crypto and as it drops unfortunatlly only solid coin will survive this crash

BTCUSD at pivotal levelThe BTCUSD remains in a neutral trend, with recent price action indicating a corrective pullback within the broader trading range.
Support Zone: 100,780 – a key level from previous consolidation. Price is currently testing or approaching this level.
A bullish rebound from 100,780 would confirm ongoing upside momentum, with potential targets at:
107,150 – initial resistance
108,850 – psychological and structural level
110,900 – extended resistance on the longer-term chart
Bearish Scenario:
A confirmed break and daily close below 100,780 would weaken the bullish outlook and suggest deeper downside risk toward:
99,140 – minor support
97,800 – stronger support and potential demand zone
Outlook:
Neutral bias remains intact while the BTCUSD holds above 100,780. A sustained break below this level could shift momentum to the downside in the short term.
This communication is for informational purposes only and should not be viewed as any form of recommendation as to a particular course of action or as investment advice. It is not intended as an offer or solicitation for the purchase or sale of any financial instrument or as an official confirmation of any transaction. Opinions, estimates and assumptions expressed herein are made as of the date of this communication and are subject to change without notice. This communication has been prepared based upon information, including market prices, data and other information, believed to be reliable; however, Trade Nation does not warrant its completeness or accuracy. All market prices and market data contained in or attached to this communication are indicative and subject to change without notice.

Wait for the Real Gut Punch to $90kBTC’s lounging around $101k, pretending everything’s peachy, but reality check: we’re primed for another nosedive to the $90k zone. That’s confluence paradise – bottom trendline, POC snuggle, golden pocket Fib (0.618-0.65), and VAL from volume profile all conspiring for a massive rebound. My take: wildly bullish once we smack it, turning $90k into your dream buy-the-dip moment. Until then, snicker at those clueless early birds getting rekt.

Bitcoin bearish breakdownBitcoin decisively broke below a 4 month old channel support line on high volume.
Head and Shoulders present as well.
Will see prices in the high 80k by end of year.

this BTC showed up in my dream few months agoIt's just a dream and LSD while drawing. Nothing to analyze.
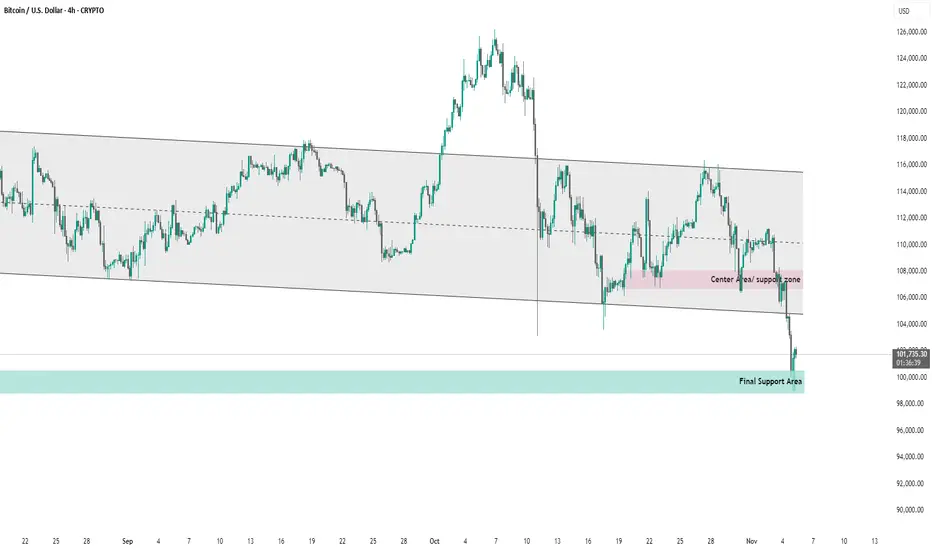
BTC # Bitcoin 4 hour timeframe price action.This chart shows Bitcoin (BTC/USD) price action on the 4-hour timeframe within a descending channel.
The price has consistently respected the upper and lower bounds of the channel, indicating a prevailing downtrend.
A center area/support zone around $107,000–$109,000 acted as interim support but has recently been broken.
The price has now reached the final support area near $100,000–$101,000, which is currently being tested.
If this final support fails, it could signal a continuation of the bearish trend; otherwise, a bounce from this level might lead to a short-term retracement toward the mid-channel zone.
Overall, the chart highlights a critical support test within a broader bearish structure.
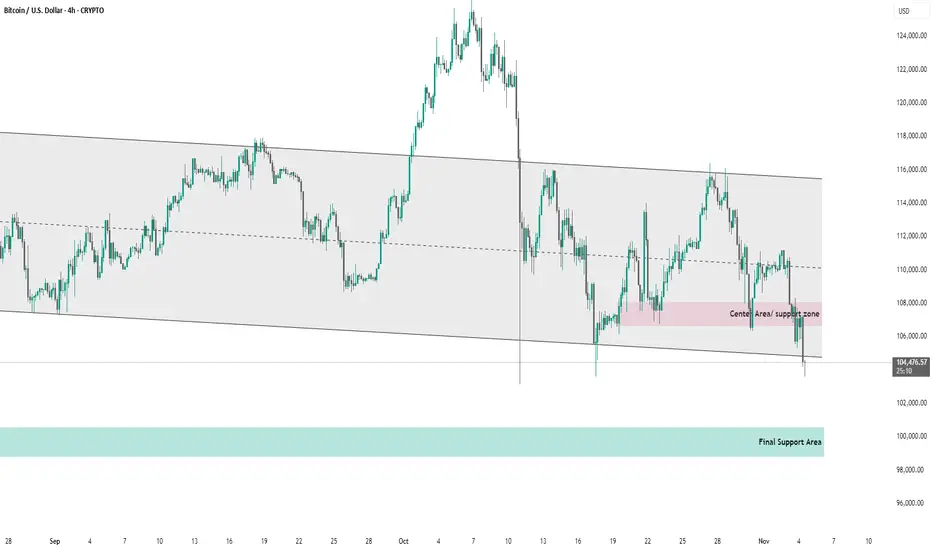
BTC # Bitcoin’s (BTC/USD) 4-hour price movement within a descendThis chart shows Bitcoin’s (BTC/USD) 4-hour price movement within a descending channel.
Key observations:
Channel Trend: The price has been respecting a downward-sloping parallel channel, indicating a medium-term bearish trend.
Center Area / Support Zone: Around the $106,000 level (highlighted in pink), previously acted as support but has now been broken.
Current Price: BTC is trading near $104,369, just below the lower boundary of the channel — suggesting potential further downside.
Final Support Area: The next significant support lies around the $99,000–$100,000 region (highlighted in green).
Summary:
Bitcoin is currently testing the lower channel boundary. A confirmed breakdown below this zone could push the price toward the final support area, while a rebound could indicate a short-term recovery back into the channel.
BTC updatePretty strange how it bounces off these random lines it draw, right?
It's the same down trendline from before, it has to test it, get rejected and then try to break through it again.
No position in BTC right now, just waiting to see if it breaks through either the blue line or the purple line below.

Today's Bitcoin Trading StrategyThe long-term moving average has held firm, and the bottoming-out characteristics are obvious.
The current price of $10,1776 is closely aligned with the 365-day long-term moving average of $10,0367 - this moving average has only been breached twice in the past three years, and each time it was breached, there was a rapid rebound, with the rebounding amplitude being at least 10% or more. More importantly, the price has been in a sideways movement at this level for two days, and has not continued to decline further, just like a ball hitting the ground and starting to bounce without stopping, indicating that there is buying pressure below, and the support level is becoming increasingly stable.
The bull short selling is coming to an end, and selling pressure is running out.
The continuous bull short selling wave in the past has significantly cooled down: the total amount of bull short selling across the network in the past 24 hours has dropped from $60 million to $12 million, with the short selling scale reduced by 80%, and the bull positions in mainstream exchanges have begun to slightly recover (from 38% to 42%). This is like "cutting the" reaching the root, the remaining bulls are either those who are firmly holding or those who are new investors who are buying bottoming, and those who continue to sell are becoming fewer, so the price cannot fall further and there is naturally a rebound space.
Bottoming-out funds are entering the market, and ETF and stablecoins are active.
Although the Bitcoin ETF did not experience a significant inflow in the past 24 hours, the outflow amount has dropped from $50 million per day to $12 million, and the selling pace of institutions has significantly slowed down; at the same time, stablecoins have begun to quietly grow, with the market value of USDT increasing by $320 million in two days. These "pocket money for buying coins" have increased, indicating that someone is preparing to bottom out. Moreover, the chain data shows that more than 100 BTC whale addresses have begun to withdraw coins from exchanges (80 coins were withdrawn in 1 hour), not selling but depositing, which is a typical bottoming-in buying signal.
Today's Bitcoin Trading Strategy
buy:101000-102000
tp:103000-104000
sl:100000

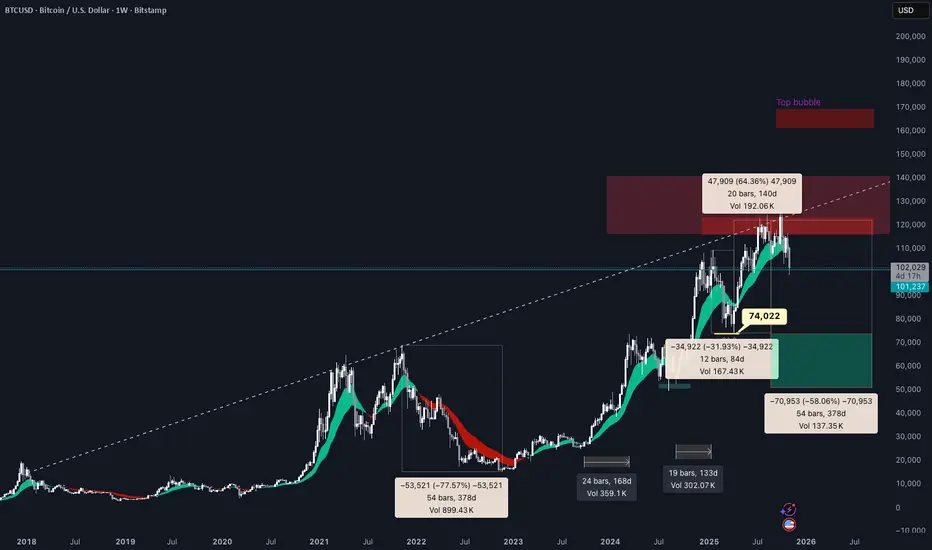
Just another Bear Cycle BTCIn the current halving period, Bitcoin has begun to enter a bear period where the halving period has begun to end and it is time for BTC to consolidate for the next 4 years.
The current period of 52 weeks from which this thesis was created, will fall in the 3rd quarter of 2026 (November 2026). It is recommended to start doing DCA again in nov 2026

BTC Neautralonly trend line I've been following. A lot of manipulation over the last 24 hours wicking below and rallying twice already.

WE BUY AT THE DEMAND ZONEI really enjoy clean chart. I highlighted 3 Demand zones the 1st one is fresh its the second time being tested. now i am waiting for a confirmation to buy and Take profit at 124654.100

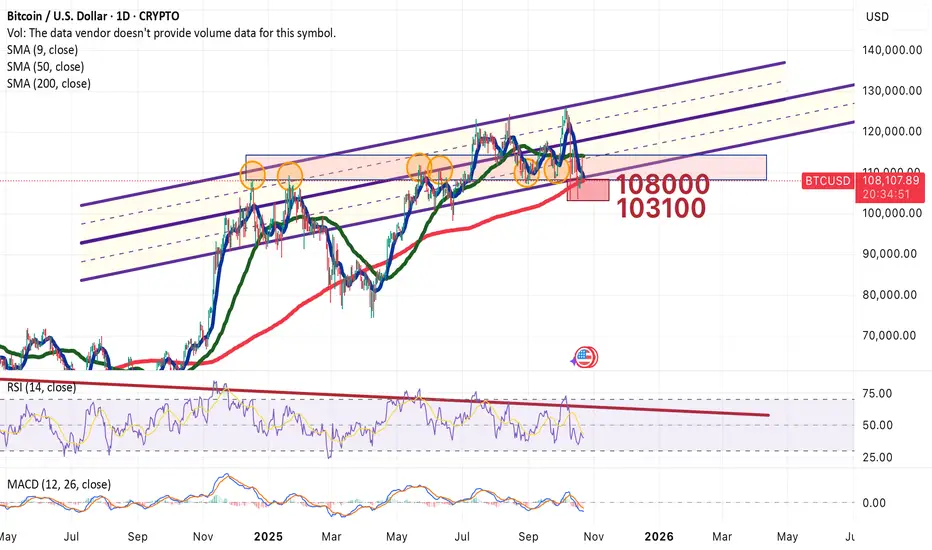
Bitcoin Cycle Update – Testing 200 MA Around $108,000Hey everyone, Sam here 👋
This is a follow-up to my previous analysis on Bitcoin’s 4-year cycle — and so far, the market is moving exactly as expected.
Bitcoin is currently hovering around the 200 moving average, near $108,000 — one of the most important levels in every historical cycle.
In my opinion, this level will be broken soon, which could trigger the start of a major correction.
The next key support to watch is at $103,100.
A confirmed break below that level — especially with strong volume — would likely confirm our journey downward, signaling the next leg of the cycle is in play.
Just like in 2013, 2017, and 2021, it seems this cycle is setting up for another major move… right around November — staying perfectly aligned with Bitcoin’s historical rhythm.
Remember, history doesn’t repeat exactly, but it often rhymes.
If this pattern continues, we might be witnessing the beginning of Bitcoin’s next big correction.
Stay cautious, stay technical — and let the charts guide you, not emotions.
BTC/ETH-USD Bouncing as ExpectedProvided that this bounce and breakout DOES NOT FAIL, this is what the beginning of a BOUNCE looks like as far a TA is concerned.

BTC-USD So far so good! Weekly 50MA HeldIt's amazing how we humans can become so BULLISH or so BEARISH!
This test of the Weekly 50MA is as normal as it gets. For as long as it does not FAIL to breakout, the BULL RUN remains INTACT.

BTC UpdateWow, lol. So it bounced off the blue line as I predicted, but then shot right through it on the second try. I did not see that coming. On top of that, it overshot my pennant target.
I expect it to test the bottom purple line this week, if it shoots through that then BTC and cryptos in general are toast.
None of the indicators or support lines seem to mean much during a selloff, I guess crypto traders don't look at them. Not to mention anyone holding BTC through ETFs like IBIT has to sell during the trading day so that puts additional selling pressure without enough buyers underneath.
