look what I was saying it looks like we about to bounce the "last resistance" or at least one of the last one
Trade ideas

Bitcoin BTC Bears Regain Control: Watching for a Short Setup 📊 Bitcoin Analysis (BTCUSD)
Currently, Bitcoin is showing clear bearish intent on the higher timeframes 🧭. After an extended period of range-bound price action, we’ve now seen a decisive displacement to the downside 💥 — a strong signal that sellers are taking control.
From here, I’ll be watching for a retracement back into equilibrium ⚖️ — the 50% level of the most recent swing — and will then look for signs of rotation and a break of structure 🧩 on the 30-minute chart to confirm a potential short setup 📉.
Patience is key here 🕰️ — I want to see price react efficiently to that retracement before considering entries.
⚠️ Disclaimer: This is not financial advice. Always conduct your own analysis before taking any trade.

On the neckline of a double head and shouldersOver the past 3 months, the price has completed a broad head and shoulders pattern.
Within the right shoulder, a second, smaller head and shoulders has formed — clearly visible on the 4H chart.
Both patterns share the same neckline around $106!
Watch out for a potential close below this level in the coming days, which could trigger a sharp downward move.

BTC/USD POTENTIAL BULLISH REVERSAL SETUPAnalysis:
Bitcoin (BTC/USD) is currently consolidating near the $106,800 area after a strong bearish move that broke multiple structures. The chart shows clear Smart Money Concepts (SMC) signals such as Change of Character (CHoCH) and Break of Structure (BOS), indicating the end of the recent downtrend and the potential start of accumulation before a bullish correction.
After liquidity was collected below the Equal Lows (EQL) near $106,000, buyers have begun to show interest, forming a potential reversal pattern. Price is now reacting to a demand zone and showing early bullish signs.
Key Technical Highlights:
Market Structure: After a strong bearish break, BTC is forming a base with BOS confirmation — signaling possible trend reversal.
Equal Lows (EQL): Liquidity has been swept below $106,000, suggesting institutional accumulation.
Entry Zone: Around $106,600 – $106,800 (after minor pullback and confirmation).
Target Zone: $108,500 – $109,700, aligning with the next supply area and previous structural highs.
Stop-Loss Area: Below $105,500, under the liquidity sweep zone for safety.
Bias:
Bullish (short-term) — as long as price holds above $106,000, BTC is likely to continue toward $109,000+.
BTC/USD is showing early signs of reversal after liquidity collection below key lows. A pullback toward $106,500 could offer an ideal long entry opportunity, with upside targets around $109,700. Traders should watch for bullish confirmation before entering to validate momentum continuation.

BTC Moon or Crash? I personally think BTC will move higher from this area the lowest point being 109,556 if even touched, Price has been hovering above vwap,and volume profile showing we are currently at POC we should see a breakout soon, areas of interest being 113,216 and 115,189
both areas having some serious selling pressure.
if 109,556 is broken we could be facing some serious selling pressure and seeing BTC reaching low 100K area.

BTC 10/03Looking at BTC's daily chart: An ascending triangle forming after the rally from 90k, with price hovering around 105k. The 50-day MA acts as strong support, and that recent golden cross signals more upside. Why this setup? Volume's ramping on bullish candles, MACD turning positive—in my trading experience, these alignments spark 10-15% moves. Add in ETF inflows and post-halving momentum for extra fuel 💡.
Entry at 106700 confirms the breakout. Stop at 103300 guards against pullbacks—always risk just 1-2% per trade. Profit at 115500 aligns with 1.618 fib, but trail if it runs. Key rule: Enter with patience, exit with discipline. Know the market to know yourself and avoid overreaching. Risk management: Size positions by stop distance, aim for 5:1 reward/risk.
How's your BTC play shaping up? Comment below or subscribe for daily tips! 🔑

BTCSupport will hold for $BTC. This looks like the final visit to the bottom before a major blast off from the megaphone pattern. Structure remains intact, and momentum is coiling up for a powerful move to the upside.

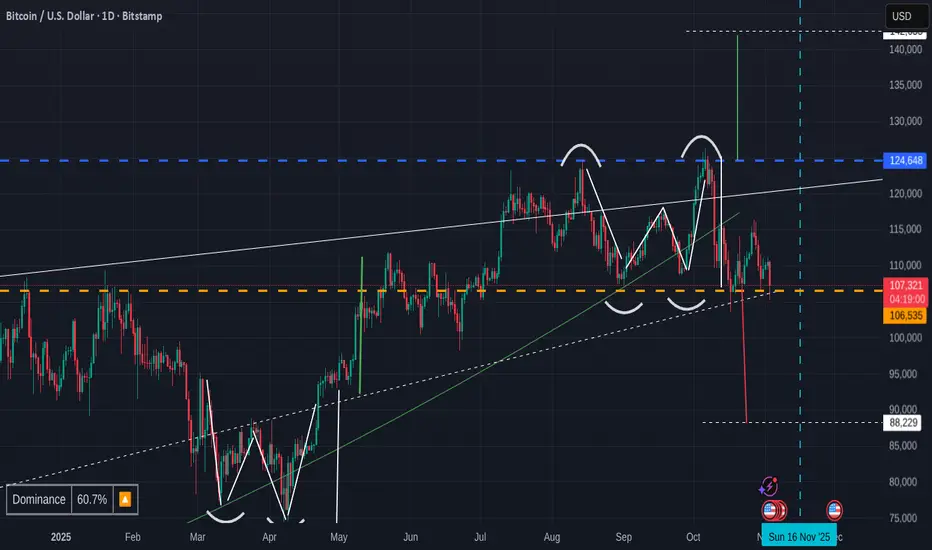
Another quick BITCOIN Daily UPDATE -old chart revisited
I posted this idea on TV at the beginning of October.
Using the W trading idea and / The use of Double Top and / or Double Bottom
We certainly got Bearish side of this idea over that weekend.
And if that support breaks that we currently sit on, then we may well see the lower side of the measured move before we begin to regain confidence.
This could see 88K on a wick down from mid 90K
Sadly, I am avle to also mention that we have printed a mini Head and shoulders and so, a measured move from that could be to around 98K
The Daily MACD
Is in a Descending channel and the lower trendline hits support 2nd week of November
WE do have the possibility of repeating the October PA moves and, as explained in the monthly Candle colout report, this is almost expected now.
Hang in there.
This could well be here to destabilise the market...Get you to run back to FIAT.
December WILL BE DIFFERENT.
But whi knows..NOVEMBER may suddenly turn up and take us all with it....
Just HODL your Bitcoin until we know thongs for Certain.
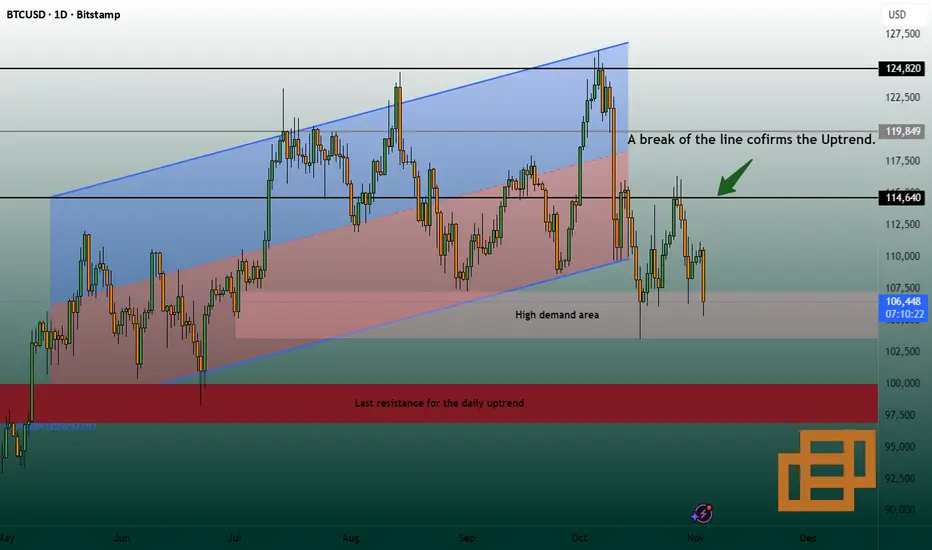
BTCUSD – Reversal Setup from Major Demand ZoneBitcoin has pulled back into a strong demand zone ($103,000 – $106,000), the same area that fueled the last major rally in October. This level has acted as a high-volume accumulation zone, suggesting large buyers may once again be preparing to push price higher.
If BTC holds this area, we could see a bullish recovery targeting the next supply zones:
First target: $115,000 (mid supply)
Second target: $123,000 – $124,000 (major resistance / liquidity zone)
🔹 Entry Idea: Look for bullish confirmation (rejection candle, engulfing, or break of lower high) around the green zone
🔹 Target Zones: $115,000 → $124,000
🔹 Stop Loss: Below $103,000
🔹 Risk–Reward: Approx. 1:3 – 1:4
🧠 Technical Outlook:
Higher timeframe still forming a bullish structure.
Current retracement provides a possible smart money buy opportunity.
Watch how price reacts during upcoming U.S. economic events — potential volatility expected.
---
💬 Will BTC bounce from this zone or dip deeper before the next leg up? Let’s discuss below 👇
#BTCUSD #Bitcoin #Crypto #TradingView #PriceAction #SmartMoneyConcepts #CryptoAnalysis #BTCForecast #TechnicalAnalysis

$BTC insane range for this week ! CRYPTOCAP:BTC last week low effect !
if we want higher we have to see :
London high 108.3K
109.4K FVG
and monday high 110.7K ! step by step .
and we can hope to see range high at 117k.
otherwise we might revisit october low 103K
lets see daily close for today .

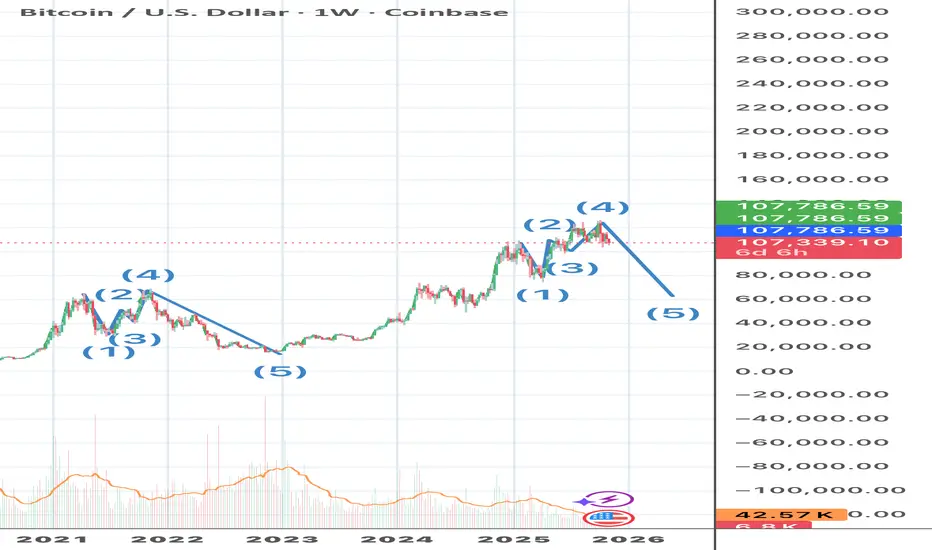
Bitcoin: You Need to Know This Before it HappensIt’s time I share something that’s consistently paid off for me, and I want you to understand it too, because there’s enough opportunity for all of us to win.
Here’s the truth: Bitcoin and most modern assets aren’t just traded by people anymore, they’re traded by algorithms. These systems follow patterns that, once you recognize them, become surprisingly predictable and profitable.
Each market cycle follows the same rhythm: a powerful bull run, massive profit-taking, and then a reset. But here’s what’s key, with every new cycle, large institutions are stepping in with bigger positions and deeper leverage. That’s why these patterns grow wider and taller each time, the scale increases right along with the money flowing in.
We’ve now reached the top of this current cycle, completing a familiar algorithm that’s played out again and again.
So what does this mean for you?
If you’re into shorting, this is the window to consider it. If you’d rather ride the next bull wave, patience will pay, wait for the price to retrace near $60,000. That’s where the next opportunity begins. And the next cycle? It’ll be even bigger, longer, taller, and more explosive than before.
The more you understand these repeating patterns, the more power you hold in the market. Let’s keep learning, growing, and profiting, together.
BTC/ETH/USD Failed BreakoutBTC ETH failed to breakout after last Thursday's local LOW. There's a potential for making a new local LOW this mid-week (Wed/Thur). Key levels to watch for reversals are the red lines on the charts.

BTC LONG TERM CUP & HANDLEBTC LONG TERM CUP & HANDLE on WEEKLY CHART.
usually cup and handle shows promising upside break. wait and watch for now.

BTCUSD — RangeBTCUSD — Range Dilemma
🧭 Context
BTC attacked the daily volume low at 106 463.30 — precise hit, clean reaction, but no reclaim yet.
Price stalled under that zone through NY session, keeping structure heavy while the dollar impulse held firm.
The move reflects a controlled liquidity sweep, not yet a shift in intent.
📈 Technical POV
We’re parked at the 106 463.30 daily volume node, the structural hinge of the current range.
A close below confirms algorithms pressing the next leg lower.
If we reclaim and hold above, the path opens toward 111 629, the next liquidity magnet capped by a single-print zone.
Daily structure remains stretched; weekly bias still corrective.
🌍 Macro View
Dollar strength persists after the Fed’s “pause for now” tone and steady 4 % yields.
Global risk tone stays cautious — crypto remains reactive, not leading.
Until DXY cools off, BTC trades inside compression with limited directional clarity.
🎯 Plan
Patience first.
Wait for a 1-hour structure shift to confirm bias.
If the dollar corrects, BTC can rotate higher; if not, expect continued testing near the lows.
🧠 CORE5 Note
Professionals don’t chase noise.
They let structure prove strength before conviction follows.
Institutional Logic. Modern Technology. Real Freedom.

$BTCUSD Wyckoff accumulation in progress?BITSTAMP:BTCUSD Looking to see if this transforms to Wyckoff accumulation pattern.
Prices went under the neckline but bounced back. I entered long when prices bounced to $106,400 betting the neckline will hold.
If the neckline holds and prices take out resistances from the above, then Wyckoff accumulation pattern would be confirmed.
Range bound until either resistance breaks ($114K - 116K) or the neckline breaks ($106K)

Bitcoin Rebound from Support Zone Targets 109,400Bitcoin (BTC/USD) is rebounding from the support zone near 106,000, showing signs of a potential upward move. The next resistance targets are around 108,000 and 109,400 levels.

BTCUSD Buyers Take ControlBitcoin is entering a renewed bullish phase as market structure strengthens and buyer activity intensifies. After a prolonged consolidation period, price behavior reflects accumulation dynamics — a typical precursor to sustained upward expansion. The transition from neutral to bullish momentum suggests a shift in sentiment across both institutional and retail participants.
Liquidity flow analysis shows consistent buy-side dominance, with capital steadily rotating back into Bitcoin. Market depth has improved, and volume data confirms that large participants are increasing exposure. Each corrective move has been met with aggressive absorption, signaling strong conviction from buyers. This pattern typically precedes directional expansion as selling pressure weakens and liquidity concentrates near higher value zones.
Volatility has normalized, maintaining a balanced rhythm favorable for trend continuation. The steady climb in momentum indicators implies that Bitcoin is building the energy required for a breakout phase. With trading activity expanding in alignment with positive sentiment, the structure supports the idea of a controlled upward advance rather than an impulsive spike.
Investor behavior mirrors early-stage bull market psychology — patient accumulation, reduced panic selling, and growing optimism. This environment tends to generate sustained price appreciation as confidence fuels consistent capital inflow.
Overall, Bitcoin’s market conditions favor a continuation of the current upward trajectory. Stability, liquidity concentration, and persistent buyer strength suggest a medium-term bullish cycle is underway.

Bitcoin Daily Analysis – November 03, 2025Welcome back to Bitcoin Daily Analysis 💹
😶🌫️ Bitcoin is currently facing a lot of uncertainty — market conditions have created confusion among both short-term and long-term holders.
In my opinion, we’re in a phase where it’s best to wait and observe how price reacts to this zone 👀.
Personally, I still believe the overall trend remains bullish 🚀 — as long as we don’t see a confirmed breakdown below the 98,000 zone on the daily timeframe, the bullish structure stays intact 📈
Your profit and capital safety depend on your patience and consistency — so stay behind the charts and be ready to catch the next opportunity 🎯
And as always — don’t forget risk and capital management 💼📉
Disclaimer:
This content is for informational purposes only and does not constitute financial or investment advice. © DIBAPRISM
Larry D.Kohn
BitcoinOver the past four weeks, Bitcoin has once again declined to the 107k support level, which also represents the lower boundary of the 107-125k range. The long-term trend remains upward, but a break below 107k would signal a potential reversal to the downside. We maintain our bullish outlook for now, but will revise it downward should the negative scenario materialize.
Long-term trend: Up
Resistance level: 125000
Support level: 107000

BTCUSD | Consolidating Below $110K Amid Bearish Pressure ₿BTCUSD – MARKET OVERVIEW | Consolidating Below $110K Amid Bearish Pressure ₿
Bitcoin continues to show a bearish momentum, having stabilized below $110.36K, which supports the outlook for a potential move lower toward $106.20K.
For now, the price is expected to consolidate between $110.30K and $106.20K until a breakout occurs.
A confirmed 4H candle close below $106.20K would signal further bearish continuation toward $102.64K.
However, if Bitcoin closes a 4H candle above $110.37K, the structure would shift to bullish, targeting $113.80K initially.
📊 Key Technical Levels
Pivot Line: $110.36K
Support: $106.21K · $102.64K · $98.95K
Resistance: $113.80K · $116.47K · $120.60K
💡 Outlook:
BTCUSD remains bearish while below $110.36K, with potential downside toward $106.20K.
A confirmed 4H close below $106.20K would extend the correction to $102.64K,
while a 4H close above $110.37K would shift the bias to bullish toward $113.80K and beyond.

$BTC capitulation low?BTC looks like it's bottomed here. Everyone is looking for $98-100k, but I don't think we get it yet.
I think it's likely that we bounce towards the upper resistances from here, potentially even seeing a new high up at $126k, or revisiting the $122k region.
Let's see how it plays out from here.

LONG on BTCUSDSimple strategy, small SL great TP. Fibonacci retracement and magical number 88,6%
Good luck!

Bitcoin Daily likely towards $100K1). Hit Trend-line resistance. 2). Dropping on a 5-wave sequence. 3). Dropping pitch is steep with momentum. 4). Trump's China Tariffs were the US$ strength catalyst, which is the other side of the equation!
