Bitcoin Rebound from Support Zone Targets 109,400Bitcoin (BTC/USD) is rebounding from the support zone near 106,000, showing signs of a potential upward move. The next resistance targets are around 108,000 and 109,400 levels.
Trade ideas

BTCUSD Buyers Take ControlBitcoin is entering a renewed bullish phase as market structure strengthens and buyer activity intensifies. After a prolonged consolidation period, price behavior reflects accumulation dynamics — a typical precursor to sustained upward expansion. The transition from neutral to bullish momentum suggests a shift in sentiment across both institutional and retail participants.
Liquidity flow analysis shows consistent buy-side dominance, with capital steadily rotating back into Bitcoin. Market depth has improved, and volume data confirms that large participants are increasing exposure. Each corrective move has been met with aggressive absorption, signaling strong conviction from buyers. This pattern typically precedes directional expansion as selling pressure weakens and liquidity concentrates near higher value zones.
Volatility has normalized, maintaining a balanced rhythm favorable for trend continuation. The steady climb in momentum indicators implies that Bitcoin is building the energy required for a breakout phase. With trading activity expanding in alignment with positive sentiment, the structure supports the idea of a controlled upward advance rather than an impulsive spike.
Investor behavior mirrors early-stage bull market psychology — patient accumulation, reduced panic selling, and growing optimism. This environment tends to generate sustained price appreciation as confidence fuels consistent capital inflow.
Overall, Bitcoin’s market conditions favor a continuation of the current upward trajectory. Stability, liquidity concentration, and persistent buyer strength suggest a medium-term bullish cycle is underway.

Bitcoin Daily Analysis – November 03, 2025Welcome back to Bitcoin Daily Analysis 💹
😶🌫️ Bitcoin is currently facing a lot of uncertainty — market conditions have created confusion among both short-term and long-term holders.
In my opinion, we’re in a phase where it’s best to wait and observe how price reacts to this zone 👀.
Personally, I still believe the overall trend remains bullish 🚀 — as long as we don’t see a confirmed breakdown below the 98,000 zone on the daily timeframe, the bullish structure stays intact 📈
Your profit and capital safety depend on your patience and consistency — so stay behind the charts and be ready to catch the next opportunity 🎯
And as always — don’t forget risk and capital management 💼📉
Disclaimer:
This content is for informational purposes only and does not constitute financial or investment advice. © DIBAPRISM
Larry D.Kohn
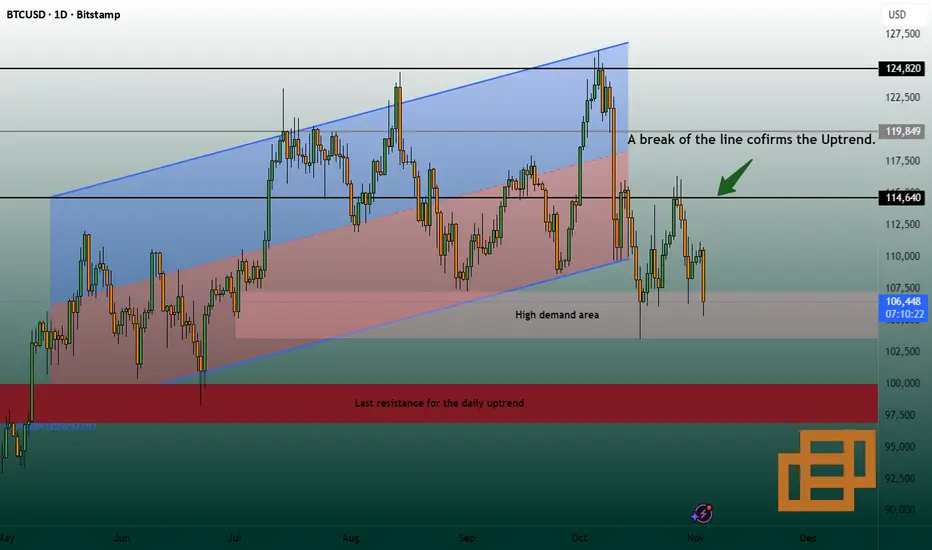
BitcoinOver the past four weeks, Bitcoin has once again declined to the 107k support level, which also represents the lower boundary of the 107-125k range. The long-term trend remains upward, but a break below 107k would signal a potential reversal to the downside. We maintain our bullish outlook for now, but will revise it downward should the negative scenario materialize.
Long-term trend: Up
Resistance level: 125000
Support level: 107000

BTCUSD | Consolidating Below $110K Amid Bearish Pressure ₿BTCUSD – MARKET OVERVIEW | Consolidating Below $110K Amid Bearish Pressure ₿
Bitcoin continues to show a bearish momentum, having stabilized below $110.36K, which supports the outlook for a potential move lower toward $106.20K.
For now, the price is expected to consolidate between $110.30K and $106.20K until a breakout occurs.
A confirmed 4H candle close below $106.20K would signal further bearish continuation toward $102.64K.
However, if Bitcoin closes a 4H candle above $110.37K, the structure would shift to bullish, targeting $113.80K initially.
📊 Key Technical Levels
Pivot Line: $110.36K
Support: $106.21K · $102.64K · $98.95K
Resistance: $113.80K · $116.47K · $120.60K
💡 Outlook:
BTCUSD remains bearish while below $110.36K, with potential downside toward $106.20K.
A confirmed 4H close below $106.20K would extend the correction to $102.64K,
while a 4H close above $110.37K would shift the bias to bullish toward $113.80K and beyond.

$BTC capitulation low?BTC looks like it's bottomed here. Everyone is looking for $98-100k, but I don't think we get it yet.
I think it's likely that we bounce towards the upper resistances from here, potentially even seeing a new high up at $126k, or revisiting the $122k region.
Let's see how it plays out from here.

LONG on BTCUSDSimple strategy, small SL great TP. Fibonacci retracement and magical number 88,6%
Good luck!

Bitcoin Daily likely towards $100K1). Hit Trend-line resistance. 2). Dropping on a 5-wave sequence. 3). Dropping pitch is steep with momentum. 4). Trump's China Tariffs were the US$ strength catalyst, which is the other side of the equation!

Monthly Analysis: Bitcoin (BTC), Issue 279 The analyst expects Bitcoin’s price to decline by the specified end time (countdown timer), based on quantitative analysis.
The take-profit level simply represents a potential price range during this period — it’s optional and not a guarantee that the price will reach it.
You don’t need to go all-in or use leverage to trade wisely.
Allocating only a portion of your capital helps keep overall risk low.
Our approach follows institutional portfolio management principles — not the “all-in or blow-up” style often promoted on social media.
Performance is evaluated over the entire time window, regardless of whether the take-profit level is hit.
The validity of this analysis is based on a specific time range (until 01 Dec 2025), and after this period, the analysis will be reviewed and updated (once every 28 days).

Today's Bitcoin Trading Strategy1.Big players are quietly selling
In the past few days, "wealthy individuals" who hold a large amount of Bitcoin (such as accounts that can transfer hundreds at a time) have been transferring more Bitcoin to the exchange - the exchange is where they sell the currency. This indicates that they may want to cash out at the current price. Meanwhile, small retail investors are buying. This "big players selling, small retail investors buying" situation often leads to a downward trend in prices.
1.The rebound stalls at a key position
Previously, the price couldn't rise further after rising from $107,000 to around $109,000. It tried several times but failed to break through $110,000. It's like climbing halfway up a mountain and being blocked by a big rock. The effort to climb higher becomes smaller and smaller, and it is likely to retreat.
1.Market sentiment is not so optimistic
Previously, everyone thought the price would continue to rise, but recently the number of people who wanted to "bet on the rise" has decreased - for example, some bought "contracts that can make money when the price rises", but now the number of such contracts is less than before, while the number of "contracts that can make money when the price falls" has increased, indicating that many people have started to think that the price may fall.
Today's Bitcoin Trading Strategy
sell:109000-110000
tp:108000-107000
sl:111000

Today's Bitcoin Trading StrategyUS stocks "lagged behind", and Bitcoin followed suit in decline.
The correlation between Bitcoin and US technology stocks has always been high. Recently, US technology stocks suffered a significant drop due to poor performance (the Nasdaq index fell by 2.8% in 3 days), and Bitcoin was also dragged down along with them. It's like two balloons tied together; if one falls down, the other cannot fly either. More importantly, expectations for the Fed's interest rate cuts have weakened - previously, it was thought that there would be frequent rate cuts, but now it's believed that it might take longer, and slower rate cuts mean less "cheap money", making risky assets like Bitcoin more prone to being sold off.
Today's Bitcoin Trading Strategy
sell:108000-109000
tp:107000-106000
sl:110000

Today's Bitcoin Trading StrategyThe price trend has shown a "double top reversal"
When looking at the K-line chart, it is clearly visible that Bitcoin previously rose to a high of $12.6, then fell back and tried to rise again, but failed to exceed the previous high, forming an "M" shape (which is what people call a double top). This is like climbing a mountain. The first time reaching the top without stabilizing caused a fall, and the second time climbing, although close to the top, lacked the strength to go up, so it could only slide further down. Now the price has fallen below the middle low point of this "M" shape, indicating that the downward trend is very obvious.
The external environment has worsened, and Bitcoin cannot withstand it
Recently, the global market has been unstable. For example, trade policies have changed, and there are concerns that inflation will rebound. Everyone starts to buy gold, US dollars and other safe-haven assets, while they are less inclined to touch risky assets like Bitcoin. Moreover, the "expectation of interest rate cuts" that supported Bitcoin's rise has weakened. People are unsure if there will be further interest rate cuts in the future, and no one dares to buy Bitcoin boldly. The price naturally lost the momentum to rise and was more likely to be pushed down by selling pressure.
Today's Bitcoin Trading Strategy
sell:108000-109000
tp:107000-106000
sl:110000

BTCPreferably suitable for scalping and accurate as long as you watch carefully the price action with the drawn areas.
With your likes and comments, you give me enough energy to provide the best analysis on an ongoing basis.
And if you needed any analysis that was not on the page, you can ask me with a comment or a personal message.
Enjoy Trading ;)

BTCUSD 15m – Breakout from Bullish FlagPrice tapped into a strong demand zone (106.7k – 107.3k)
Formed a bullish flag after liquidity sweep
Breakout confirmed with solid bullish momentum
Targeting 109.3k short-term
Setup valid above 107.0k

Bitcoin Trades Within Defined Channel — Liquidity Below $100KBitcoin continues to move within a well-defined trading channel, with the range high at $126,000 and the range low sitting just below $100,000. This clear structural formation highlights a period of controlled consolidation, where price oscillates between two major liquidity zones.
Given the current positioning, momentum favors a rotation toward the range low, as bearish liquidity builds below the current trading area. This potential sweep of downside liquidity would align with Bitcoin’s typical range behavior — taking out weak lows before initiating another expansion phase back toward the range high.
Key Points:
- Range Structure: Well-established channel between $126K (high) and sub-$100K (low).
- Liquidity Bias: Bearish liquidity beneath current levels increases probability of a move lower.
- Range Continuation: Liquidity sweep below $100K could fuel the next rotation upward.
From a technical perspective, Bitcoin remains range-bound, but the next significant move will depend on how the market reacts around the $100K liquidity pocket.
What to Expect:
Expect a short-term dip toward sub-$100K levels as liquidity is cleared, followed by a potential rotation back toward $126K to maintain the broader range structure.

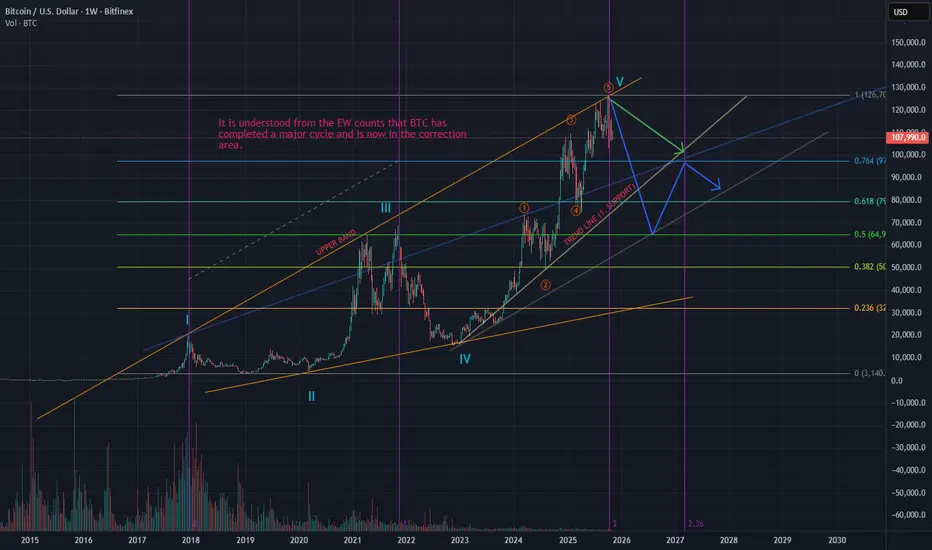
COULD BTC HAVE COMPLETED İTS MAJOR CYCLE?As can be seen from the BTC chart, the major expanding triangle pattern appears to be complete. On the chart, point 5-5 corresponds to point 2 on the Fibonacci timeframe. While a deep decline at point 1 on the Fibonacci timeframe doesn't necessarily mean a similarly deep decline at point 2, we can consider this as supporting our argument.
In the current situation, I believe it would be inappropriate to talk about a new rise unless the upper band is broken. In light of all these wave principles, price accumulation at support levels should be observed.
Please note that this projection, created for professional traders, is a probability based on new wave scenarios and carries the risk that the price may move outside our expectations. This is not investment advice.