50 week MA dont lieWe are at make or brake on bull market. As long as Bitcoin's price remains above the 50-week moving average, we generally maintain a long-term bullish bias. This indicator has historically defined major cycle lows, and holding above it suggests the uptrend is intact.
Trade ideas

Bitcoin Daily Analysis #13 – November 17, 2025Welcome to another Bitcoin analysis — and apologies for the delay.
As we can see, our bearish scenario has strengthened, and on the daily timeframe, BTC has officially turned downward 📉.
It’s still unclear whether this move is just a correction wave or a full trend reversal, but based on the candle volume, there’s potential for deeper pullbacks ahead.
If Bitcoin reclaims the 106,000 zone and holds strongly above it, the bullish outlook can return 🔄📈.
But if we get rejected from this level once more, we can safely say the trend has shifted into a clear downtrend.
There’s solid buying orders around the 90,000 zone, and we need to see how price reacts there.
A break below this level would make the bullish scenario much harder to achieve 🚨.
Additionally, after building a consolidation box in this region — or waiting for clearer structure — there may be an opportunity to take a short position 📉🟥.
Disclaimer:
This content is for informational purposes only and does not constitute financial or investment advice. © DIBAPRISM
Larry D.Kohn

BTCUSDT Weekly Chart Analysis !BTCUSDT Weekly Chart – Full Analysis
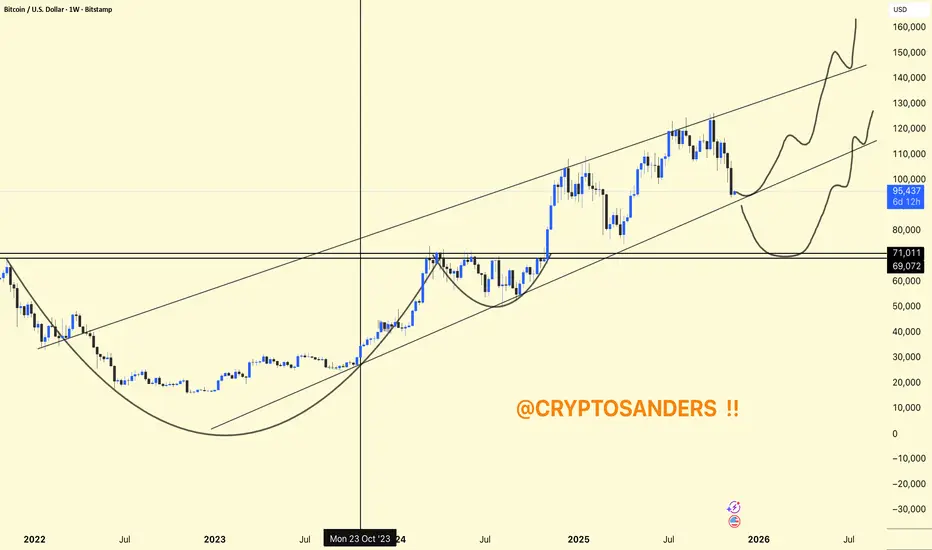
Bitcoin is trading within a long-term rising channel, maintaining higher highs and higher lows over multiple years.
Recent Structure: After a powerful uptrend, BTC is currently retesting the midline of the channel as support, which aligns closely with historical breakout levels.
Chart Patterns: Two notable cup-and-handle formations are marked, suggesting strong accumulation phases followed by aggressive rallies. Both patterns played out bullishly with price surges.
Immediate support is in the $90,000–$95,000 region (lower channel line). If lost, deeper support lies around $71,000–$69,000.
BTC holds this channel and midline; the upside path targets $140,000–$160,000 based on the channel ceiling.
A breakdown would likely cause a deeper retrace, with potential demand return at lower horizontal supports.
Short-term volatility is likely, but as long as the major uptrend and channel structure remain intact, BTC is poised for higher targets into 2026.
BTC's weekly chart is still constructive, with a bullish long-term structure, but critical support is being tested. Holding this range could set up for a continuation to new all-time highs, while a breakdown would mean a deeper consolidation first.
DYOR | NFA
BTCUSD: Long Trade Explained
BTCUSD
- Classic bullish setup
- Our team expects bullish continuation
SUGGESTED TRADE:
Swing Trade
Long BTCUSD
Entry Point - 94425
Stop Loss - 93072
Take Profit - 97018
Our Risk - 1%
Start protection of your profits from lower levels
Disclosure: I am part of Trade Nation's Influencer program and receive a monthly fee for using their TradingView charts in my analysis.
❤️ Please, support our work with like & comment! ❤️

Oct. correction may be over soon!1). The ABC corrective is winding down! 2). Wave 5 loves the 1.272 Fib level. 5). Wave 5 at $97K may be a great BUY discount towards $130K! 6). Bullish Risk is favored with Rate-cuts!

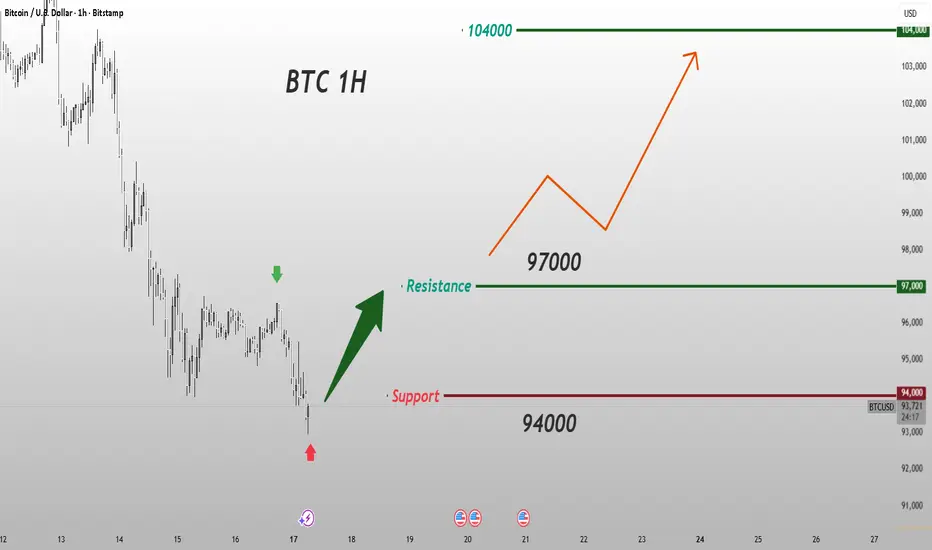
BITCOIN 1Hr AnalysisHere is a analysis of bitcoin on 1hr timeframe. We might see ATH probably this or next week. If the support plays out we might this good upside rise of price and if we see a breakdown and retest it can probably head towards 98000 for some liquidity sweeps.

BTCUSD Tests Buyer Zone — Eyes Break Below $100KHello traders, here’s my current outlook on Bitcoin (BTCUSD). The market continues to trade within a broader bearish structure after breaking down from the previous rising channel. The price failed to hold above the $110,000–$111,000 Seller Zone, where multiple fake breakouts occurred, indicating strong bearish pressure and aggressive selling activity in that region. After the rejection from the Seller Zone, BTC shifted into a descending trend structure, forming lower highs along a clearly defined Resistance Trendline. Each corrective move to the upside has been capped by this trendline, confirming that sellers are maintaining control. Meanwhile, the Support Level around $100,200–$101,000 has acted as a key Buyer Zone, where price has repeatedly paused and reacted, suggesting that buyers are attempting to absorb selling pressure here. Currently, BTC is consolidating just above this Support Zone, but the overall momentum remains bearish. If the price fails to break above the descending Resistance Line, we could see a continuation of the downtrend, likely pushing toward a retest of the $100,200 Support Level. A confirmed breakdown below this level would expose the next downside support levels and reinforce the sellers’ dominance. However, if buyers manage to hold the price above $100,200 and force a breakout above the descending Resistance Line, a short-term corrective recovery could unfold toward the $103,000–$105,000 region. This area remains critical and is likely where sellers may look to re-enter the market based on previous reaction structure. For now, the market structure favors a bearish bias, with the trend down and sellers maintaining stronger control. I am watching for a reaction at the current support — if the level breaks, continuation lower becomes the primary expectation. Please share this idea with your friends and click Boost 🚀

BITCOIN (BTC/USD): Consolidates—Breakout or Breakdown Ahead?⚠️Bitcoin is currently consolidating following a significant bearish rally.
The price is coiling within a horizontal trading range on a 4-hour timeframe.
Based on the price's reaction to these boundaries, two potential scenarios are anticipated:
Bullish Scenario:
Should the price break and close above 104,640 on a 4-hour timeframe, a bullish trend continuation is expected.
The target for this scenario is 108,000.
Bearish Scenario:
Conversely, if the price drops and closes below 98,780 on the 4-hour timeframe, a bearish movement is anticipated.
The objective for this scenario is 96,000.
Given the current oversold market conditions, a bullish bias is held.
However, further observation is warranted to confirm the market's direction.
What are your expectations?

BTCUSD Short ideaTexchnical factors:
More downside is expect after breaking 2 significant channels, ending the week to close below. Anticipate a rally (eye icon) and watch for price action breakdown on LTF...preferably the 4h chart. Medium term downside to BTC 85,000.00.
Macroeconomic Factors:
BTC's risk-on profile exposes it to global headwinds:
Interest Rates and Monetary Policy: The Fed's hawkish pivot—December rate cut odds at 50% (down from 70%)—has strengthened the USD, pressuring non-yielding assets like BTC. Persistent core inflation (3.2% YoY in October) risks hikes, echoing 2022's bear market when rates crushed crypto by 75%. Post-shutdown liquidity crunches and QT continuation could contract money supply, undermining BTC's "hard money" thesis if global M2 shrinks.
Inflation Hedge Failure: BTC has decoupled negatively from inflation narratives, falling as gold/silver soar amid safe-haven bids. Geopolitical tensions (e.g., U.S.-China trade, Ukraine-Russia) drive flight to fiat, not crypto, with BTC's correlation to tech stocks amplifying selloffs (Nasdaq -2% drag).
Elon Musk's $38T U.S. debt warning has fueled panic, but without policy relief, fiscal woes could trigger broader risk aversion.
Economic Growth: Slowing GDP, rising unemployment (4.1%), and tech sector slumps (AI bubble fears) have eroded risk appetite, with BTC behaving more like a high-beta stock than a hedge. Thin liquidity post-rally exacerbates volatility, as seen in the $19 billion liquidation.
Dovish hopes are fading, leaving BTC exposed to a tightening cycle.

Bitcoin - the end of historyBitcoin has completed wave at $126,272.
According to the Wave Principle, a correction - - will now unfold.
It's intriguing to speculate what Bitcoin might be doing in October 2026.


BTC/USD strong buy trend bullish from key support 102,500 BTC/USD Update – 1H Timeframe 🔥
BTC is showing a strong buy trend. Current support is around $102,500, presenting a potential buy opportunity.
Technical Targets / Resistance Levels:
$104,400
$105,000
$106,500
Note: Always use proper risk management and position sizing before entering trades.
✅ Like, Follow, Comment & Share for more updates.

$BTCUSD CONTINUES TO DECLINE.BITSTAMP:BTCUSD is trending bearish. It continues to decline as the prevailing trend is bearish. I expect price to fall further as market keeps printing new lows. A sell opportunity is envisaged.

BTCPreferably suitable for scalping and accurate as long as you watch carefully the price action with the drawn areas.
With your likes and comments, you give me enough energy to provide the best analysis on an ongoing basis.
And if you needed any analysis that was not on the page, you can ask me with a comment or a personal message.
Enjoy Trading ;)

BTCUSD Triple Bottom Rejection and A Falling WedgeLong confirmations are strong here. Not yet time to short BTC.

BTC PERPETUAL TRADE BUY SETUP Long from $103,400BTC PERPETUAL TRADE
BUY SETUP
Long from $103,400
Currently $103,400
Targeting $105,500 or Above
(Trading plan IF BTC
go down to $102,600 will add more longs)
Follow the notes for updates
In the event of an early exit,
this analysis will be updated.
Its not a Financial advice

Bitcoin Short: Staying in Primary count (down)As I discussed in my previous video, there are 2 ways to count the EW for Bitcoin: 1 long and 1 short. I also mentioned that my bias is to the short side which is why Bitcoin short is the primary count while the long is the alternate count.
Over in this idea, I am updating the counts based on the short primary counts. The stop loss for this idea will be above sub-wave 2, or above $107,800. The Take Profit Target will be cycle wave 4 low, or around $74,400.
Good luck!

Bitcoin Analysis and StrategiesYesterday, Monday, the market opened with an initial upward move, reaching a high of 106.6k before pulling back. During the US session, it bottomed at 104.6k before rebounding, ultimately closing around 106k, forming a consecutive bullish pattern on the daily chart. Today, it opened higher, reaching around 107.5k.
Currently, the daily chart shows three consecutive positive days, which is indeed quite good considering the overall upward trend. However, we cannot ignore the weakness on the weekly chart, nor can we ignore Tuesday's usual decline. The decline in the past few days has created a lot of resistance. Now, the bulls are constantly making new highs, so we need to continue to look for new resistance. Today, we should focus on the 110k-110.5k area. On the first touch, we can consider a small short position to profit from a short-term downward move.
Yesterday, the price tested 104.6k multiple times and rebounded. This point was also the highest point of the first rebound since the 99k decline. At that time, the starting point of the new round of decline was 104.5k. The subsequent breakout formed a top-to-bottom reversal. Firstly, the four-hour chart closed relatively weakly. For today, if the price turns downward again, I think the 104.8k-105.8k points are likely to form support and lead to a rebound. However, the specific point will depend on the real-time dynamics of the four-hour and hourly charts.

ANFIBO | BTCUSD - Still in a boring range [11.11.2025]Hey guys, Anfibo's here!
BTCUSD Analysis – Daily Trading Plan
Overall Picture:
The prior sell at $107,000 executed according to plan and produced a clean, profitable outcome — well done to those who took it and locked in gains. Currently BITSTAMP:BTCUSD is trading in a sideways, slightly upward-drifting range as liquidity is being gathered beneath the upper trend boundary. Momentum is constructive but not yet impulsive; therefore the highest-probability edge today is to wait for price to touch the established trendline and read the reaction there before committing to fresh short exposure.
Trading Plan for Today:
>>> BUY ZONE:(x1000)
ENTRY: 104 - 105
SL: 103
TP: 110
>>> SELL ZONE: (x1000)
ENTRY: 109 - 110
SL: 111.5
TP: 104 - 95
Risk Management:
- Risk a controlled percentage of equity per trade (e.g., 1–2% max capital risk per position) and size positions so SL distance equals the planned risk.
- Scale sizing: take a smaller initial position at Entry (1) and add selectively at Entry (2) only after clear bearish rejection or failed retest.
- Use tight, logical SLs (as listed) and consider moving SL to breakeven once TP1 is achieved to protect gains.
- Monitor intraday volatility and major news — reduce size or sit out if market structure becomes erratic or if a scheduled macro event is imminent.
Conclusion:
The market rewarded our prior sell at $107k — a good example of discipline and structure-based trading. Today’s plan remains conservative: let BTC approach the trendline / upper channel, observe price reaction, and initiate short exposure only on a clear rejection or failed retest. Maintain strict risk controls, scale thoughtfully, and avoid averaging into a losing trade. This patient, reaction-based approach keeps the odds in our favor while respecting the prevailing range dynamics.
HAVE A NICE DAY, GUYS!

BUY BTCUSDThis is a long (buy) setup off a key support zone with a tight stop and a higher target. The trade works if buyers continue defending the grey zone. A break below it would invalidate the bullish bias.

Going long without adhering to the old linkage logicCross-market linkage: Non-US funds step in, strengthening the negative correlation with the US dollar
The correlation between Bitcoin and non-US markets has significantly increased, forming a financial support independent of the US stock market. In the past two weeks, the proportion of spot trading volume in non-US regions such as Singapore, the United Arab Emirates, and Hong Kong has risen from 35% to 48%, becoming a core source of incremental funds - among them, the BTC net inflow at the Singapore digital exchange ZebPay has increased by 210% month-on-month, and ADABank in the United Arab Emirates launched the "digital asset-linked wealth management" product with a fundraising scale of over 500 million US dollars. Non-US funds have a higher risk appetite and continue to release their capacity to absorb the 94,000 US dollar range. At the same time, the negative correlation coefficient between Bitcoin and the US dollar index has risen to a historical high of -0.81. Currently, the US dollar index has dropped from the 101 level to the 99.5 range, and the weakening of the US dollar directly reduces the holding cost of Bitcoin. Coupled with the M2 growth rate of non-US economies remaining at a high level of 11.2%, cross-market liquidity provides macro momentum for the price rebound.
Bitcoin trading strategy
buy:94000-95000
tp:96000-97000
sl:93600
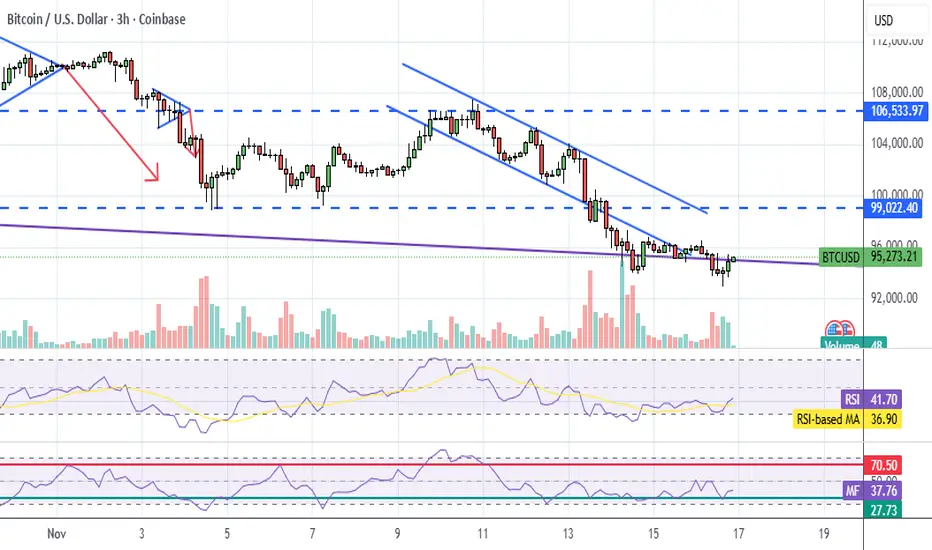
BTC 3 hr plotLooks like it's trying to bounce up, but I'm not gonna go long until I see MFI and RSI break above 50 once. BTC melted down all of last week.
#Bitcoin Sunday Update! I'm still bearish? Bitcoin Sunday Update!
CRYPTOCAP:BTC is holding below 100K, and I'm still bearish. The 1W 50 EMA, which Bitcoin repeatedly used as major support throughout the entire cycle, has now been broken. If BTC closes below this level by the end of Sunday, it will confirm that momentum remains to the downside and open the move toward the 92K to 90K CME gap and potentially even lower targets.
Some people on X talking about the death cross misinterpret it as something bullish, and the Fear and Greed Index at extreme lows is often taken to mean the bottom is in. Don't be fooled by these influencers. That idea is completely wrong when a new bear market is starting. I still remember in 2021 when BTC dropped from 68K to 50K—the Fear and Greed Index hit 16, which is extreme fear, yet Bitcoin continued dropping much lower.
Bitcoin is almost 25K down, and still you’re seeing bullish news, which means more dump is coming. Don't be fooled until this level is confirmed. This one-week 50 EMA is the most important for this bull market. Insider activity shows selling in Bitcoin and stocks continues.
As for my position: I am still holding my short. When and if I close or open any new positions, I will update you immediately. My current average entry is around 118K.
