#Bitcoin Sunday Update! I'm still bearish? Bitcoin Sunday Update!
CRYPTOCAP:BTC is holding below 100K, and I'm still bearish. The 1W 50 EMA, which Bitcoin repeatedly used as major support throughout the entire cycle, has now been broken. If BTC closes below this level by the end of Sunday, it will confirm that momentum remains to the downside and open the move toward the 92K to 90K CME gap and potentially even lower targets.
Some people on X talking about the death cross misinterpret it as something bullish, and the Fear and Greed Index at extreme lows is often taken to mean the bottom is in. Don't be fooled by these influencers. That idea is completely wrong when a new bear market is starting. I still remember in 2021 when BTC dropped from 68K to 50K—the Fear and Greed Index hit 16, which is extreme fear, yet Bitcoin continued dropping much lower.
Bitcoin is almost 25K down, and still you’re seeing bullish news, which means more dump is coming. Don't be fooled until this level is confirmed. This one-week 50 EMA is the most important for this bull market. Insider activity shows selling in Bitcoin and stocks continues.
As for my position: I am still holding my short. When and if I close or open any new positions, I will update you immediately. My current average entry is around 118K.
Trade ideas

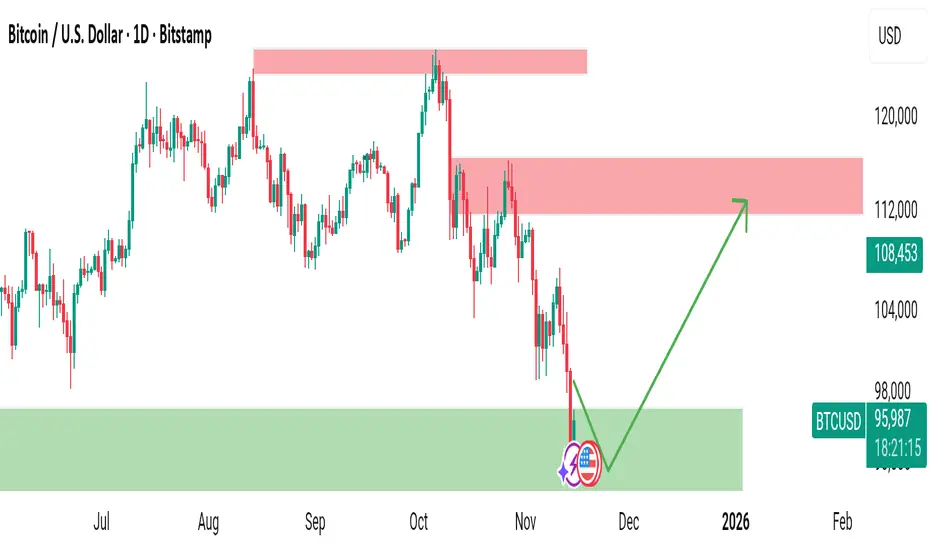
BTCUSD – Major Demand Zone Successfully Tested! | Bullish ReversBitcoin has finally tapped into a major daily demand zone after weeks of aggressive selling. This level has been respected multiple times in the past, and today’s reaction shows buyers stepping back in with confidence.
🔍 Key Analysis
Price recently dumped straight into a strong demand zone (green) that has held since July.
Buyers are now showing early signs of rejection candles → possible shift in momentum.
As long as this zone holds, BTC has a clean upside path toward the $110,000 – $118,000 supply zone (red).
Structure still remains bullish on the higher timeframe despite the recent deep pullback.
This could be the last discounted price before a major rally into Q1 2026.
📈 Bullish Scenario
If price continues holding above this green zone:
First target: $104,000
Main target: $112,000 – $118,000 (major supply)
A break above this zone could open doors to new highs.
⚠️ Bearish Scenario
If bulls fail to defend:
We may see a deeper sweep toward the $90,000 liquidity area before any recovery.
💬 What I’m Watching
Daily candle close inside or above the zone
Reaction during NY and Asia session
Volume confirmation + long-wick rejections
---
📢 What do you think? Bullish bounce or deeper drop?
Drop your thoughts in the comments!
If you found this useful, like, follow, and save for updates. 🚀📊
---
Bitcoin topped versus Gold 11 months ago.On the bright side the cyclical bear market of #BTC vs #GC is actually closer to the end, rather than just starting.
Bitcoin has already lost tremendous value vs the Analog SOV
With previous cyclical Bears lasting maximum 14 months.
Which by that time I believe one if not both of these targets will be met.
The troubling aspect is.
If BTC achieves target 2 --- then once could argue a Double top has formed.
And any subsequent bounce/recovery rally should be treated with suspicion.
And furthers declines and retest of this target 2, could open up the trapdoor for a SECULAR Bear market taking us into 2027 before any meaningful recovery can begin.
This is a merely observation of what has happened and what is currently unfolding with early (pre-coinbase launching) BTC investors unloading supply most of 2025 into their perceived six figure objective.
$100K was always the dream!
Will they buy back next bear?
I suspect only if it becomes cheap enough.
What is cheap for an OG?

Bitcoin’s Bottom Could Be InHey everyone,
After the recent streak of red weeks, I don’t anticipate any major international or geopolitical issues in the next 1–2 months. With the U.S. government reopening, I see significant potential through the end of the year and possibly into Q1 2026.
I believe we’ve reached some critical levels for BTC, and it might be ready to take off soon—maybe next week or even this weekend.
Let’s see how things unfold.
These are my opinions and not financial advise.
Cheers!

BTC Bitcoin Bullish Price Action Here's My Trade PlanBTC just broke to the upside! 💥 On the 🕓 4-hour timeframe, price action looks strong: higher highs and higher lows 📈⬆️. I’m waiting for a pullback 📉—once support is found 🛑 and structure breaks bullish again, I’m considering another buy opportunity 🚀💸.
Not financial advice.


Bitcoin technical breakdown November - 2025Follow for more content and valuable insights about financial markets.
BTC Extends Weak Volatile DeclineBTC witnessed a slight decline with certain price fluctuations today, continuing its recent correction trend. This price drop is a continuation of the ongoing downward trajectory.
Bitcoin had already recorded a significant fall on November 14th. Prior to that, Bitcoin ETFs saw a massive net outflow of approximately 870 million US dollars on November 13th, marking the second-largest single-day withdrawal since the launch of such funds.
Coupled with the market's reevaluation of expectations for the Federal Reserve's interest rate cuts, this has exerted sustained pressure on high-risk assets like Bitcoin, consequently leading to the continuation of the correction trend for Bitcoin's price today.
Today, BTC maintained a weak volatile downward pattern. In the short term, it is constrained by factors such as ETF capital outflows and adjustments to macroeconomic expectations. For the subsequent trend, close attention should be paid to the stability of the support level around 94,000, as well as the shifts in institutional capital flows and marginal changes in macro market sentiment.

Bitcoin One Last DanceBefore the top is in will we have the final leg or not?
Each wave 4 is getting sharper down trend
And each wave 5 is getting weaker up trend
Is there another final leg pushed up to 130K or is the party already over?

BTC/USD key support being testedBitcoin has seen its fair share of turbulence along with equity markets in recent days, with the drop below the $100K level triggering a wave of stops and extending the sell-off. That level also happens to coincide with yesterday’s closing price, making it an obvious pivot; reclaiming it would be a constructive development. Yesterday’s low at $97,870 is another level to keep an eye on for short-term resistance. In terms of support, the zone around 95,200—an area of consolidation before this year’s breakout—has finally been revisited. If it fails to produce a bounce, the next meaningful target for sellers lies near 85,000, a sizeable distance below. At this stage, anything is possible, and the sensible approach is to watch how price behaves around these levels rather than fixating on a single direction. Each reaction offers a potential trading opportunity. My base case is for a bounce back to $100K from here.
By Fawad Razaqzada, market analyst with FOREX.com

If 4 year BTC cycle continuesWith institutional buy on in BTC, it's hard to say that the 4 year BTC cycle will continue, and many are theorizing that BTC will move more in rhythm with traditional equity markets. But, if we do get a 4 year cycle, this is what i'm thinking is a somewhat likely scenario from here over the next 4 years looks like.

BTCUSDT-LIKELY TO HDUMP BELOW 86K[short it]MONTHLY-Disrespect bearish candle
WEEKLY-bearish order flow
Daily bearish context area/bearish order flow
entries should be placed on H1/5mnt upon reaction on DAILY fvg

BTC History Repeating?Is history repeating itself? BTC hits an ATH and pulls back like it did Jan '25 --> Apr '25. I am curious if we will see BTC give us a double bottom again and break out above the down sloping resistance from the ATH.
Keep vigilant.

BTCUSD | NEUTRAL BIAS | DAILY TIMEFRAME Bitcoin isn’t trending — it’s negotiating value.
Price is sitting deep in the discount zone of the broader bullish range while resting directly on the naked point of control at 94,353.90.
This is negotiation, not momentum.
Next week’s US Dollar data will decide whether participation expands or stays muted.
MSM — Market Structure Mapping (The Framework)
Price has rotated into the 74,420 → 126,402 deep-discount region.
Today’s candle prints inside-bar behaviour, meaning the market is compressing and trying to rebalance yesterday’s distribution lower.
This is not breakout behaviour — it’s value discovery.
VFA — Volume Flow Analytics (The Participation Map)
The 94,353.90 NPOC is the key behaviour hinge.
As long as price interacts with this level, participation remains cautious and undecided.
Value is being weighed — not chased.
OFD — Order Flow Dynamics (The Behavior)
Order flow leans bearish on the daily timeframe.
Yesterday’s 99,836 high → 93,984 low shows sellers pressing, but without meaningful delta expansion or aggressive continuation.
Intent here is defensive, not dominant.
PEM — Precision Execution Modeling (The Engagement Rules)
Market is in a controlled daily pullback phase.
The high-probability behaviour target sits below the 91,362 liquidity pool, where stops, inefficiency, and unfinished business remain.
Execution here must stay rule-driven — wait for confirmation, not anticipation.
- NEXT WEEK’S US DOLLAR DRIVERS TO WATCH
Bitcoin’s next move depends less on patterns and more on USD participation.
Key US events:
1. Industrial Production & Manufacturing Data
Weak = USD eases → crypto gains breathing room.
Strong = USD firm → risk assets remain cautious.
2. Housing Starts & Building Permits (High-Impact)
Often shift USD volatility and near-term sentiment.
3. FOMC Minutes + Fed Speaker Schedule
Hawkish tone → Dollar strength → BTC hesitation.
Dovish tone → Dollar ease → BTC participation improves.
4. US Budget & Broader Macro Releases
These feed directly into FX algos → crypto indirectly reacts through risk appetite.
Bitcoin will respond to flows, not predictions.
CORE5 Rule of the Day:
Don’t trade what you hope. Trade what participation confirms.
— CORE5DAN
Institutional Logic. Modern Technology. Real Freedom.

We finish the 4th cycle!The fourth cycle of Bitcoin has finished! Bears are arriving 🐻 usually bitcoin downfall into 0.786 fibonacci level, so maybe be have around 365 days of bearish season but this cycle probably we will reach between 0.5 - 0.618 Fibo levels

BTC Daily Indicators UpdateDaily MFI no longer cycling up, and it looks like it broke through the megaphone line. Might get a bounce here, but this looks VERY bearish in the long run.
IBIT option premiums are very high now, not gonna touch this at all, long or short.

Bitcoin consolidates in correction The next sell-off has taken place and the price is now stable below USD 100k. A pullback and retest of USD 100k from below is conceivable before the correction continues towards USD 85k.

Petrodollars and Their Global Impact1. The Origin of Petrodollars
The concept of petrodollars emerged in the early 1970s following the collapse of the Bretton Woods system and the oil shocks that reshaped global energy markets. After the U.S. decoupled the dollar from gold in 1971, the dollar’s value began to fluctuate freely. In 1973, the Organization of the Petroleum Exporting Countries (OPEC) significantly increased oil prices in response to geopolitical tensions and rising global demand.
At the same time, an agreement between the United States and Saudi Arabia ensured that oil would continue to be priced and traded exclusively in U.S. dollars. This deal effectively globalized the dollar as the primary currency for energy trade. As oil prices surged, exporting countries, particularly in the Middle East, earned enormous dollar revenues. These dollars became known as petrodollars, representing the surplus funds that oil producers accumulated from selling oil abroad.
2. Petrodollar Recycling
Petrodollar recycling refers to how oil-exporting countries reinvest or redistribute their dollar earnings. This recycling process has two main channels:
Financial Recycling: Oil-exporting nations deposit their dollar earnings in international banks or invest them in global financial markets, especially U.S. Treasury securities, stocks, and bonds. This recycling helps sustain global liquidity and supports the U.S. economy by financing its trade and fiscal deficits.
Real Recycling: Petrodollars are used for development projects, infrastructure building, or the import of goods and services. Oil-rich nations often spend their surpluses on foreign products, technology, and defense equipment, which stimulates demand in manufacturing economies such as the U.S., Europe, and increasingly, China.
During the 1970s and 1980s, the recycling of petrodollars was crucial for stabilizing global financial systems. Banks used the inflow of funds from oil exporters to lend to developing nations, leading to an expansion of global credit. However, this also contributed to the debt crises of the 1980s when many borrowing countries were unable to repay their loans.
3. Economic Impacts of Petrodollars
The accumulation and recycling of petrodollars have wide-ranging economic consequences that shape both national and global economies.
a) U.S. Dollar Dominance:
Petrodollars reinforce the U.S. dollar’s role as the world’s reserve currency. Since oil must be purchased in dollars, all countries need to hold large dollar reserves. This creates consistent demand for the dollar, giving the U.S. a unique financial advantage known as “exorbitant privilege.” It allows the U.S. to run persistent trade deficits without facing immediate pressure to devalue its currency.
b) Balance of Payments Effects:
Oil-importing nations often face balance-of-payments deficits when oil prices rise because they need to spend more dollars on energy imports. Conversely, oil-exporting nations accumulate surpluses, strengthening their fiscal positions. These imbalances influence global capital flows, interest rates, and investment patterns.
c) Inflation and Exchange Rates:
Fluctuations in oil prices directly affect inflation rates worldwide. Higher oil prices increase transportation and production costs, driving inflation. Countries with weaker currencies or heavy energy dependence experience greater inflationary pressure. At the same time, oil exporters’ currencies may appreciate due to rising export revenues, affecting their non-oil sectors’ competitiveness.
4. Political and Geopolitical Implications
Petrodollars are not just an economic concept—they carry enormous geopolitical weight. The control and flow of petrodollars often determine international alliances, diplomatic relations, and power structures.
a) U.S.–Middle East Relations:
The petrodollar system strengthened ties between the United States and major oil producers like Saudi Arabia. In exchange for pricing oil in dollars, the U.S. provided military protection and political support to these regimes. This interdependence shaped decades of Middle Eastern geopolitics, influencing regional conflicts and global energy policy.
b) Geopolitical Leverage:
Countries that control oil exports wield considerable influence over global markets. For example, OPEC’s decisions to increase or cut production affect not only oil prices but also inflation, currency values, and economic stability across the globe. The accumulation of petrodollar reserves gives these nations leverage in international diplomacy.
c) Challenge to Dollar Hegemony:
In recent years, some countries, including China, Russia, and Iran, have sought to reduce reliance on the dollar in oil trade, promoting alternatives such as the petroyuan. If major energy exporters begin accepting other currencies, it could gradually weaken the dollar’s dominance and alter global financial power dynamics.
5. Petrodollars and Global Financial Markets
Petrodollar flows significantly influence global capital markets. When oil prices are high, exporters earn more dollars and invest heavily abroad. This results in large capital inflows into Western financial markets, especially the U.S., Europe, and Japan. These funds help maintain low interest rates and high liquidity in developed economies.
For instance, during oil booms, sovereign wealth funds (SWFs) from countries like Saudi Arabia, the United Arab Emirates, and Norway invest billions of dollars in equities, bonds, and infrastructure projects worldwide. These investments provide stability to global markets but also tie the financial fortunes of oil-rich nations to the performance of global assets.
However, during oil price declines, the opposite occurs—oil exporters withdraw funds to support domestic spending, which can tighten global liquidity and trigger financial volatility.
6. Petrodollars and the Developing World
The flow of petrodollars also impacts developing economies in complex ways. On one hand, petrodollar-funded loans and investments have financed infrastructure and industrialization in many developing countries. On the other hand, easy access to petrodollar-driven credit during the 1970s led to unsustainable borrowing, resulting in debt crises across Latin America and Africa.
Today, oil-importing developing nations face fiscal stress when oil prices rise, as more of their foreign exchange reserves are spent on energy imports. This can widen trade deficits and increase inflation. Conversely, oil-exporting developing nations experience economic booms during high oil price periods, though many struggle with the “resource curse”—an overreliance on oil revenues that undermines diversification and governance.
7. The Environmental and Energy Transition Dimension
In the 21st century, the world’s transition toward renewable energy presents new challenges for the petrodollar system. As global efforts to reduce carbon emissions intensify, the demand for oil may gradually decline, reducing the flow of petrodollars. This could weaken the economic power of traditional oil exporters and reshape global financial alignments.
Countries dependent on petrodollar revenues face growing pressure to diversify their economies. Initiatives like Saudi Arabia’s Vision 2030 aim to transform oil-dependent economies into diversified, investment-driven ones. Meanwhile, the shift to green energy could also influence currency dynamics if renewable energy trade begins to operate in non-dollar terms.
8. Conclusion
The petrodollar system has been one of the most influential forces in shaping modern global economics and geopolitics. It strengthened the U.S. dollar’s dominance, facilitated global financial integration, and underpinned strategic alliances, especially between the U.S. and Middle Eastern oil producers. At the same time, it created structural imbalances—linking global liquidity and financial stability to volatile oil prices.
As the world moves toward renewable energy and multipolar finance, the traditional petrodollar system faces challenges from alternative energy sources, new trading currencies, and geopolitical shifts. Nonetheless, as long as oil remains a central component of global energy consumption, petrodollars will continue to shape the global economic order, influencing everything from exchange rates and inflation to political alliances and investment flows.
In essence, petrodollars represent far more than currency—they are the lifeblood of the global energy economy and a cornerstone of modern financial power.

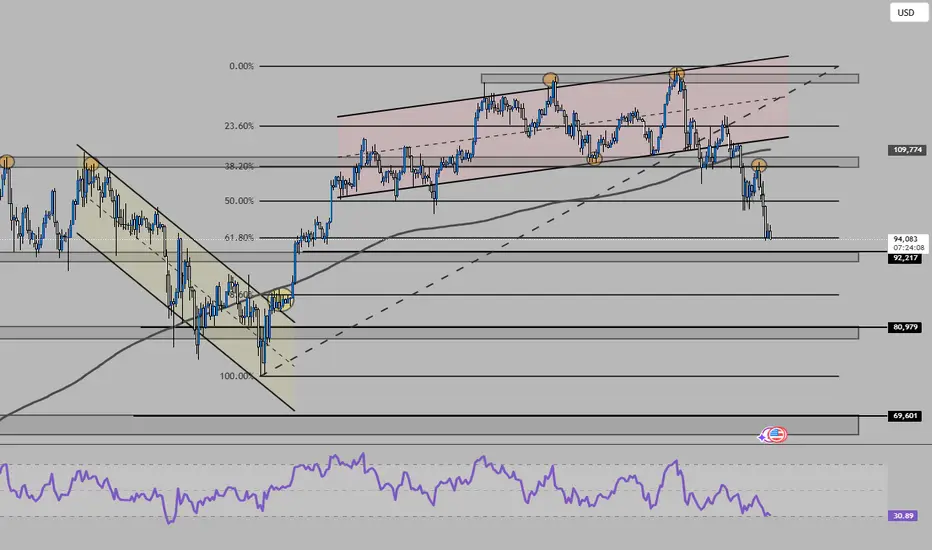
BTCUSD – Perfect Mid-Channel Touch. Eyes on 110K📉 BTCUSD – Perfect Mid-Channel Touch. Eyes on 110K
BTCUSD – Perfect Mid-Channel Touch. Eyes on 110K 🔁📈
Price bounced beautifully off Channel Support ~98,986 and is now hovering just above Mid S/R at 104,634 . That’s the make-or-break zone .
A move toward Top Channel Resistance ~110,080 seems likely — but watch that interaction closely.
No “traps,” no fluff — this is a textbook channel play.
🎯 Targets Above:
• Target 1: 120–122K
• Target 2: 138.8K
📉 Supports Below:
• Mid Channel: 104,634
• Channel Support: 98,986
• Technical Support: 97,389 → 96,281
⚠️ If BTC breaks below the mid-line again, bears may try to retest the green base. For now — structure holds.
Trading Wisdom 📜
You don’t chase Bitcoin. You position around it.
Let the structure guide you. The crowd reacts — the Professor prepares.
Disclaimer: I’m just sharing wisdom, not instructions. No licenses, no guarantees — just years of trading scars and precision chartwork. Be smart, protect your capital, and don’t copy blindly.
One Love,
The FXPROFESSOR 💙

Bitcoin: Testing the Edge of SupportBitcoin: Testing the Edge of Support
Bitcoin continues to face pressure after rejecting the 106,400 resistance zone.
Price is now hovering around a key support area near 103,500, which has acted as both support and resistance multiple times before.
A failed recovery from this zone could open the way for a deeper correction.
Short-term bullish retests may happen, but the bias remains bearish as long as BTC stays below 106K.
Key Targets:
🎯 Quick Target: 99,480
🎯 Target 1: 96,830
🎯 Target 2: 93,970
A break below 103K would rise the chances for continuation of the downtrend toward these lower levels.
You may find more details in the chart!
Thank you and Good Luck!
❤️PS: Please support with a like or comment if you find this analysis useful for your trading day❤️

BRIEFING Week #45 : Growth made the TopHere's your weekly update ! Brought to you each weekend with years of track-record history..
Don't forget to hit the like/follow button if you feel like this post deserves it ;)
That's the best way to support me and help pushing this content to other users.
Kindly,
Phil

BTCUSD : Bulls Trying to Reclaim Momentum!Bitcoin has bounced sharply after a deep correction, hinting at a possible short-term recovery phase. If structure holds, we could see one more leg up before the next consolidation or reversal. Key zone to watch: $105,000–$106,000 for potential resistance.
Disclosure: We are part of Trade Nation's Influencer program and receive a monthly fee for using their TradingView charts in our analysis.

Bitcoin: Is This The Bottom?Will it continue lower? Nah, after a third nasty drop and bears running out of steam all I can see is a bounce for the next 2 weeks , how high it will go? well that nobody knows but what I do know is that the next move is to the UPside to around $110k - $112k.
Lets get ready to rumble. Time to load up the truck . Liquidation point is below $95325
Low lev recommended . Buy now and sell above $110k, (for SPOT ) NO IFs or BUTs.
Buckle up ladies and gentlemen and enjoy the next wild....wild ride.
Have a nice trading weekend.
Boost... Follow....Comment
