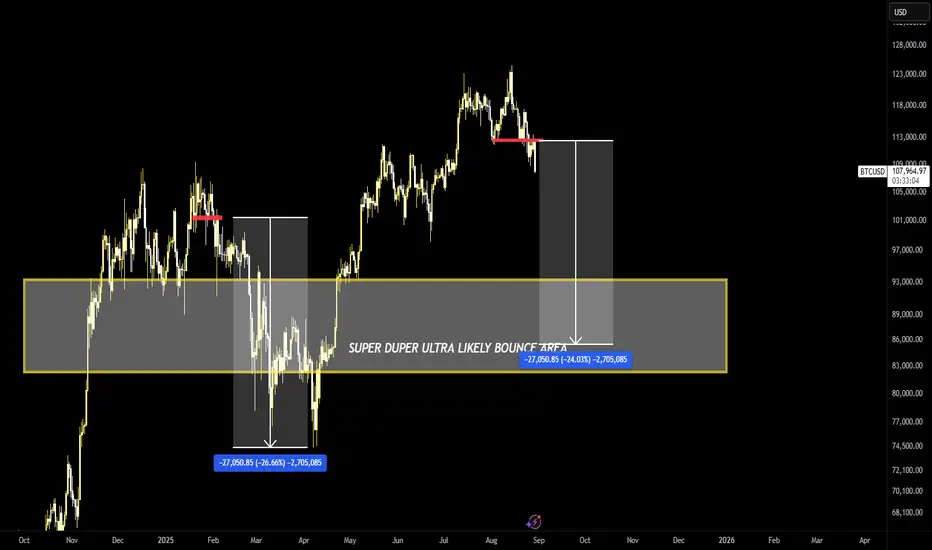
Bitcoin outlookBitcoin has potentially reached its double top pull back of about 30%. Could see a bottom in late oct or nov. new trend toward new ath in jan 2026 is possible.
BTCMINI trade ideas

BITCOIN Will Grow! Buy!
Take a look at our analysis for BITCOIN.
Time Frame: 12h
Current Trend: Bullish
Sentiment: Oversold (based on 7-period RSI)
Forecast: Bullish
The market is approaching a key horizontal level 108,207.93.
Considering the today's price action, probabilities will be high to see a movement to 112,111.56.
P.S
We determine oversold/overbought condition with RSI indicator.
When it drops below 30 - the market is considered to be oversold.
When it bounces above 70 - the market is considered to be overbought.
Disclosure: I am part of Trade Nation's Influencer program and receive a monthly fee for using their TradingView charts in my analysis.
Like and subscribe and comment my ideas if you enjoy them!

BTCUSD POSITION.Chart Analysis
The BTC/USD chart on the 15-minute timeframe shows that the price has been trading in a range, with a key support level around $108,200 to $108,300. A significant resistance level is visible at the recent high around $109,400. The current price is hovering just above the support zone.
Potential Trade Plans
Scenario 1: Bullish (Price Bounces from Support)
Entry: Consider entering a long (buy) position if the price shows a strong bullish candle confirming the support level around $108,300.
Stop-Loss: Place a stop-loss order just below the support zone, for example, at $108,150, to protect against a downside breakout.
Take-Profit (Target): The first target could be the minor resistance around $108,800, with a more ambitious target at the recent high of $109,400.
Scenario 2: Bearish (Price Breaks Below Support)
Entry: Consider a short (sell) position if the price breaks decisively below the $108,200 support level with strong bearish momentum.
Stop-Loss: A stop-loss should be placed just above the broken support level, for example, at $108,400, to limit potential losses.
Take-Profit (Target): The target for this move would be the next lower support level, which appears to be around $107,300 to $107,400.

#Bitcoin Bearish Sunday Update: $BTC short taken from 116K,#Bitcoin Bearish Sunday Update:
CRYPTOCAP:BTC short taken from 116K, and now BTC is already trading near 108K. I’m still holding my short position.
First target is 100K, then looking for 95K → 90K.
🔸 Market View:
No matter if BTC pushes into 112K–115K, the structure remains bearish. The CPI data outlook is also bearish for markets, adding more pressure. September will be brutal. Everyone is talking about the CPI data being very bearish, but I believe this is just a sell-the-news event. Be careful — I already told you the market is ready to dump.
🔸 Outlook:
I continue to hold my short from 116K and will update as targets get hit. The bigger picture stays bearish until we see real capitulation in the lower zones.

Bitcoin / U.S. Dollar – 15m | Bulls Eyeing Equal Highs?
BTC has been in a clear downtrend, printing lower highs and lower lows. Price recently tapped into a rejection block and dropped sharply. Now it sits near strong demand, hinting at a possible rebound.
**Bullish Scenario:**
* Hold the rejection block as support
* Push above 109,200–110,000
* Target equal highs near 112,400 and test the OB
**Bearish Scenario:**
* Lose 108,000 structure
* Extend lower into deeper demand near 107,200–107,400
* Risk of continuation towards new lows
**Key Levels:**
* 107,600–107,200: Rejection Block (demand)
* 110,395: P1D Low
* 111,219: Resistance / Swing High
* 112,400: Order Block & Equal Highs
* 113,600: P1D High
💬 Market is testing strong lows — will demand hold for a sweep towards equal highs?

BTCUSD – Pyramiding Long into Strength
We are adding a second long position in Bitcoin around $111,000, after our initial entry near $100,000 earlier in June , continuing to pyramid into the prevailing uptrend.
The structure remains extremely constructive: each impulsive leg higher is being followed by a prolonged consolidation phase, showing strong absorption of supply and price acceptance at elevated levels. This type of price action typically reflects a healthy uptrend, where the market is sustaining higher value areas before the next expansion move.
As long as Bitcoin continues to hold our Daily & Weekly Demand Zone threshold levels of $105,000 , the momentum bias remains firmly bullish. The next measured target lies around $135,000, aligning with the upper extension zone of the current trend.
Risk management remains key, but the trend and consolidation behavior favor continuation to the upside.

Bitcoin – Fractals Inside FractalsHello, dear traders!
The market is fractal, and Bitcoin is now showing a clear example of this principle: every structure contains its own micro-structure.
• Mid-term trend: bearish, with a global double top forming.
• Current correction: short-term upward channel testing resistance.
• Local setup (H1): a possible double top at the channel’s high. If confirmed, it may trigger a fresh impulse down in line with the broader mid-term bearish trend.
The neckline around 110,897 is the trigger. A breakdown here will likely accelerate the move towards 105–106k support.
Any thoughts on this? Your opinion would be interesting.


BTC price analysis for SeptemberWith ICC we read what price is telling us and we act accordingly.
After the ranging sideways zone, price has given the bearish indication, went up to take the shorts above 122k then pushed back down.
The trend is still bearish, 1h,4h and Daily both MACD and RSI are still bearish.
The support from 105k to 106k has held price before so it could be where BTC reverses and strong buys will step in OR it fails to hold and we head further down. We don't try to predict.

2025 SEASON AND BEYOND: BTC- Bitcoin BENTO BOX ANALYSIS
BTC
- BITCOIN
On a Weekly Chart
LONG POSITION -MOMENTUM STRATEGY - SWING
08.29.25
1238H +8 SINGAPORE
ALERT:
Forecast Entries for a BULL SWING. Long-Term Entries Only
Short to Mid forecast by end year or early next year: We are looking at a retracement within the 90k-100k level, in which our beyond parabolic target is at 140-155k, before we come to a reversal of trend.
Disclaimer:
The findings of the following analysis are the sole opinions of the publisher of this idea and should not be taken as a piece of investment advice. This analysis is a tool, and not a guarantee for price movement. Always conduct your own research (DYOR) and consider market conditions, news, and fundamentals.
Risks in Crypto: Crypto markets are highly volatile. Use proper risk management, such as position sizing and stop-losses, to protect your capital.
My Published Ideas are not 100% Accurate. Many given factors at a given time can change the forecast.
Understanding Bento Box Analysis
1. Major and Minor Boxes:
Boxes represent price ranges where significant support (bottoms) or resistance (tops) levels exist.
The tops and bottoms of these boxes act as critical turning points where the price may reverse (e.g., from bullish to bearish or vice versa) or break through to continue in the same direction.
Major boxes likely represent broader, more significant price ranges with stronger support/resistance levels, while minor boxes indicate smaller, shorter-term ranges within the major ones.
2. Turning Points:
When the price hits the top of a box, it may face resistance, potentially leading to a price drop (bearish reversal) or a breakout to higher prices if bullish momentum is strong.
When the price reaches the bottom of a box, it may find support, leading to a price bounce (bullish reversal) or a breakdown to lower prices if bearish pressure dominates.
When the price breaks out from top of a box to a newer bottom of a box, this means we can see price to move to the next minor box then a major box (vice versa).
3. Shaded Zones:
These are specific price areas within or around the boxes where traders might consider:
Entering a position (buying when the price is near support or breaking out above resistance).
Exiting a position (selling when the price approaches resistance or breaks below support).
Topping up (adding to an existing position, typically near support zones or during a confirmed breakout).
Application to Cryptocurrencies:
Given the high volatility of cryptocurrencies, Bento Box Analysis can help traders identify key levels for decision-making.
It relies on chart analysis techniques, such as identifying support/resistance zones, trendlines, or price patterns, often visualized on platforms like TradingView or other charting tools.
How to Use Bento Box Analysis
To apply this method effectively, you’ll need:
Charting Tools: Use platforms like TradingView, Binance, or Coinbase Pro to draw boxes around key price levels.
Identify Support/Resistance:
Major boxes: Look for historical price levels where the market repeatedly reverses or consolidates (e.g., weekly/monthly highs and lows).
Minor boxes: Focus on shorter-term levels within the major boxes (e.g., daily/4-hour chart levels).
Shaded Zones:
Mark areas near the edges of boxes (e.g., just above support or below resistance) where price action is likely to trigger entries, exits, or top-ups.
Use indicators like volume, RSI, or moving averages to confirm signals in these zones.
Breakout/Breakdown Confirmation:
A breakout above a box’s top or breakdown below its bottom should be confirmed with strong volume or candlestick patterns (e.g., engulfing candles).
Risk Management:
Set stop-loss orders below support (for long positions) or above resistance (for short positions) to manage risk.
Avoid over-leveraging, especially in volatile crypto markets.
Example Scenario
Suppose you’re analyzing Bitcoin (BTC) on a daily chart:
Major Box: A range between $55,000 (bottom) and $65,000 (top), based on historical price action.
Minor Box: A smaller range within, say $58,000 (bottom) to $62,000 (top).
Shaded Zone:
Entry: Buy near $55,000–$56,000 (major support) or $58,000–$59,000 (minor support) if the price shows a bounce with high volume.
Exit: Sell near $62,000–$63,000 (minor resistance) or $65,000 (major resistance) if bearish signals appear.
Top-up: Add to your position if the price breaks above $65,000 with strong momentum, confirming a bullish trend.
Turning Point: If the price fails to break $65,000 and drops, it may reverse toward $55,000. If it breaks below $55,000, it could signal a bearish trend.
important Notes
Basic Knowledge Required: As your disclaimer notes, understanding cryptocurrencies, blockchain technology, and chart analysis is crucial. Beginners should study candlestick patterns, volume analysis, and market trends before using this method.
NOTE:
1. That PRICE TARGETS for ENTRY and EXITS are DYNAMIC and can CHANGE from time to time.
2. Created using data on a MONTHLY, WEEKLY & DAILY Analysis of a MARKET'S CHARACTER.
3. My BENTO BOXES are designed for SWING TRADES at the LOWEST or START of a SWING CYCLE.
4. At times I will include a WAY BEYOND PARABOLIC PRICE TARGET, depending on The Character of the Market (CRYPTOS ONLY).
5. DYOR for your Fundamentals, Volume, Chart Patterns, Candlestick Math, FIB COILS ( ABC ), Price Action, FIB LEVELS, Market Dynamics, AB=CD Pattern especially institutional and retailer trading psychology.
Hoping that this BENTO BOX CHART ANALYSIS will efficiently help you with your DYOR as we Enter a NEW SWING CYCLE for LONG positions, either short, mid, or long term.
Wishing you all The Best Trades and Thank you for your Appreciation and Support of My Work.
Many thanks to My 3 Mentors. They are so much of a Blessing that I also wish to share my knowledge.
Vive Le Autist!
Dec 11, 2022
Note
On a DAILY Chart: Now on our 1st and 2nd Long-Term Entry

TheKing Ways Up- Some Traders are still waiting for lower prices.
- But to go lower BTC must first go higher.
- TheKing is in transition phase : " Bearish to Bullish ".
- Some retracements have to happen on the way up.
- Some Fuds have to happen on the way up to create those retracements.
- Today CPI results could impact a bit the trend ( Stocks + Cryptos ).
- Notice on the Graph MA50/MA20 (4D) will cross up soon
- Those MAs will create some new support zones.
- This Graph is just based on comparison between 2018-2020 // 2020-2022 and an eventual " Story Repeat ".
- Covid19 Black Swan included.
- Just follow the Circles and keep it simple.
Happy Tr4Ding !

BTCUSD: Long Signal with Entry/SL/TP
BTCUSD
- Classic bullish pattern
- Our team expects retracement
SUGGESTED TRADE:
Swing Trade
Buy BTCUSD
Entry - 10823
Stop - 10743
Take - 10983
Our Risk - 1%
Start protection of your profits from lower levels
Disclosure: I am part of Trade Nation's Influencer program and receive a monthly fee for using their TradingView charts in my analysis.
❤️ Please, support our work with like & comment! ❤️

Bitcoin - Inflows Whisper Calm, Structure Awaits Discipline.⊣
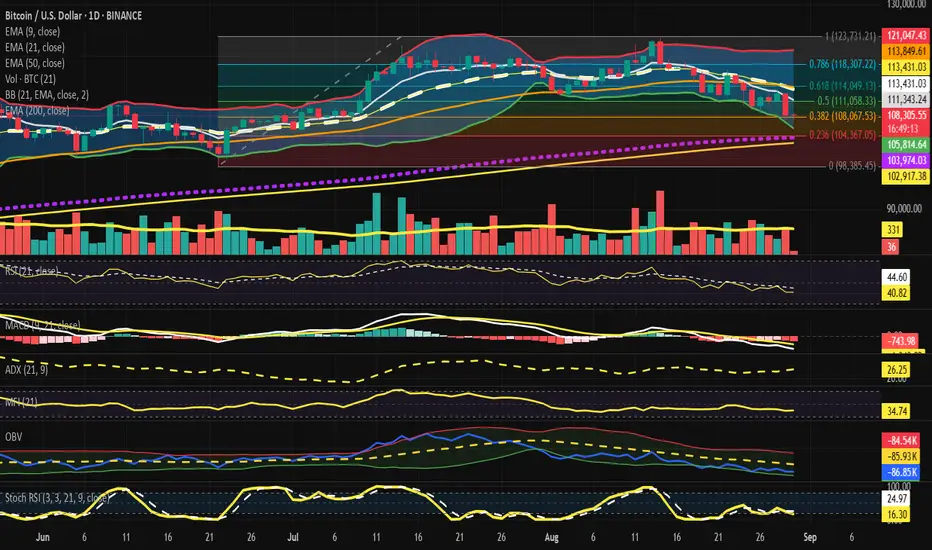
⟁ BTC/USD – BINANCE – (CHART: 1D) – (Aug 30, 2025).
◇ Analysis Price: $108,377.41.
⊣
⨀ I. Temporal Axis – Strategic Interval – (1D):
▦ EMA9 – $111,357.61:
∴ Price remains below EMA9, confirming immediate bearish control;
∴ EMA9 has flipped into dynamic resistance after multiple failed retests;
∴ Short-term recovery requires a clean daily close above EMA9.
✴️ Conclusion: EMA9 acts as near-term resistance, bearish short bias intact. Logic sealed.
⊢
▦ EMA21 – $113,437.56:
∴ EMA21 aligns with Fib 0.618 ($114,049), forming a resistance cluster;
∴ Persistent rejection since Aug 21 emphasizes mid-term weakness;
∴ Reclaiming EMA21 is the first real bullish trigger.
✴️ Conclusion: EMA21 = critical pivot to shift from bearish to neutral. Logic sealed.
⊢
▦ EMA50 – $113,852.43:
∴ Slightly above EMA21, adding weight to the $113.4 / 113.9k resistance zone;
∴ Until broken, this confluence acts as a bearish supply wall;
∴ A reclaim here reopens upside toward Fib 0.786 ($118.3k).
✴️ Conclusion: EMA50 reinforces resistance cluster. Logic sealed.
⊢
▦ EMA200 – $102,917.45:
∴ Long-term fortress, still untested in this cycle;
∴ Confluence with Fib 0.236 ($104,367) = macro defense zone;
∴ Bears’ ultimate target if current supports give way.
✴️ Conclusion: EMA200 stands as macro citadel. Logic sealed.
⊢
▦ Bollinger Bands (21, 2) – $121,042 / $113,437 / $105,833:
∴ Price riding lower band at $105.8k;
∴ Bands widening = volatility expansion with bearish tilt;
∴ Failure to revert to midline confirms continuation risk.
✴️ Conclusion: Bands highlight bearish volatility regime. Logic sealed.
⊢
▦ RSI (21, 9) – 40.90 / 44.62:
∴ RSI below neutral 50, momentum bearish;
∴ Not oversold (<30), leaving room for more downside;
∴ No bullish divergence present.
✴️ Conclusion: RSI validates sellers’ momentum. Logic sealed.
⊢
▦ MACD (9, 21, 9) – Line: –2,079.96 / Signal: –1,342.25 / Histogram: –737.71:
∴ Bearish cross intact below zero-line;
∴ Histogram remains deeply negative, no sign of contraction;
∴ Momentum acceleration still favors bears;
✴️ Conclusion: MACD entrenched in bearish phase. Logic sealed.
⊢
▦ ADX (21, 9) – 26.25:
∴ Above 25 confirms trend strength;
∴ With DI– dominance, direction is bearish;
∴ Indicates continuation rather than reversal.
✴️ Conclusion: ADX confirms strengthening bearish trend. Logic sealed.
⊢
▦ MFI (21) – 34.75:
∴ Below 50 = capital outflows dominate;
∴ No oversold signal (<20) yet;
∴ Market still has selling pressure capacity.
✴️ Conclusion: MFI aligns with distribution bias. Logic sealed.
⊢
▦ OBV (21, BB2) – (–86.84K):
∴ OBV trending lower, confirming distribution;
∴ Volume does not show accumulation footprint;
∴ Confirms sellers dominate liquidity.
✴️ Conclusion: OBV validates distribution regime. Logic sealed.
⊢
▦ Stoch RSI (3, 3, 21, 9) – K: 16.30 / D: 24.97:
∴ In oversold territory (<20);
∴ No confirmed bullish crossover yet;
∴ Relief bounce possible if crossover occurs.
✴️ Conclusion: Oversold condition may allow relief, but not structural reversal. Logic sealed.
⊢
▦ Fibonacci Retracements (0 = $98,385 -> 1 = $123,731):
0.786 -> $118,307 – (upper resistance);
0.618 -> $114,049 – (current battlefield, confluence EMA21/50);
0.500 -> $111,058 – (reclaim point for neutralization);
0.382 -> $108,067 – (current support pivot);
0.236 -> $104,367 – (deeper target, near EMA200).
✴️ Conclusion: Market clings to 0.382; Loss exposes 0.236 + EMA200 fortress; Logic sealed.
⊢
🜎 Strategic Insight - Technical Oracle:
∴ Short-term structure: price pinned under EMA9 and EMA21/50 cluster, bearish dominance confirmed;
∴ Momentum: RSI below 50, MACD negative, ADX >25 = sellers in control;
∴ Capital flows: MFI <50, OBV falling = distribution not yet exhausted;
∴ Only counterpoint: Stoch RSI oversold; potential for technical bounce, not structural reversal.
✴️ Conclusion: The battlefield is 0.382 Fib ($108k). Bulls must reclaim $111k -> $113.4k to neutralize; failure drags price toward ($104 / 103k). Logic sealed.
⊢
∫ II. On-Chain Intelligence - (Source: CryptoQuant):
▦ Exchange Inflow Total + EMA9 - (All Exchanges):
∴ Current inflow readings remain low-to-moderate, no spikes comparable to 2022 capitulation phases (>200K BTC);
∴ EMA9 of inflows trending stable/declining since Q2 2025;
∴ Lack of exchange deposits suggests no broad panic selling.
✴️ Conclusion: Inflows do not confirm capitulation; sellers are present but not aggressive. Logic sealed.
⊢
▦ Historical Context:
∴ Spikes above ~150K BTC inflow (e.g. 2022–2023) correlated with sharp price drawdowns;
∴ 2024–2025 shows inflows mostly <50K BTC/day, even during corrections;
∴ Current cycle corrections appear orderly rather than panic-driven.
✴️ Conclusion: Current inflow regime supports controlled distribution, not mass liquidation. Logic sealed.
⊢
▦ Liquidity Implications:
∴ Absence of exchange inflow surges implies supply pressure limited to tactical sellers;
∴ On-chain wallets continue holding, whales not rushing coins into exchanges;
∴ Technical breakdowns (EMA clusters, Fib 0.382) would require derivative/liquidation cascades rather than spot-led panic.
✴️ Conclusion: Structural downside must be driven by futures leverage, not spot panic flows. Logic sealed.
⊢
𓂀 Stoic-Structural Interpretation and On-Chain Oracle:
∴ Structure: EMA stack inverted; Fib 0.382 ($108k) = present bastion; EMA200 ($103k) = macro citadel;
∴ Momentum: RSI, MACD, ADX in alignment with descent, affirming stoic acceptance of downward will;
∴ Capital Flow: OBV and MFI declare liquidity leaving, distribution sealing bearish fate;
∴ Oracle: Oversold Stoch RSI whispers of fleeting respite, not salvation;
∴ Structure of Flow: Unlike past cycles, inflow discipline holds; coins remain largely in cold storage;
∴ Momentum of Will: Market decline is technical, not yet forced by whales. Bears act by structure, not by panic;
∴ Fate of Distribution: Without inflow surges, spot-driven capitulation remains unlikely; path to $103K relies on derivative liquidation.
⊢
✦ Structure Thus:
∴ The market embodies stoic compression;
∴ Only a reclaim >$113.4k reopens neutrality;
∴ Loss of $108k pulls destiny to ($104 / 103k);
∴ Fate sealed in bearish compression, awaiting expansion - logic sealed;
∴ On-chain inflows confirm the absence of mass panic;
∴ Technical charts dominate destiny;
∴ Bears have structure, but not yet blood;
∴ Bulls retain a chance if they defend $108K with low inflows sustained.
⊢
⚚ Unified Insight (Technical + On-Chain):
∴ Technical: Bitcoin clings to Fib 0.382 ($108K); failure = ($104 / 103K). Momentum + OBV favor bears.
∴ On-Chain: No whale capitulation; inflows remain muted, meaning downside is not spot-led.
✴️ Consequence: If inflows stay low, bulls may engineer a bounce at $108K -> $111K. If derivatives trigger cascade, EMA200 ($103K) becomes the stoic fortress.
⊢
· Cryptorvm Dominvs · MAGISTER ARCANVM · Vox Primordialis ·
· Dominivm Cardo Gyratio Omnivm · Silence precedes the next force. Structure is sacred ·
⊢
BTC/USD Consolidates at Support, Bulls Target UpsideBTC/USD is consolidating after a sharp drop and has just formed a change of character (CHOCH) along with a reaction from the fair value gap zone. If buyers continue to step in from this support, the price could push higher toward the liquidity zone and previous daily high (PDH) at 112,655. Failing to hold the fair value gap could lead to another retest of the previous daily low (PDL) at 107,394. Watch for bullish confirmation above the fair value gap to signal further upside potential.
This analysis is for educational purposes only and does not constitute financial advice. Trading involves risk—please do your own research or consult a financial advisor before acting.

Bitcoin showing cracks yet again - 85k likely next- complimentary analysis to the USDT D. one
- clear S/R flips are sign of trend (in this case bear) strength
- with several HTF bearish divergences confirmed and with a CME gap at around the 90k area it seems that is the destination Bitcoin is ultimately headed to in the next few weeks
- overall Bitcoin bull cycle unlikely to be over
So bitcoin broke throught supportWe got a long way up source atm is "TRUST ME BRO"
Not financial advise

Bitcoin on the Edge of Decline: Bearish Momentum PrevailsMarket Overview:
BTC/USD continues to trade within the descending channel, holding below the key $111,950 zone. Selling pressure remains dominant, bringing the market closer to testing the $106,900–105,000 support area.
Technical Signals:
EMA (144) remains above the price, confirming bearish dominance.
Wave structure indicates the development of the 5th bearish wave.
Price movement follows a clear downward channel.
Key Levels:
Support: $106,900 – 105,000
Resistance: $111,950 – 114,300
Scenario:
Main (bearish): decline towards $106,900–105,000.
Alternative (bullish): breakout above $111,950 could lead to $114,300.

Bitcoin Buy setupHi everyone.
I think these two areas have a good potential to take at least 1:1RR profit.
I've set orders in these areas.
Lets see what happens.
Dear traders, please support my ideas with your likes and comments to motivate me to publish more signals and analysis for you.
Best Regards
Navid Nazarian

BTC/USDBTC is still inside the descending channel (red).
A corrective bounce could target 112,000 – 114,000 (Fib + channel resistance).
If price fails to break above 113,250–114,000, the downtrend can resume with new lows.
Strong support remains near 108,000 – 106,500.

BTC September chopSep tends to be chop chop chop - or red red red ;-) plan to get bias going into Sep

BTC BUY UPDATE, Below $110k is a good buy (Long)BTC LONG UPDATE
Below $110k is a good buy (Long)
Increasing Demand Zone $108-110k
Possible upside like this ,Repeating Pattern
From $109,300 towards $114,500 or Above
Breaking of $114,500-115k ,will send it more up
Targeting $114,500 or Above
Not a Financial advice

BTC BUY SETUP, Bought from $113kBUY SETUP
Long Entry from $113k
Targeting $115,300 or Above
Trading plan : IF BTC go down to $112k
will add more longs
Resistance at $116-117K
Demand Zone $110-111k
Not a Financial advice

BITCOIN Bearish Breakout!
HI,Traders !
#BITCOIN made an epic
Bearish breakout of a very
Strong key horizontal level
Of 112340.5which is now a
Resistance and the breakout
Is confirmed so we are
Bearish biased and we will
Be expecting a further
Bearish move down !
Comment and subscribe to help us grow !
