BTCUSD LongThe BTC price is projected to surge beyond 106.5k, driven by the validation of the Crab harmonic pattern. This pattern serves as a strong indicator of bullish momentum, suggesting a promising upward trajectory for Bitcoin in the near term.
BTCMINI trade ideas

Short Bitcoin on its reboundThe Bitcoin market movement has fully confirmed yesterday's prediction — as previously analyzed, after touching the key resistance level on the 4-hour chart, the price failed to achieve a meaningful breakout and subsequently initiated a corrective decline. The entire process closely aligned with the anticipated rhythm, further validating the effectiveness of the technical resistance analysis.
From the perspective of the short-term hourly chart structure, the current market displays clear bearish characteristics: the three bands of the Bollinger Bands are diverging downward simultaneously, with the band opening slightly wider than before, indicating that short-term bearish momentum has taken dominance. The price is highly likely to continue its adjustment along the direction of the lower Bollinger Band. Although there have been occasional minor rebounds during the decline, they consistently lack substantial buying support. The rebound strength is weak, accompanied by continuously shrinking trading volume, further illustrating insufficient bullish confidence and an unchanged bearish control pattern.
Until the structure reverses, the primary strategy should be selling on rebounds, following the prevailing trend.

Bitcoin And 112K ResistanceBitcoin continues to grind around a critical level – the $112,000 zone. This area acted as support throughout July and early August, but yesterday’s daily close confirmed it has now flipped into resistance. Today’s candle attempted to push back above it, but price was swiftly rejected – underscoring its importance.
On the downside, the shaded region between roughly $108,000 and $109,000 remains the key demand zone. Buyers have stepped in there multiple times this month, keeping Bitcoin from breaking lower. A clean daily close below this range would likely open the door to a deeper move toward $101,000 – the next major support level.
As it stands, Bitcoin is caught between $112,000 resistance and $108,000 support. A decisive break either way should dictate the next trend. Bulls need a strong close back above $112,000 to regain momentum, while bears are eyeing a breakdown into the low $100Ks.
Until then, expect continued chop around this level – with $112,000 remaining the line in the sand for both sides.

$BTC: Bitcoin – Digital Gold Rush or Crypto Rollercoaster?(1/9)
Good morning, folks! ☀️ CRYPTOCAP:BTC : Bitcoin – Digital Gold Rush or Crypto Rollercoaster?
With CRYPTOCAP:BTC at $82,352.34, is this the motherlode of digital wealth or a wild ride with no brakes? Let’s dig into the blockchain buzz! 🔍
(2/9) – PRICE PERFORMANCE 📊
• Current Price: $ 82,352.34 as of Mar 10, 2025 💰
• Recent Moves: Up 30%+ YTD, per web trends 📏
• Sector Trend: Crypto volatility reigns, X posts show mixed vibes 🌟
It’s a high-stakes game with big swings! ⚡
(3/9) – MARKET POSITION 📈
• Market Cap: $1.63T (based on 19.83M circulating supply) 🏆
• Status: King of crypto, 50%+ market dominance ⏰
• Trend: Whales scooping coins, per X chatter 🎯
Reigning supreme in the digital realm! 🌍
(4/9) – KEY DEVELOPMENTS 🔑
• Sentiment: X posts cheer GETTEX:82K support, ETF flows mixed 🔄
• Adoption: El Salvador adds BTC, strategic reserve talk grows 🌐
• Market Reaction: Price steady despite tariff fears 📋
Riding waves of hype and hope! 💡
(5/9) – RISKS IN FOCUS ⚠️
• Volatility: 5-10% daily swings not uncommon 🔍
• Regulation: Global crackdowns loom 📉
• Macro: Economic shifts could jolt crypto ❄️
High risk, high reward territory! 🕵️
(6/9) – SWOT: STRENGTHS 💪
• Dominance: 50%+ of crypto market 🥇
• Adoption: Nations, whales piling in 📊
• Scarcity: 19.83M of 21M coins mined 🔧
A heavyweight with staying power! 🔒
(7/9) – SWOT: WEAKNESSES & OPPORTUNITIES ⚖️
• Weaknesses: Wild price swings, regulatory haze 📉
• Opportunities: Institutional cash, global unrest boost 📈
Can it strike gold or stumble? 🤔
(8/9) – 📢 Bitcoin at $82,352.34—your bet? 🗳️
• Bullish: $100K+ by Q2, unstoppable 🐂
• Neutral: Sideways, risks weigh ⚖️
• Bearish: $70K crash, bubble bursts 🐻
Drop your vote below! 👇
(9/9) – FINAL TAKEAWAY 🎯
Bitcoin’s $82,352.34 marks a wild frontier 📈, with dominance shining through volatility 🌫️. Dips? That’s our DCA sweet spot 💰. Scoop low, ride high! Boom or bust?

Bitcoin (BTC/USDT) – 4H Chart Update !!Bitcoin (BTC/USDT) – 4H Chart Update
BTC is trading near $110,000 and respecting a descending trendline. The price is currently consolidating near support with RSI around 40, showing slight weakness.
Immediate Support → $109,456
Long-term Support → $98,376
Immediate Resistance → $112,935
Long-term Resistance → $122,879
Possible Scenarios:
Bullish Case (Long Setup):
A breakout above $112,935 could open doors to $116,818 → $120,001 → $122,879.
Long entry valid above breakout confirmation, SL below $109,456.
Bearish Case (Short Setup):
Failure to hold $109,456 could drag price down to $105,189 → $102,154 → $98,376.
Short entry valid below $109,456, SL above $112,935.
The market is at a critical decision zone – waiting for a breakout/rejection will give clearer direction.
DYOR | Not Financial Advice

BTCUSD -SUPPORT ZONE 110000 READ CAPTIONhi trade's.
BTC is currently approaching a major support area at 110000.
If buyers defend this zone, price may attempt a recovery toward the 117000 target zone.
A secondary support is seen near 10500 that could provide another reaction level.
A breakdown below 104000 risk level would invalidate the bullish view and open room for deeper downside.
Support Zone: 110000
Second Support: 10500
Risk Level: 104000
Target Zone: 117000
👉 I share daily chart updates and setups on my TradingView

BTC/USD UpdateNext move on the way focus on proper risk management & stay disciplined. Wishing you successful trades.
Key Reason:
1. 2H fresh OB + FVG still in pending.
2: Price break the consolidation towards downside.
3. Bearish pressure also strong.
4. possible downside move expected.
This is not financial advice take it with your own risk. Once price tap our zone switch into lower time frame for confirmation. Let's see how it will work.

BITCOIN Will Go Up From Support! Buy!
Here is our detailed technical review for BITCOIN.
Time Frame: 1D
Current Trend: Bullish
Sentiment: Oversold (based on 7-period RSI)
Forecast: Bullish
The market is testing a major horizontal structure 111,202.85.
Taking into consideration the structure & trend analysis, I believe that the market will reach 120,765.14 level soon.
P.S
The term oversold refers to a condition where an asset has traded lower in price and has the potential for a price bounce.
Overbought refers to market scenarios where the instrument is traded considerably higher than its fair value. Overvaluation is caused by market sentiments when there is positive news.
Disclosure: I am part of Trade Nation's Influencer program and receive a monthly fee for using their TradingView charts in my analysis.
Like and subscribe and comment my ideas if you enjoy them!

110K KEY SUPPORTWELCOME TO MY FIRST PUBLISHED IDEA. COMMENTS WOULD BE APPRECIATED.
Bitcoin is trading at a critical juncture, hovering just above the $110K support zone, which has acted as a key pivot throughout August. From a technical perspective, this region represents the dividing line between a potential rebound and an extended correction. Traders can look for two primary swing trade setups here. On the bullish side, a bounce from the $110K–$110.8K range, confirmed with volume and candlestick strength, could open the door toward $113.5K–$114K in the short term, with a larger upside target into the $123K–$124.5K resistance cluster.
Conversely, a confirmed breakdown below $110K on the daily chart would validate a bearish continuation setup, with downside targets at $105K and, if momentum accelerates, the psychological $100K level.
From a macro standpoint, several triggers could dictate which direction plays out. Upcoming U.S. GDP and inflation data (PCE) will be closely watched, as softer numbers could weaken the dollar and fuel a crypto rebound, while stronger-than-expected figures may pressure Bitcoin further. In addition, ETF flows and institutional positioning remain important—sustained outflows may reinforce selling pressure, while inflows could support a recovery rally. Broader equity market sentiment and risk appetite will also play into Bitcoin’s path in the coming sessions.
Risk management remains paramount in this environment. With volatility elevated and ATR readings high, traders should size positions conservatively and avoid over-leverage. Setting clear stop-losses—such as below $109K for long setups or above $111.5K for shorts—can protect against false breaks. Equally, using staggered take-profit levels allows traders to lock in gains while leaving room for extended moves. At such pivotal price zones, discipline and patience often determine whether setups result in controlled profits or unnecessary drawdowns.

Global M2 and BTC - Nov 2023 and onwardCheck out the correlation between BTC's price and Global M2, starting when the ETF's were announced. Uncanny. Notice the divergence happening now - will we enter a bear market, or will BTC pump soon?

BTC is toda moon1. As you can see from the trendline in the chart, this resistance level is likely to mark the top for Bitcoin — what we call the "big top" — and it’s probably going to happen sometime before 2029.
2. If you look back at Bitcoin’s history, it’s pretty wild how retail expectations tend to peak right before major downturns. Back in the 2013 bull run, people were thinking 10,000 RMB per coin — then the crash came. In the 2017 bull market, the expectation was 10,000perBTC∗∗,whichwehit,thenitralliedto∗∗20,000 before crashing again. Now, in the 2025 cycle, we’re seeing expectations hit around 1 million RMB per BTC. And sure, you can dream about $1 million per BTC in the next bull run — that’s the kind of FOMO talk that tends to float around. But here’s the thing: once that 1 million RMB psychological level is in play, and if there hasn’t been a proper correction or consolidation, you shouldn’t be calling for more upside just yet.
3. Right now, the price is bumping up against strong overhead resistance — that “distribution wall” where sellers start coming in hard. But don’t expect an immediate reversal. Why? Because the bulls still have some juice left — they haven’t fully expended their energy yet. Ultimately though, this push is likely to fizzle out — it’s the classic "last gasp" move before the trend changes.
4. Now, if you're thinking about shorting here — yeah, there’s some potential for profit, but don’t expect a home run. The upside is capped, and the gains will probably be pretty small. Why? Because there’s still a lot of bullish momentum lingering in the market. Instead of a clean drop, what you’re more likely to see is a long, drawn-out topping process — lots of sideways action, chop, and volatility near the highs. So while shorts aren't a bad idea, they’re not a slam dunk either.

Trading Strategy in BTCUSD Price Range✏️ CRYPTO:BTCUSD trading range is being watched around 109000 and 117000. The corrective wave is heading towards the important Break zone to find some buying momentum. The trading strategy will be to wait to buy and wait to sell when there are confirmation signs from one side at the range. There are not many real-time signals for BTC and the wave structure is also relatively difficult to trade at the moment. Therefore, waiting to trade at this range is the optimal choice.
📉 Key Levels
BUY 109000 Strong support zone
SELL 117000 Strong resistance zone
Leave your comments on the idea. I am happy to read your views.

BTCUSD is set to cross 125,000$112000 is a key level of support that tested the previous resistance turned support and price bounced off this level $124500 and rejected with head and shoulder formation to support. We can spot a over extension below the key support level $112400.
With strong liquidity trigger from the support level BTCUSD potentially bouncing off the level and may continue to rise upto $125000 and beyond as the continuation of long term uptrend.

Yes, here is another Bitcoin "DOOM" dome !!!Yes, here is another Bitcoin "DOOM" dome !!!
This time priced in gold, on the weekly time frame.
I added a plethora of annotations...
Just so the trolls can't come back later and say that the analysis was wrong.
Take your time to read properly.

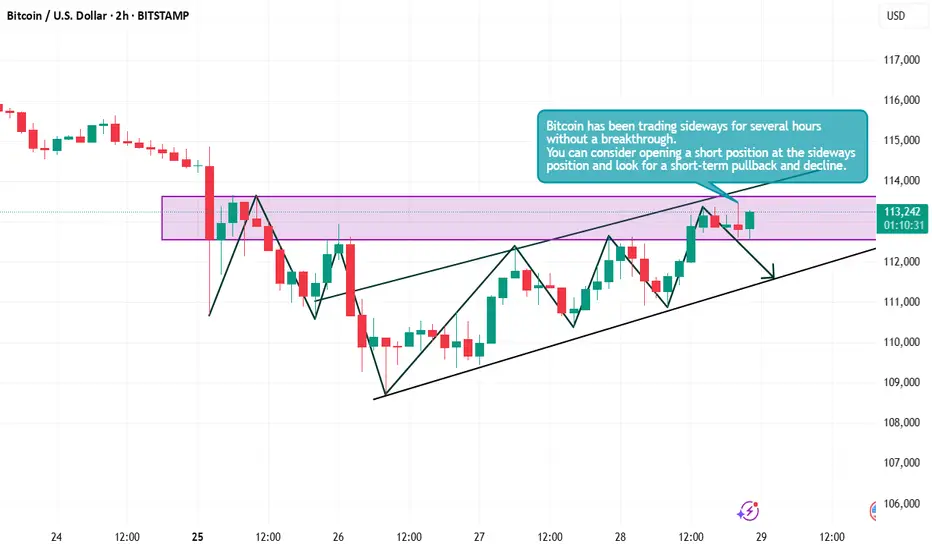
Bitcoin Strategy: Open a short position at this positionBitcoin has been trading sideways for several hours without a breakout. This sideways trend will drain bullish momentum, which is why a prolonged period of sideways trading is bound to lead to a decline. Consider opening a short position at this point, anticipating a short-term correction.
Strategy
Open a bearish short position near 113,500, targeting around 112,000. Hold the short position if the price falls below this level.
BTCUSD 4H AnalysisPrice has broken below the mid-range support and is currently trading in a bearish structure. Using Fibonacci extension levels, I’ve mapped out three potential downside targets:
🎯 Target 1 – 38.2% (≈ 107,135) – First reaction zone where price may attempt a short-term bounce.
🎯 Target 2 – 61.8% (≈ 106,026) – Key Fibonacci confluence, often acting as strong support.
🎯 Target 3 – 100% (≈ 104,231) – Full measured move projection, aligning with deeper bearish continuation.
As long as price stays below the breakdown zone (≈ 111,800), the bearish bias remains valid. A move back above this level would invalidate the setup.

Bitcoin / USD – 15M | Liquidity Zones Lined Up News Effect
BTC is trading around 112,900 with price compressing between recent swing highs and lows. Market is showing equal highs above and liquidity pockets below — preparing for expansion.
Bullish Scenario:
* Hold above 112,900 → sweep equal highs at 113,200–113,400.
* Breakout could extend towards swing high at 114,800.
Bearish Scenario:
* Rejection from equal highs → break below 112,600 (P1D High).
* Deeper move targets liquidity at 111,600 OB and equal lows near 111,400.
Key Levels:
* Resistance: 113,200 / 113,400 / 114,800
* Support: 112,600 / 111,600 / 111,400
💬 Will BTC clear equal highs first, or dip into liquidity below?

Bitcoin Testing 112KBitcoin closed yesterday back under the key $112K level – confirming it as resistance. But midway through today’s session, BTC is trading near $113K – a sharp intraday recovery that puts the reclaim scenario back on the table.
This makes $112K the clear pivot to watch. If today’s candle can close above it, that would mark a proper reclaim and strengthen the case for another push toward the range high near $123K. Failure to hold above $112K, however, would keep price stuck in chop – and put the $108K–$110K demand zone back in play.
The bigger picture hasn’t changed – $112K is the battleground. Bulls need a daily close above it to confirm momentum, while bears will want to see this level act as a ceiling again. Until then, expect volatility around this line in the sand.

Bitcoin Holds Above $113K but Faces Persistent Selling PressureBitcoin Holds Above $113K but Faces Persistent Selling Pressure
Bitcoin remains range-bound despite a positive start to the day, trading near $113,011, up 1.8% in the past 24 hours. Earlier this month, the leading cryptocurrency reached a record high above $124,000 on optimism about interest-rate cuts. Since then, it has pulled back but is attempting to rebound from recent lows around $110,000, as President Donald Trump increases pressure on the Federal Reserve to lower rates.
Lower interest rates typically boost demand for risk assets like cryptocurrencies and weaken the U.S. dollar, both factors supporting Bitcoin’s valuation.
Hyblock’s liquidation heatmap shows BTC absorbing bids in the $111,000–$110,000 range during the weekend sell-off, with another liquidity cluster near $104,000.
While a deeper drop toward $104K looks unlikely for now, institutional selling continues to outweigh retail demand, limiting upside potential. Traders seeking a consolidation phase should watch the anchored aggregated daily CVD for signs of easing sell pressure and shifting sentiment.

Bitcoin short-term analysis and strategyI've been bullish on Bitcoin recently, and have opened multiple long positions below 110,000. My expectation is that the 110,000 mark will be recaptured. This approach is clearly sound, and the market has already stabilized above this level, suggesting further upside potential.
From the 4-hour and 1-hour charts, the market is still in a rebound channel trend, and this rally is not over. Key resistance levels to watch are currently around 113,500.
Bitcoin Strategy
If the price retraces to around 112,200-112,500, consider opening a long position, with targets at 113,000/113,500.

Powell's Speech Sparks Turmoil: BTC Surges and Pulls BackPowell's speech triggered a sharp surge in both BTC and gold 🚀. Amid such significant volatility, many traders will likely see their accounts wiped out 💥. BTC has pulled back today and may continue to drop to around 112,000 before rebounding ↘️↗️
⚡️⚡️⚡️ BTCUSD ⚡️⚡️⚡️
🚀 Sell@ 117000 - 11600
🚀 TP 115000 - 114000 - 113000
Daily updates bring you precise trading signals 📊 When you hit a snag in trading, these signals stand as your trustworthy compass 🧭 Don’t hesitate to take a look—sincerely hoping they’ll be a huge help to you 🌟 👇

Today's zones for bitcoin chart Bit coin has given false break out of liquidity sweep zone . It shows liquidity was taken above the level . Now we can see a good bearish moment in bitcoin.

Bitcoin to 125,000After 9 months of downtrend/sideways price action, bitcoin has finally broke out of this trend.
If we zoom out to weekly time frame, the 9 months of downtrend/sideways price action, serves as "handle" for "cup and handle" pattern which goes back to Nov 2021. Finally, after 3 years, this pattern is completed and bitcoin is set to get to it's next target which is ~125,000.
On it's way up, bitcoin will probably face some resistance at 100K, since people have been waiting for bitcoin to hit this price target from all the way back in 2019-2020. Moreover, 100K is Fibonacci famous 1.6 extension level, so we might see some sell off at this price. However, we believe that FOMO can break this resistance level with ease and bring up the price to 125,000 USD.
From this point, we probably see more sharp upward trend toward 155K and 200K but this is the danger zone where we might see sharp pullbacks to 100-125K range.
