Bitcoin Bearish Reversal SetupThe chart shows a potential bearish setup for Bitcoin (BTC/USD) on the 30-minute timeframe. Price recently reacted off a supply zone near the \$112,860 resistance level after forming an equal high (EQH) and change of character (CHOCH) to the downside. Currently, price is making a minor pullback toward the resistance zone, with a projected move downward targeting the demand zones highlighted in blue between \$111,200 and \$109,300. The presence of a weak low suggests vulnerability, and sellers may aim to sweep that liquidity. The outlook anticipates rejection from resistance and continuation toward lower support levels.
BITSTAMP:BTCUSD
BTCMINI trade ideas

BTCUSD is set to cross 125,000$112000 is a key level of support that tested the previous resistance turned support and price bounced off this level $124500 and rejected with head and shoulder formation to support. We can spot a over extension below the key support level $112400.
With strong liquidity trigger from the support level BTCUSD potentially bouncing off the level and may continue to rise upto $125000 and beyond as the continuation of long term uptrend.

Bitcoin Scenario Remains IntactBitcoin Scenario Remains Intact
Hello traders,
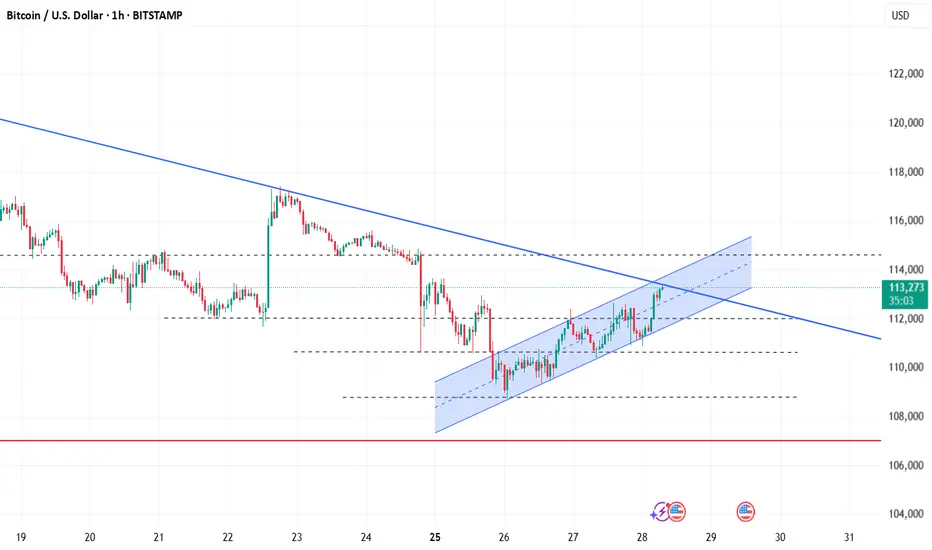
BTC spent the day moving sideways, which might feel frustrating for some. However, the price structure remains firmly within the channel, and in my view, this retest phase is necessary to strengthen the outlook.
The current reactions inside the channel are short-term in nature, but they highlight how BTC is closely following technical analysis behaviour at this stage. The plan is still to look for long entries around the Fibonacci retracement levels – especially the 0.618 and 0.5 zones.
With little fundamental news driving momentum right now, many traders remain undecided. This makes the technical levels even more important as reference points.
That’s my perspective on BTC for now. What’s yours? Share your outlook in the comments so we can discuss further.

BTC update $another dip before the rally
Entering Buy from zone 111200 - 110900 keeping target as 113500$
3rd wave completed
4th is the dip
Buy at 5th

BTC RoadmapBitcoin’s monthly chart shows the same repeating rhythm across cycles: massive rallies, steep drawdowns, and multi-year bases before new highs. But unlike past cycles where drawdowns reached 75–80%, the landscape has changed.
Institutional adoption, ETF inflows, and broader ownership have created a structural cushion. Instead of BTC revisiting deep cycle lows, the worst case now is a retest of the previous peak (~$69k) — the top of the 2021 cycle.
Cycle 1: +23,960%, then -78%
Cycle 2: +8,922%, then -78%
Cycle 3: +1,053%, then -75%
Cycle 4 (current): +300% off the lows so far, ETF-driven
The yellow trendline continues to serve as long-term support. ETF entries and institutional demand should prevent another full collapse like in earlier cycles.
Peak target: $147k Q4 2025
Bottom target: 65k - 74k Q4 2026/Q1 2027
Stop-loss zone (invalidated idea): close below 50W MA
Definitely not written by chatgpt.

BTCUSD – Bullish Setup from Strong Support + Order Block.Analysis: BTCUSD has already broken its first support and is now trading near the second strong support zone, which also aligns with an order block on my chart.
🔎 Analysis
Price has reached a strong demand zone with confluence of support + order block.
As long as this zone holds, I remain bullish on BTCUSD.
Buyers may push the price upward from current levels if confirmation appears.
📍 Trade Setup (Bullish Bias)
Buy Zone: Current strong support / order block
Confirmation: Wait for bullish price action (candlestick rejection, engulfing, etc.)
Targets: Higher resistance zones (will update as price action develops)
⚠️ Risk Management: This is my personal analysis only, not financial advice. Always use stop-loss,
💬 If you find this analysis helpful, please like, comment and share to support my work and follow for more BTCUSD updates.
Regards: Forex Insights Pro.

Is Bitcoin's move a rebound or a reversal?Recently, the overall judgment on the direction of Bitcoin's market has been relatively accurate. From the earlier rhythm of "first falling then rising, rebounding after oscillating correction" to the continuation of the trend after stabilizing above the key level of $112,000, each step of the movement has basically matched the previous expected judgment. In particular, the logic behind breaking through the $112,000 "bull-bear watershed" has been fully verified by the market - after the price successfully stabilized above this level, bullish momentum was quickly released, with an additional increase of nearly 1,500 points, further consolidating the short-term upward trend and turning the earlier directional judgment into actual profit space.
However, looking back at the operational details, there are still some flaws in seizing the entry points: although some long positions got the trend direction right, due to slightly early or late entry timing, they failed to accurately capture the lowest entry point after the pullback, resulting in the failure to maximize the profit space of a single wave.
Currently, the price has hit the 4-hour resistance level. Friends who entered long positions around $112,000 can take profits and exit first, and then follow up with long positions after a pullback.
BTCUSD at Key Resistance – Break or Reject?Analysis:
Bitcoin has pushed back to a major resistance zone after breaking the short-term downtrend line. Price is now testing supply, making this a decision point.
Bullish case: A clean breakout and retest above this zone could send BTC toward 113,500 – 114,000.
Bearish case: Failure to break may trigger another drop back toward 110,200 – 109,200 support.
I will be anticipating the bearish move.
💬 Do you think BTC breaks higher from here, or is another rejection coming? Give your thoughts.

BTC/USD (Bitcoin – 4h).BTC/USD (Bitcoin – 4h, Bitstamp). It’s showing a bearish structure after breaking trendline support and multiple ChoCH (Change of Character) signals.
Key Levels on my Chart:
Current Price: ~110,716
Broken Support Zone: ~112,725 – 113,394
Target Point 1: ~106,000
Target Point 2 (extended): ~98,000
Technical Outlook:
Price has broken below the upward trendline and is now retesting lower levels.
The rejection from ~113K adds strength to the bearish momentum.
The Ichimoku cloud is bearish, with price trading below it.
My chart suggests a downside continuation, with first target ~106K, and if momentum continues, the next downside target is ~98K.
👉 Targets:
Short-term target: 106,000
Extended target: 98,000

$BTCUSDT Breakout 124KCRYPTOCAP:BTC is testing the 113K resistance.
A clean breakout could send it toward 124.5K, nearly 10% higher.
The MACD is turning bullish, indicating growing momentum.
DYOR, NFA

BTCUSD Price Action: Establishes Uptrend, Facing First Hurdle
Trend Reversal: After a clear downtrend from the 23rd to the 26th, BTCUSD has successfully broken out of its bearish channel, indicating a shift in momentum.
Key Support Established: The price found strong support around the $110,500 level (the green horizontal zone), which acted as a critical floor and initiated the current upward movement.
Current Bullish Momentum: BTCUSD is currently trading within an ascending channel (the green diagonal channel), demonstrating short-term bullish momentum and higher lows.
Immediate Resistance Test: The asset is now testing its first significant resistance level at $113,500. A decisive break and hold above this zone would confirm further strength.
Next Price Targets: Should the $113,500 resistance be overcome, traders should watch for the next resistance levels at $114,500 and subsequently $115,500 as potential upside targets.
Disclaimer:
The information provided in this chart is for educational and informational purposes only and should not be considered as investment advice. Trading and investing involve substantial risk and are not suitable for every investor. You should carefully consider your financial situation and consult with a financial advisor before making any investment decisions. The creator of this chart does not guarantee any specific outcome or profit and is not responsible for any losses incurred as a result of using this information. Past performance is not indicative of future results. Use this information at your own risk. This chart has been created for my own improvement in Trading and Investment Analysis. Please do your own analysis before any investments.

Btc levels Btc levels are still holding tight 112798 just was hit after the volatility we getting some large green bars we can test 113722 soon 115484 is next resistance

$BTC bounce setup at EMA crossover with eyes on $116.5k BTCUSDT is currently bouncing back after the recent Nvidia earnings boosted sentiment. Historically, whenever the 21 EMA and 50 EMA near a bearish crossover, the market tends to bounce before deciding direction. This pattern is aligning again as selling volume pressure has decreased significantly, indicating that downside momentum is weakening.
If Bitcoin can retest the $116,500 level and hold above it, short-term bulls may regain confidence. However, the real test lies at the $118,000 zone. A sustained breakout and close above this key resistance could open the path for another push toward $125,000. Until then, traders should keep a close eye on EMA reactions and volume confirmations before positioning.

BTC/USDBtc seems to have touched the Demand zone I am expecting a W or double bottom in the marked area for a buy signal

M patter on BTCAs you can see we are right now retesting the middle of the M. Next level go to previous structure also respecting the fib level.

BTC Awareness📉 BTC Awareness
The market has already broken structure and pressure remains to the downside. A retest and small rejection could push price further down, with the monthly magnet zone still pulling price lower.
It’s all written on the chart already — later people will blame Trump, but the chart shows it clearly.

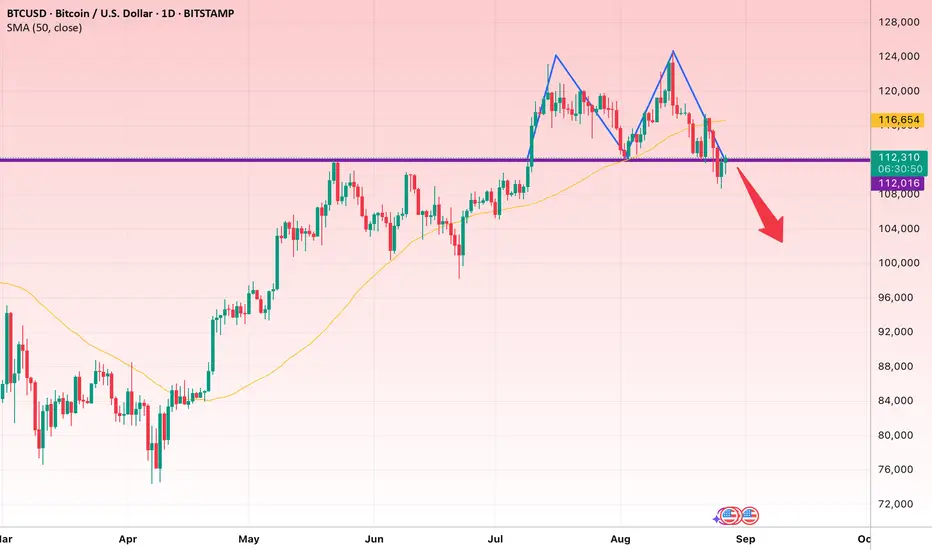
Bitcoin Signals Deeper Correction as Double Top FormsBitcoin has broken below its 50-day moving average, signaling weakening bullish momentum in the short term. At the same time, the emergence of a classic Double Top pattern near a key resistance zone has intensified selling pressure, raising the likelihood of further downside. If upcoming support levels fail to hold, Bitcoin could enter a deeper corrective phase and potentially face a prolonged consolidation period.
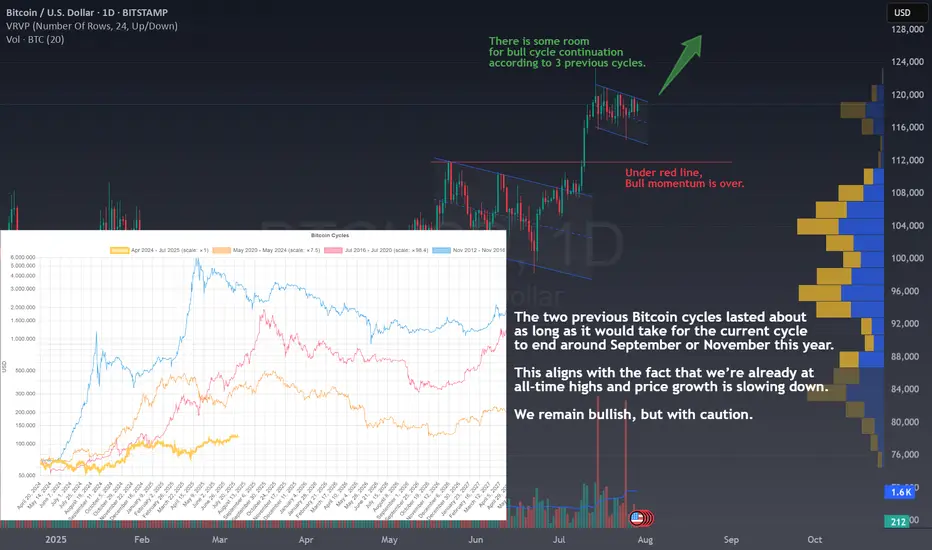
Bitcoin’s Bull Run: Is There Still Fuel in the Tank?Bitcoin has had an impressive year, breaking out of a downward channel and launching into a strong upward rally as we saw in the previous idea .
But now, price action is slowing, and many are asking: Is the bull run over or just taking a breather?
Let’s look at what the chart tells us.
📈 A Classic Bull Flag in the Making
After the breakout, BTC seems to be forming another channel or what traders often call a bull flag . This is typically a bullish continuation pattern , meaning that after a short consolidation, price may break upward again.
But that’s the technical side. What about the big picture?
🔁 Bitcoin Cycles: History Rhymes
In the chart below the price, we see a comparison of Bitcoin’s last two cycles (shown in red and orange). Interestingly, both of those cycles point to end between September and November this year.
If history repeats, or at least rhymes, the current cycle could follow the same timeline. That gives us a few more months of potential upside before this bull run starts cooling off.
Note that the first cycle peaked faster, but also had a mini bull momentum in the same zone where the next cycles peaked.
⚠️ Still Bullish, But Watch Your Step
Even though we’re near all-time highs and price is showing signs of slowing, there may still be room for growth. However, the risk is increasing, so this is a time to stay bullish but with extra caution.
A key level to watch is marked in red on the chart. Falling below it could mean the bull momentum is fading. The reason is quite simple, a bull rally can't trade inside prices of previous consolidation phases because that means lateral or bear momentum.
🧠 Final Thoughts
Bitcoin has a history of repeating patterns, and right now, we seem to be tracking closely to previous cycles. With a potential breakout forming and a few months left on the clock, there could still be opportunities ahead.
But don’t forget: every cycle ends. Stay alert, manage risk, and don’t chase green candles blindly.
💬 Does this setup align with your view on BITSTAMP:BTCUSD ?
🚀 Hit the rocket if this helped you spot the opportunity and follow for more clean, educational trade ideas!
BTC is still bullish, why do you guys give up so easily?The blue zone has been on my chart for more than 1 year now and that has been my predicted zone of BTC price reversal. It can surpass it by far but it definitely should reach there.
Almost everyone is calling the top now, that should be enough reason to tell you the top isn't in yet. This bullish momentum caught many people unaware. Same will happen with the bearish, I will guide you through both.
Now it is possible that a sweep of the previous low will be done again, if it does, we enter again. 8 mean 108700 level. The trend is still up
Enjoy the ride.

BTC H&S FORMATIONThis H&S formation is giving a mind blowing target of 101000. A close above 117000 invalidates the pattern. Intermediate support is at 108000.

Bitcoin Finds Resistance at $112KBitcoin is struggling to reclaim the $112,000 level – a key support that has now flipped into resistance. After breaking down last week, price retested this zone and failed to close back above it, confirming it as a new ceiling for the time being.
The daily chart shows that momentum has weakened since the rejection near $123,000, with lower highs and lower lows forming over the past two weeks. The 50-day moving average, which had been acting as dynamic support, has also rolled over and now sits above current price – another bearish sign.
Volume tells a similar story. The initial breakdown below $112,000 came with a spike in activity, while the subsequent bounce attempts have been met with lighter participation. That suggests buyers are hesitant to step in aggressively until a stronger level of support is tested.
The most obvious downside target is the $100,700 area – the next significant horizontal level on the chart. A deeper pullback could even revisit the longer-term trendline near $98,000, though that would likely require further weakness across risk assets.
For bulls, the path forward is clear: reclaim $112,000 with conviction, ideally on strong volume, and then work toward building higher lows. Until that happens, the market is at risk of grinding lower.
In short: $112,000 is the line in the sand. As long as price trades below it, the bias tilts bearish with $100,700 as the next key level to watch.

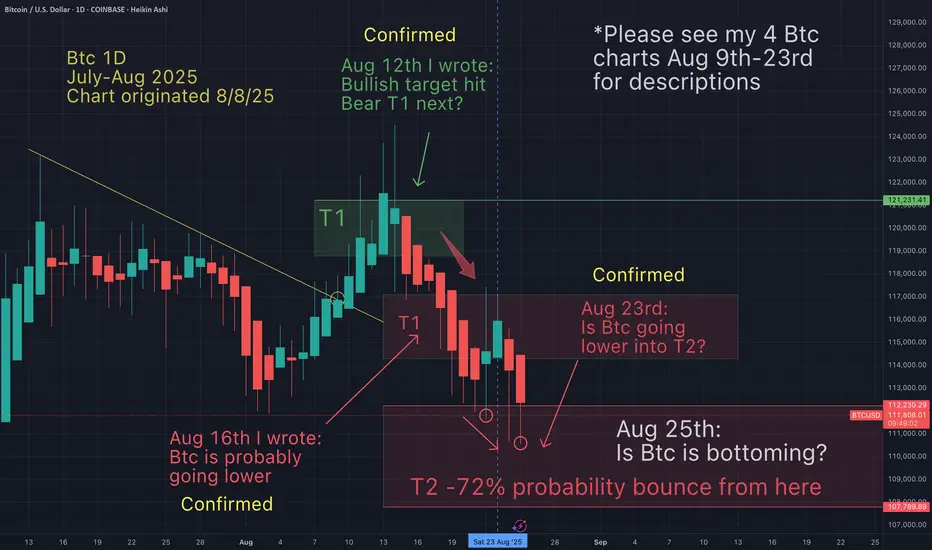
Is Btc finally bottoming (and alts)?Is Btc finally bottoming? If not today, then soon. There might be one more undercut of today's low (current low is $110,560). But since I dont want to miss the train before it leaves the station I'm getting on here at 110K. Could it hit 108K, sure. But that's only a 2% margin of error, which is acceptable. Of course there will be stops in place if Btc goes below 108K.
May the trends be with you.
Bearish BTC is coming; Candle confirmation at 110k is neededAfter falling below 110k, I believe BTC is going to have the ''Last Kiss'' scenario to confirm its bearish momentum. While it has come up again towards 110k, I believe it's going to confirm the bearish scenario and goes for 107k, 105k and 103k in a short period. But for a long overview, 95k is probable.
