Bitcoin’s Bull Run: Is There Still Fuel in the Tank?Bitcoin has had an impressive year, breaking out of a downward channel and launching into a strong upward rally as we saw in the previous idea .
But now, price action is slowing, and many are asking: Is the bull run over or just taking a breather?
Let’s look at what the chart tells us.
📈 A Classic Bull Flag in the Making
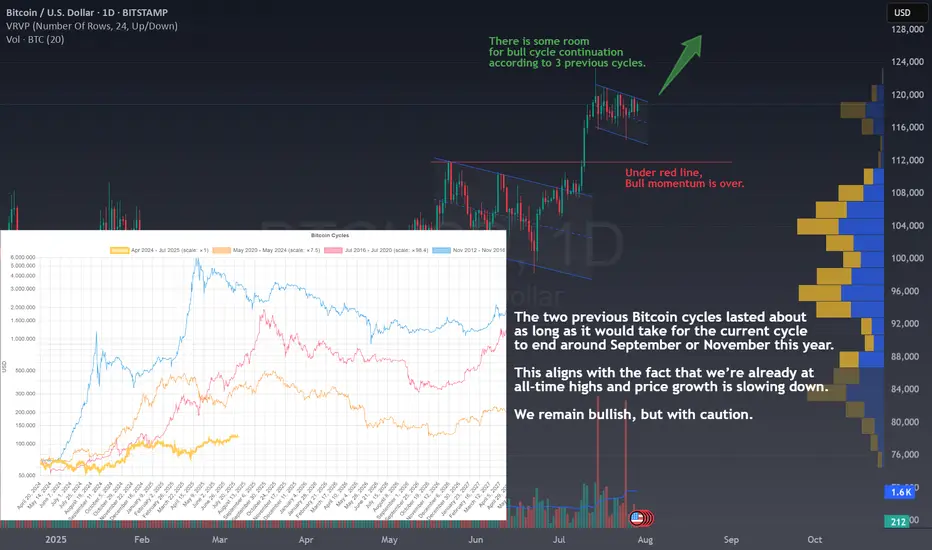
After the breakout, BTC seems to be forming another channel or what traders often call a bull flag . This is typically a bullish continuation pattern , meaning that after a short consolidation, price may break upward again.
But that’s the technical side. What about the big picture?
🔁 Bitcoin Cycles: History Rhymes
In the chart below the price, we see a comparison of Bitcoin’s last two cycles (shown in red and orange). Interestingly, both of those cycles point to end between September and November this year.
If history repeats, or at least rhymes, the current cycle could follow the same timeline. That gives us a few more months of potential upside before this bull run starts cooling off.
Note that the first cycle peaked faster, but also had a mini bull momentum in the same zone where the next cycles peaked.
⚠️ Still Bullish, But Watch Your Step
Even though we’re near all-time highs and price is showing signs of slowing, there may still be room for growth. However, the risk is increasing, so this is a time to stay bullish but with extra caution.
A key level to watch is marked in red on the chart. Falling below it could mean the bull momentum is fading. The reason is quite simple, a bull rally can't trade inside prices of previous consolidation phases because that means lateral or bear momentum.
🧠 Final Thoughts
Bitcoin has a history of repeating patterns, and right now, we seem to be tracking closely to previous cycles. With a potential breakout forming and a few months left on the clock, there could still be opportunities ahead.
But don’t forget: every cycle ends. Stay alert, manage risk, and don’t chase green candles blindly.
💬 Does this setup align with your view on BITSTAMP:BTCUSD ?
🚀 Hit the rocket if this helped you spot the opportunity and follow for more clean, educational trade ideas!
BTCMINI trade ideas
BTC is still bullish, why do you guys give up so easily?The blue zone has been on my chart for more than 1 year now and that has been my predicted zone of BTC price reversal. It can surpass it by far but it definitely should reach there.
Almost everyone is calling the top now, that should be enough reason to tell you the top isn't in yet. This bullish momentum caught many people unaware. Same will happen with the bearish, I will guide you through both.
Now it is possible that a sweep of the previous low will be done again, if it does, we enter again. 8 mean 108700 level. The trend is still up
Enjoy the ride.

Yes, here is another Bitcoin "DOOM" dome !!!Yes, here is another Bitcoin "DOOM" dome !!!
This time priced in gold, on the weekly time frame.
I added a plethora of annotations...
Just so the trolls can't come back later and say that the analysis was wrong.
Take your time to read properly.

BTC H&S FORMATIONThis H&S formation is giving a mind blowing target of 101000. A close above 117000 invalidates the pattern. Intermediate support is at 108000.

Bitcoin Finds Resistance at $112KBitcoin is struggling to reclaim the $112,000 level – a key support that has now flipped into resistance. After breaking down last week, price retested this zone and failed to close back above it, confirming it as a new ceiling for the time being.
The daily chart shows that momentum has weakened since the rejection near $123,000, with lower highs and lower lows forming over the past two weeks. The 50-day moving average, which had been acting as dynamic support, has also rolled over and now sits above current price – another bearish sign.
Volume tells a similar story. The initial breakdown below $112,000 came with a spike in activity, while the subsequent bounce attempts have been met with lighter participation. That suggests buyers are hesitant to step in aggressively until a stronger level of support is tested.
The most obvious downside target is the $100,700 area – the next significant horizontal level on the chart. A deeper pullback could even revisit the longer-term trendline near $98,000, though that would likely require further weakness across risk assets.
For bulls, the path forward is clear: reclaim $112,000 with conviction, ideally on strong volume, and then work toward building higher lows. Until that happens, the market is at risk of grinding lower.
In short: $112,000 is the line in the sand. As long as price trades below it, the bias tilts bearish with $100,700 as the next key level to watch.

BTC/USDBtc seems to have touched the Demand zone I am expecting a W or double bottom in the marked area for a buy signal

Bearish BTC is coming; Candle confirmation at 110k is neededAfter falling below 110k, I believe BTC is going to have the ''Last Kiss'' scenario to confirm its bearish momentum. While it has come up again towards 110k, I believe it's going to confirm the bearish scenario and goes for 107k, 105k and 103k in a short period. But for a long overview, 95k is probable.

BTC Awareness📉 BTC Awareness
The market has already broken structure and pressure remains to the downside. A retest and small rejection could push price further down, with the monthly magnet zone still pulling price lower.
It’s all written on the chart already — later people will blame Trump, but the chart shows it clearly.

Bitcoin – Long-Term Outlook with Elliott Wave StructureBitcoin – Long-Term Outlook with Elliott Wave Structure
Hello traders,
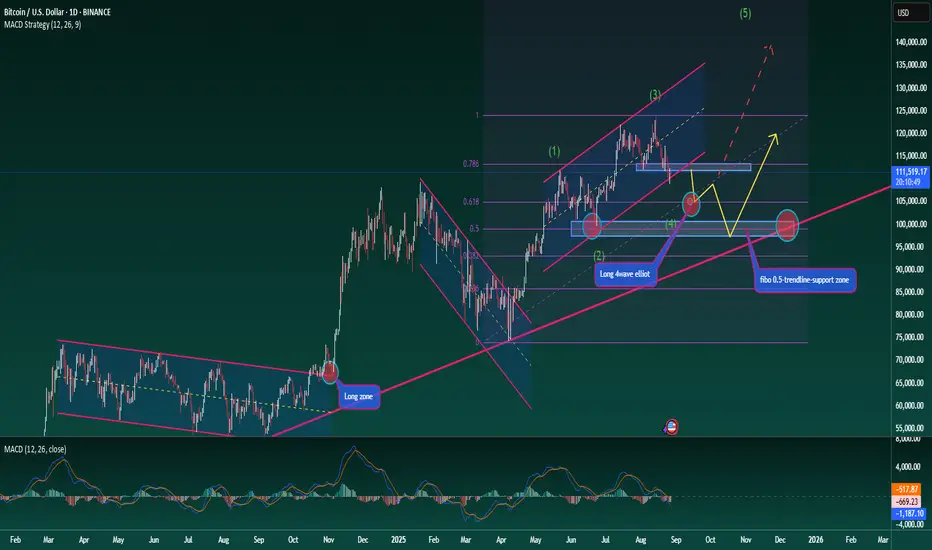
Taking a step back for a medium- to long-term perspective on BTC. The broader trend remains bullish, yet for any rally to be sustainable, corrective phases are essential. Right now, BTC is in a corrective move, which aligns with wave 4 of the Elliott Wave structure.
To measure the depth of this correction before wave 5 develops, we can look at the Fibonacci retracement levels. Two zones stand out as significant: 0.618 and 0.5.
At 0.618, support is strong but not yet decisive. If price reacts here and wave 5 unfolds, the Elliott count stays intact and relatively clean.
At 0.5, this is often the ideal retracement level on Fibonacci. The chart also shows this as a major structural support. If it breaks, deeper downside could follow, as the ascending trendline also suggests.
Long-Term Trading Plan
Entry 1: Around the 0.618 retracement at 105k
Entry 2: Around the 0.5 retracement at 99k
This setup forms the basis for a medium-term strategy, but if the second zone (99k) holds strongly, it could well serve as the foundation for a longer-term bullish cycle.
Stay patient, keep risk management at the forefront, and let the structure play out.
What’s your take on BTC’s long-term wave structure? Drop your thoughts in the comments and let’s discuss.
Bitcoin Strategy AnalysisBitcoin previously fell below the 110,000 mark, returning to its previous consolidation zone. Strategically, we recommended opening long positions below this mark, anticipating a rebound. As expected, the market reclaimed 110,000, reaching a high of around 112,400, demonstrating that the short-term trend is correct.
So, what should we do next? I believe we should prioritize opening long positions on pullbacks. If the price pulls back to around 111,000, we should open long positions with a target of 112,500. If it continues to rebound, we should hold on and anticipate higher prices.

BTC Decision Zone – Bulls Defend or Bears Take Over?Bitcoin (BTC) Market Analysis – Key Technical and Fundamental Insights
Technical Outlook:
Trend: BTC is trading within a defined range, with major resistance around 122,500–125,000 USD and critical support at 107,500–110,000 USD. The price action has printed a double top pattern, typically a bearish signal, followed by lower highs and increased selling volume.
Momentum: Indicators such as RSI and MACD (based on typical setups) suggest weakening bullish momentum; a decisive break below support could confirm further downside. Conversely, a bounce from this zone could trigger a short-term corrective rally toward 115,000–117,500 USD.
Volume & Market Structure: High trading activity around 110,000 reinforces its importance. If this level fails, a volume gap below it could lead to swift moves toward 105,000–100,000 USD.
Fundamental Factors:
Macro Conditions: Ongoing uncertainty around U.S. interest rate policy and dollar strength adds pressure to risk assets like BTC. A hawkish Fed stance tends to weigh on crypto, while any pivot to easing could support prices.
Regulation: Global regulatory scrutiny remains a risk; any negative developments could accelerate bearish sentiment.
Adoption & Institutional Flow: Long-term fundamentals remain constructive with rising institutional participation (ETFs, custody solutions), but short-term volatility persists as traders react to macro headlines and liquidity conditions.
Conclusion & Outlook:
BTC is at a decision point. A sustained hold above 107,500 could favor short-term buyers, while a confirmed break below opens room for deeper downside. Long-term investors may view pullbacks as opportunities for accumulation, but traders should remain cautious and manage risk actively.

BTC Might Drop to 100,000 (at least) After Today's Retest CandleSaw a Double Top Pattern in 1D with a minimum objective of going to 99,800. Also saw a Head and Shoulders in 4H , with a measurement minimum objective of going to 106,500 more or less
Although this is a bearish signal. I will be looking for the retest today. So far, today's candles are showing a lot of bullish patterns. Starting from the Flat Top Triangle in 1H , and the Inverse Head and Shoulders in 15m in total agreement with its volume.
For me, it's safe to say i will be taking this buy trade and set my TP at 111,500.00. After that, i will wait for consolidation and watch for a downside break and enter for a sell there. My TP for the sell will be divided into 2. 1 at around 105,200. and 1 at around 99,800. Stop loss will be just above 112,900.
Anyways, Disclaimer on. Happy Trading!

Bitcoin Halts Declines Around the $111,000 ZoneThe last few trading sessions have been particularly challenging for Bitcoin’s bullish momentum in the short term, mainly because two sessions ago the price dropped by more than 6%. This pullback was driven by profit-taking, following Powell’s comments at Jackson Hole, which had sparked a brief surge in confidence toward the end of last week. However, the current scenario is different: after this sharp drop, a highly neutral sentiment has emerged on the chart, as the market continues to assess how a lower interest rate environment could impact Bitcoin demand in the coming weeks.
For now, the Crypto Fear & Greed Index remains in neutral territory, standing at 43 points, right on the threshold where a new “fear” phase could start to develop in the sentiment indicator. As long as uncertainty persists in the short term, it is likely that neutrality will continue to dominate movements in the sessions ahead.
A Significant Bearish Move Emerges
Bitcoin’s price had managed to sustain an uptrend from early April until mid-August. However, at that point a relevant bearish bias began to surface, consistently breaking through the prevailing uptrend line and putting at risk the bullish momentum that had supported the chart. Now, the predominance of selling pressure in the short term raises the risk of triggering a move that could give way to a more consistent downtrend in the coming sessions.
RSI: the RSI line has slipped slightly below the neutral 50 level, reflecting that selling momentum has started to dominate in the short term. If this pattern persists, bearish pressure could intensify in the upcoming sessions.
MACD: the MACD histogram also shows a bearish bias, as it remains below the 0 line. This indicates that the average of recent moving averages has shifted into negative territory, reinforcing the outlook for the continuation of the current correction.
Key Levels to Watch:
$122,000 – Historical High Zone: the main barrier for bullish moves. A sustained return to this level could reactivate the uptrend line that has recently been broken.
$113,000 – Immediate Resistance: corresponds to the 23.6% Fibonacci retracement and acts as the nearest barrier in the short term. A breakout above this level would end the current bearish bias and could pave the way for a more neutral scenario.
$106,000 – Definitive Support: aligns with the 100-period moving average. A break below this level would imply a deeper change in market structure, opening the door to a more solid bearish trend in the short term.
Written by Julian Pineda, CFA – Market Analyst

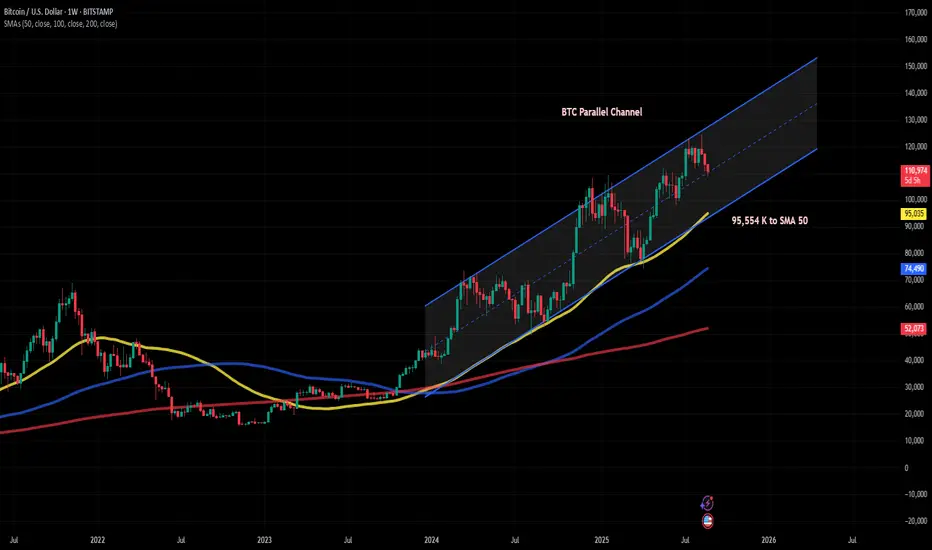
Bitcoin Parallel Channel holding Strong - Bull Run is still !!I have made this chart to show that even though Bitcoin is dropping we are still in a parallel channel. Until this is definitely broken I have to conclude that we are still in a bull market. We could continue to drop even more down 22% and still be in a bull market.
The 50 Week Simple Moving Average is red line to use gauge whether you should get out or not. It a clear stop loss for this entire bull cycle.
Do you guys agree let me know ??
How are you protecting to the downside ?
btc levels Btc has hit the 111111 off the clean close above 110472 level we need to hold this level if you took a long move stops up lick in profits


Bitcoin Holds Steady After Two SessionsBitcoin Holds Steady After Two Sessions
Hello traders,
BTC has managed to hold its ground within the descending channel after the past two sessions. The bearish trend remains intact following the break below the 115.5k support. For now, the plan is to continue trading in line with the channel structure, focusing on scalping opportunities at the boundaries until wave 3 is expected to complete near 105k.
If price breaks out of the channel earlier, backed by strong volume, then trade with the breakout:
Short-term: follow the downside move if price breaks lower.
Long-term: take buying opportunities if price breaks higher and confirms the reversal.
Since wave 3 could finish earlier than expected, it’s important to stay flexible and monitor price closely.
What’s your outlook on BTC at this stage? Share your thoughts in the comments so we can learn together.

PATTERN-BASEDExecute based on the options that shows up. If pattern A shows up, there must be a choch and liquidity build up at 50% the choch for entry. I'm bullish at the moment. Get the prices

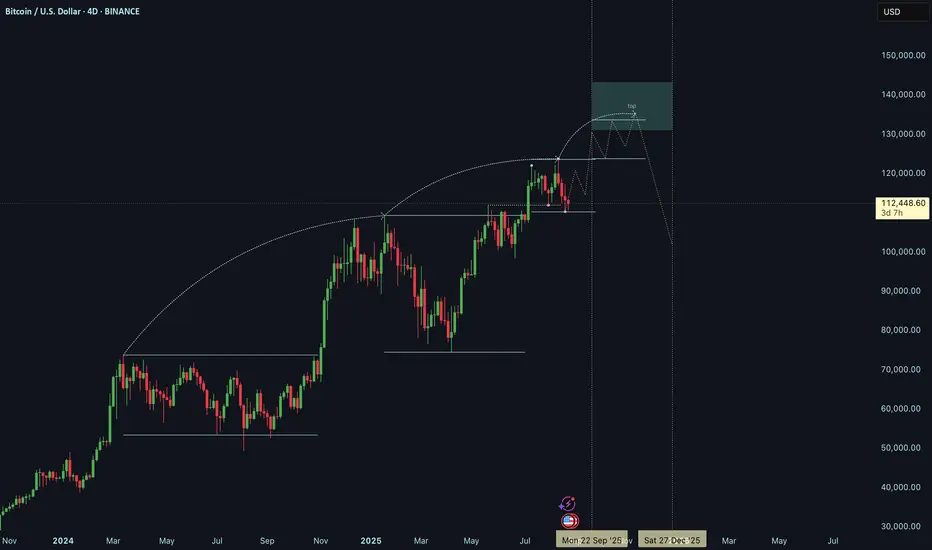
BTC MACRO TOP we cans see a decrease at every BOS.
Time x Fibs are in confluence -> sep - dec
It will no surprise me signs of distribution at that time/zone
BTCUSDT - high placed ? What's next ??#BTCUSDT... so far market placed a very reasonable day high that is 122600-700 around.
So if market holds that then drop expected.
Above current day high it will be invalidate.
Gold luck
Trade wisely

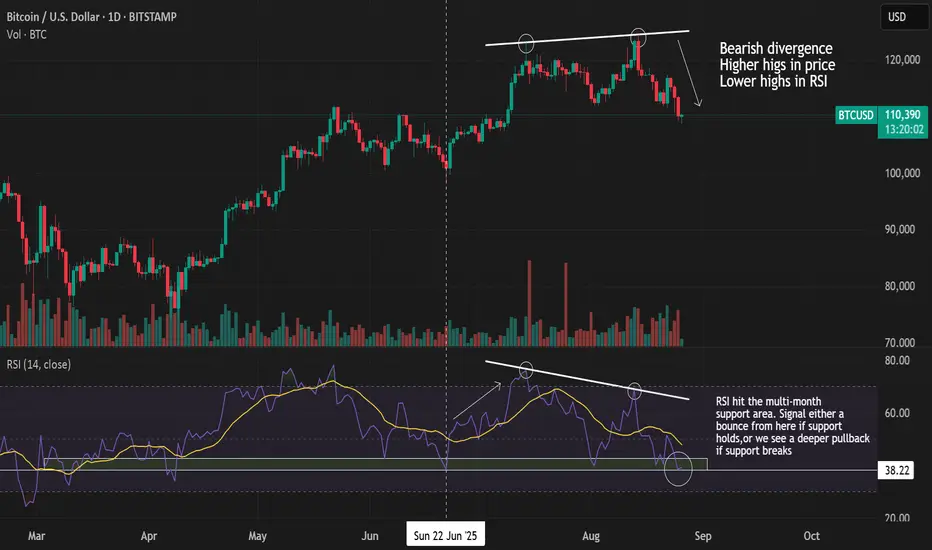
My Take on Bitcoin - RSI Divergence and Support CheckWhat I’ve Noticed
I’ve been keeping an eye on Bitcoin’s RSI since early April, and it’s built a pretty reliable support around 39.92, tested a few times.
Here’s my breakdown:
June 5: Dropped to support and bounced back up.
June 22: Tested it again, smashed through 50, and hit a high near 75.
August 2: Another support test, but the rally felt weaker than before.
Recent High: Saw a higher price peak around 124k, but RSI highs were dropping—bearish divergence hit me right then. Time to sell or short!
Today (Aug 26, 2025): RSI at 38.22, right on that support line.
My Call
That divergence at 124k was my signal to get out or go short. Now, with RSI testing support, I’m betting on a bounce if it holds firm. But if it breaks, I’d expect a deeper pullback ahead.
Has Bitcoin peaked? What's your take on it?After Bitcoin experienced three consecutive trading days of downward movement with bearish candles, it has been in a period of consolidation with fluctuations throughout today. From the perspective of price action on the chart, this three-day consecutive decline has not only digested part of the profit-taking orders from the previous upward trend but also rebalanced the bullish and bearish sentiments in the market—there is neither the frenzy seen during the earlier unilateral upward movement nor excessive panic selling. The price has exhibited characteristics of narrow-range fluctuations and repeated testing within a key range.
Specifically regarding key price levels, focus should be paid to the resistance range of $110,650 - $112,000 on the upside: among them, $110,650 is a short-term resistance level that was touched multiple times during yesterday's fluctuations but failed to break through effectively, while $112,000 is a phased high point from the previous upward trend. These two levels form overlapping resistance; if a breakthrough with sufficient trading volume cannot be achieved in the future, the short-term upward space may be limited. On the downside, the support is divided into two tiers. The first support is the intraday low of $108,800 set today—this level remained unbroken after multiple tests during the day, indicating the absorbing capacity of short-term buying orders. The second support is $107,000, which is not only the lower edge of the previous consolidation platform but also a crucial support threshold for the market trend in the past two weeks. A breakdown below this level may trigger a further correction.
It is worth noting that the price range where Bitcoin is currently located is exactly the "top-bottom conversion level" from the previous upward trend—this range was once a resistance zone that suppressed price upward movement in the past, and after being broken through with heavy volume, it has successfully transformed into a core support zone during the current consolidation phase. At the same time, from the perspective of chip distribution, this range is also a concentrated area for recent capital transactions, with a large number of long-position chips accumulated here, further strengthening the effectiveness of the support. The probability of a significant breakdown in the short term is relatively low.
Based on the current market structure and technical logic, the following trading strategy suggestions are put forward: go short with a light position around $110,600, set the stop-loss at $111,000, and target $109,000; if a stabilization signal appears around $108,800, one can attempt to go long with a light position, with the upside target looking at the resistance range of $110,650 - $112,000. At the same time, it is necessary to closely monitor changes in trading volume—if the trading volume is insufficient when breaking through the resistance level, profits should be taken and positions exited in a timely manner to avoid the risk caused by a renewed pullback in the market trend.
