Bitcoin: waits Fed move?The crypto market was holding relatively calm during the previous week. Weaker than expected non-farm payrolls data this time did not have a significant impact on the price of BTC, indicating that investors are currently more focused on positioning for the expected Fed rate cut at the FOMC meeting in September. The focus of this week was on equities and gold, while it seems that the major moves on the crypto market are left for the week(s) prior or after the FOMC meeting.
The price of BTC started the week around $107,8K, and moved a bit higher, testing the $112K level. However, the end of the week brought another push back, where BTC is closing weekly trading around $110K. The RSI continues to move below the 50 level, indicating that the market is still eyeing the oversold market side. The MA50 started its convergence toward the MA200. There is still a relatively higher distance between two lines, in which sense, the potential cross is still not in the store.
Current charts are showing the potential for further weakening of BTC in the week ahead. There is potential that the support line at $108K could be shortly tested for one more time. At this moment, there is no indication that the price could go lower from this level. This might be the final reversal point where the BTC might start its move again to the higher grounds, where the $112K could be tested for one more time. Such a move could trigger demand, and again return BTC toward higher levels from the current ones.
BTCMINI trade ideas

BTCUSD 4H – From Breakdown to Breakout?Price broke the clean downward trendline and is now sitting on a *mitigated order block* around 110K – a key zone where buyers previously stepped in. We’re seeing consolidation just above this level, suggesting price is building strength.
Two possible scenarios:
1. *Bullish continuation:* Price holds above the OB and pushes toward *112K*, aiming for the *122K–124K* zone next.
2. *Liquidity grab:* A quick dip into the *108K area* to sweep lows before launching higher.
Trendline is broken ✔️
Order block respected ✔️
Structure shifting bullish ✔️
*Watching closely for bullish confirmation.*

BTCUSD H1 | Pullback resistance triggering bearish reversalBitcoin (BTC/USD) is rising towards the sell entry of 112,278.38, which is a pullback resistance that aligns with the 61.8% Fibonacci retracement and could reverse from this level to the downside.
Stop loss is at 114,720/58, which is a pullback resistance that aligns with the 138.2% Fibonacci extension.
Take profit is at 109,371.71, which is a pullback support.
High Risk Investment Warning
Trading Forex/CFDs on margin carries a high level of risk and may not be suitable for all investors. Leverage can work against you.
Stratos Markets Limited (tradu.com ):
CFDs are complex instruments and come with a high risk of losing money rapidly due to leverage. 65% of retail investor accounts lose money when trading CFDs with this provider. You should consider whether you understand how CFDs work and whether you can afford to take the high risk of losing your money.
Stratos Europe Ltd (tradu.com ):
CFDs are complex instruments and come with a high risk of losing money rapidly due to leverage. 66% of retail investor accounts lose money when trading CFDs with this provider. You should consider whether you understand how CFDs work and whether you can afford to take the high risk of losing your money.
Stratos Global LLC (tradu.com ):
Losses can exceed deposits.
Please be advised that the information presented on TradingView is provided to Tradu (‘Company’, ‘we’) by a third-party provider (‘TFA Global Pte Ltd’). Please be reminded that you are solely responsible for the trading decisions on your account. There is a very high degree of risk involved in trading. Any information and/or content is intended entirely for research, educational and informational purposes only and does not constitute investment or consultation advice or investment strategy. The information is not tailored to the investment needs of any specific person and therefore does not involve a consideration of any of the investment objectives, financial situation or needs of any viewer that may receive it. Kindly also note that past performance is not a reliable indicator of future results. Actual results may differ materially from those anticipated in forward-looking or past performance statements. We assume no liability as to the accuracy or completeness of any of the information and/or content provided herein and the Company cannot be held responsible for any omission, mistake nor for any loss or damage including without limitation to any loss of profit which may arise from reliance on any information supplied by TFA Global Pte Ltd.
The speaker(s) is neither an employee, agent nor representative of Tradu and is therefore acting independently. The opinions given are their own, constitute general market commentary, and do not constitute the opinion or advice of Tradu or any form of personal or investment advice. Tradu neither endorses nor guarantees offerings of third-party speakers, nor is Tradu responsible for the content, veracity or opinions of third-party speakers, presenters or participants.

BTC/USD Quick Scalping Idea – Buy the DipA quick scalping setup on Bitcoin (BTC/USD).
I expect an upward move toward the target in the coming minutes or hours.
Any dip can be seen as another buying opportunity toward the same target.

Bitcoin on the road to ZEROCycles and HSI (week 97 today) work alone says CRYPTOCAP:BTC has topped for this cycle and is set to lose at minimum 80%. There is always a clear 5 up, 3 down wave count for BTC and it has completed now. All the massive ETF and Ponzi Treasury Buys couldn't even muster up BTC price to $150k. Its totally cooked.. In my view, its going much lower since the absolute inherent value of all crypto is ZERO. No major central bank will touch it and wants to kill it as BTC presents a threat to the member banks. Come on guys, 2.1 TRILLION UNITS of something makes it rare and scarce. The GENIUS act was the final nail in the coffin for crypto. They will kill it for good soon. The whole coinmarketcap will deflate in the 2026-2031 Greatest Depression. Nobody will have any money and everything will be sold off. The pain will be intolerable for many. Jobs are going away (not because of AI) and crypto will be the last thing people need to survive. This was the final hurrah for Bitcoin. A symbol of the massive speculative excess liquity will be drained in short order shortly...

Bearish reversal?The Bitcoin (BTC/USD) is reacting off the pivot which is a pullback resistance and could drop to the 1st support.
Pivot: 112,817.18
1st Support: 104,329.52
1st Resistance: 117,395.83
Disclaimer:
The above opinions given constitute general market commentary, and do not constitute the opinion or advice of IC Markets or any form of personal or investment advice.
Any opinions, news, research, analyses, prices, other information, or links to third-party sites contained on this website are provided on an "as-is" basis, are intended only to be informative, is not an advice nor a recommendation, nor research, or a record of our trading prices, or an offer of, or solicitation for a transaction in any financial instrument and thus should not be treated as such. The information provided does not involve any specific investment objectives, financial situation and needs of any specific person who may receive it. Please be aware, that past performance is not a reliable indicator of future performance and/or results. Past Performance or Forward-looking scenarios based upon the reasonable beliefs of the third-party provider are not a guarantee of future performance. Actual results may differ materially from those anticipated in forward-looking or past performance statements. IC Markets makes no representation or warranty and assumes no liability as to the accuracy or completeness of the information provided, nor any loss arising from any investment based on a recommendation, forecast or any information supplied by any third-party.

Weekly Candle Close - .382From the recent swing low to swing high on the daily timeframe, today’s daily candle closed right at the 0.382 Fibonacci retracement around $111,032. In my view, that’s a constructive sign – it suggests buyers are still stepping in to defend higher levels rather than letting price break deeper immediately.
What’s also worth noting is that today marks the open of a new weekly candle. Starting the week with strength above the 0.382 level gives me a slightly bullish bias, not just for BTC but also across altcoins.
Of course, the market doesn’t move in a straight line. If we do see more downside, I’m prepared for potential retests at the 0.618 ($109,589) or even the 0.786 ($108,562) levels – both of which are natural supports within the Fib structure. But overall, the structure here still looks bullish in the bigger picture.
Key Levels to Watch:
• 0.382 Fib: $111,032 (holding for now)
• 0.618 Fib: $109,589 (next possible support)
• 0.786 Fib: $108,562 (deeper retest level)
• Local high: $113,368 (break above here could accelerate momentum)


It's Quite Simple ActuallyWhat do you think? Nothing fancy. Based on what I'm seeing here (lining up with the middle of a fib zone) it's looking like we wick above the ascending resistance line to ~132k and have a candle close on/around the trend line for top of cycle. That is all dependent on when/if we get there, but looking good so far. Also note the ascending support line which puts a target around 30k for next bear market low. To me this makes a bit of sense.. after a halving lowest possible value should be ~2x the previous low. The RSI on the 4D is telling us a lower low is printed every market bottom so far. Worth noting. Best of luck to everyone out there. We're golden. BITSTAMP:BTCUSD

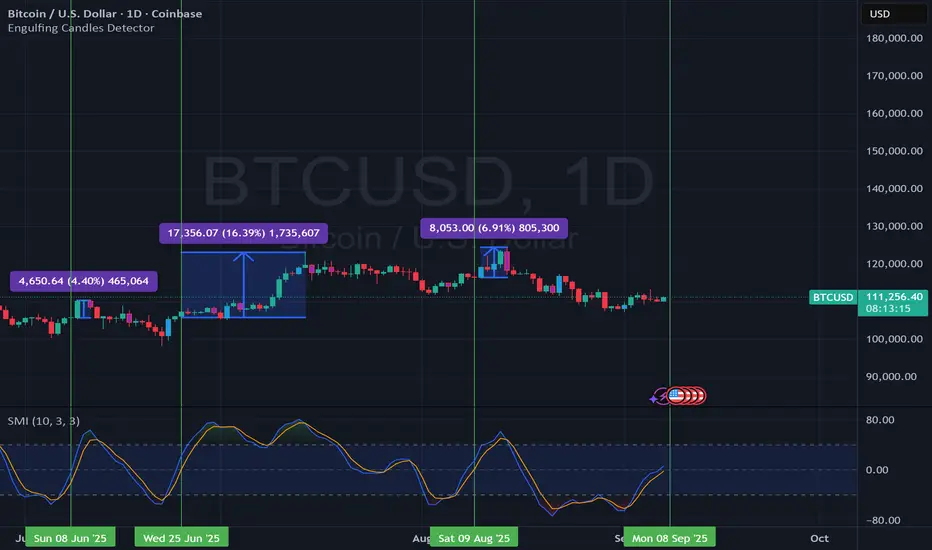
Bitcoin showing Bullish Potential on Stochastic Momentum Indexstochastic momentum is showing some bullish potential with a possible 0 threshold cross from oversold in the making. The last three times it did so it was a range of 4.4%, 16.3%, and 6.91% increase following the transition of the K (line) and D (signal) across the 0 threshold coming from oversold.
WEEKLY UPDATE ON BTC, ETH, BTC.D - 9/7/2025This weekend's technical analysis is an update from previous week's analysis posted. I am expecting BTC to continue it's price action to the daily 200 EMA after the relief bounce off from the weekly 21 EMA as noted last week. Our BTC analysis will be invalidated if the on the daily chart we get a candle open and close above $114k on good volume and momentum as the weekly and monthly chart is still in a strong uptrend.
ETH pullback is also intact as discussed from last week and approaching the breakout price level of $4000 which coincides with the weekly 9EMA support zone. I will be expecting ETH bulls to battle this level in a consolidation price action before a break down to the weekly 21 EMA target of 3,500.
Bitcoin Dominance did follow through our analysis last week with the inverted hammer play and has now also given some confirmation of a temporal reversal based on indicators. I will be expecting a bounce on Bitcoin Dominance to the resistance level of 59.2% and if there enough momentum to break through the resistance then next target will be 60.64%.
That's a summary of what I will be looking for on these charts as the week unfolds. Thanks for spending time to listen to my analysis and opinion and I wish you the best of trading this week. Cheers !!!

$BTC Milestone Alert & Price will hit $128K or $88K in Sep, 2025✨Bitcoin Milestone Alert & Price will hit $128K or $88K in September or October 2025 🚀
CRYPTOCAP:BTC has now stayed above the $100K level for 122 consecutive days. Price will Bounce Back to $105K to $128K Range and if drop retest it will be the $88K-$92K Zone otherwise PUMP ongoing.
That’s over 4 months of holding six-figure territory, proving that $100K isn’t just a breakout, it’s becoming a new market baseline.
The question isn’t if Bitcoin can hold, but what’s next from here?
REMINDER: Hidden bullish divergence could confirm on today’s weekly close. Mega-bullish for Bitcoin. Q4 Will be explosive. Millionaires will be created. You just have to stay in the game. Do you understand?
Q4 Will be explosive. Millionaires will be created. You just have to stay in the game. Do you understand?
📊 This September Big Economic Week Incoming
• Tuesday (Sept 9): U.S. Non-Farm Payrolls Annual Revisions
• Wednesday (Sept 10): U.S. PPI (Producer Price Index)
• Thursday (Sept 11): U.S. CPI (Consumer Price Index) & ECB Rate Decision
🌍 EXPECT VOLATILITY!
#Write2Earn #BinanceSquareFamily #Binance #BTC☀ #SUBROOFFICIAL
Disclaimer: This article is for informational purposes only and does not constitute financial advice. Always conduct your own research before making any investment decisions. Digital asset prices are subject to high market risk and price volatility. The value of your investment may go down or up, and you may not get back the amount invested. You are solely responsible for your investment decisions and Binance is not available for any losses you may incur. Past performance is not a reliable predictor of future performance. You should only invest in products you are familiar with and where you understand the risks. You should carefully consider your investment experience, financial situation, investment objectives and risk tolerance and consult an independent financial adviser prior to making any investment.

BTC Long Price is moving as anticipated even during low volatility. Price could change direction on Monday, however, overall sentiment is still bullish.

The Reversal Overture: " Bitcoin's Ascent from the Depths"In the quiet hum of the market's pulse, a story begins to unfold on the 4-hour chart of Bitcoin (BTC/USD). Like a phoenix rising from the ashes, the price stirs from the depths of recent lows, hinting at a shift — a new bullish tale whispered through candlelight.
The Setup
This chart paints a scene of recovery and hope. A descending trendline, once a symbol of persistent decline, has been decisively broken. The price now emerges above it — a clear sign of strength. From the valley of support around $107,270 and a wick low near $105,692, Bitcoin claws its way upward, challenging resistance with fresh momentum.
Marked clearly are two destinations:
Destination 1: $117,218 — a waypoint on this journey, where price may briefly rest.
Destination 2: $123,125 — a higher peak, nestled beneath the looming **Major Resistance** zone that stretches toward $124,517.
The trend is now bullish, supported by a clean breakout and the formation of higher lows — the market's silent nod of approval.
The Bullish Causes are :
1. Break of the Descending Trendline
Like the first light after a storm, this break signals a potential change in character — from fear to optimism.
2. Strong Support Reaction
Price bounced with conviction from the $107K–$105K support zone. Buyers stepped in with purpose, defending a key level.
3. Higher Highs & Higher Lows in Formation
The rhythm of the market now beats in a bullish cadence — stair-stepping upward, each level stronger than the last.
4. Momentum Builds into Resistance
As the chart eyes the major resistance zone, it does so not with hesitation, but with increasing volume and energy — the lifeblood of bullish continuation.
Timeless truth:
"If there is no managed risk, one cannot take profit."
This is no flash-in-the-pan rally. It is a setup for the long run, crafted with patience and vision. The path may be winding, but the direction is clear — Bitcoin is trending, and the bulls are once again writing their chapter in this ever-evolving market tale.

BTC Scalpers : Will BTC Remains Long Bullish For Shorter Time?On 15 minute chart analysis , Given a Long setup for short time.As seen price were rejected from 110037 zone . Hopefully it will Remain Bullish up to given target 111726 that will be our next target.
current price moving zone is 110550 zone.
I named aforementioned setup is as Scalping setup for Scalpers.

BTC intra?
Hi,
We had good sellers yesterday.
Today?
We are now at retest level. of yest.. where price broke down
110,700-900
ENTRY?
Good judgement needed - money management (floating always possible)
Do ranges, and fix SL
My target for today 109800-110,000
All the best
Not a guru

BTCThe current corrective structure may be forming a flat pattern. Traders should be cautious, as BTC could see a decline once this structure is completed.

BTC: Is the Cycle Top in for 2025?We start left with the insane capitulation
recover & consolodate
breakout the white resistence
reaching 1 - consolidate creating bull flag
breakout to 2 with 3 peaks a b c
fall off a cliff in with a b c wicks
recover 3, a b c wicks
continuation to 4 with 2 peaks a b
done
breaking below the white horizontal support
altough we have still some import support below us now. Breaking the 21 Weekly MA (108k), losing ~105K support would be some really bad signs.
breaking the 100 Weekly MA (now 96K) would be very bad fore sure.
Am i on to something here? What do you guys think?

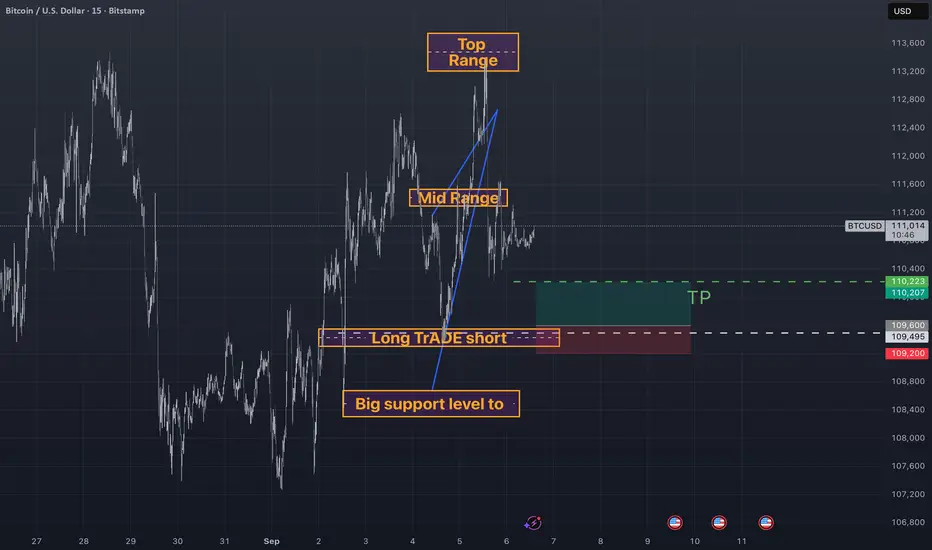
Quick big scalp OpportunityHere in the 15 min chart u can see a good Area of support around the 109600 Area , this is a quick scalp of a day with a tight stop loss of 109200, we should have a good bounce reaction in this area if we go to this area.
This trading plan can continue to be executed on weekendsAccurate Bitcoin Signals Reference:
1. Short-selling Resistance: 111,300-111,800; Major Resistance: 112,500
2. Buy-Support Support: 109,500-108,300; Major Support: 106,500
Trading involves risk; manage your position appropriately.

Bitcoin(BTC/USD) Daily Chart Analysis For Week of Sep 5, 2025Technical Analysis and Outlook:
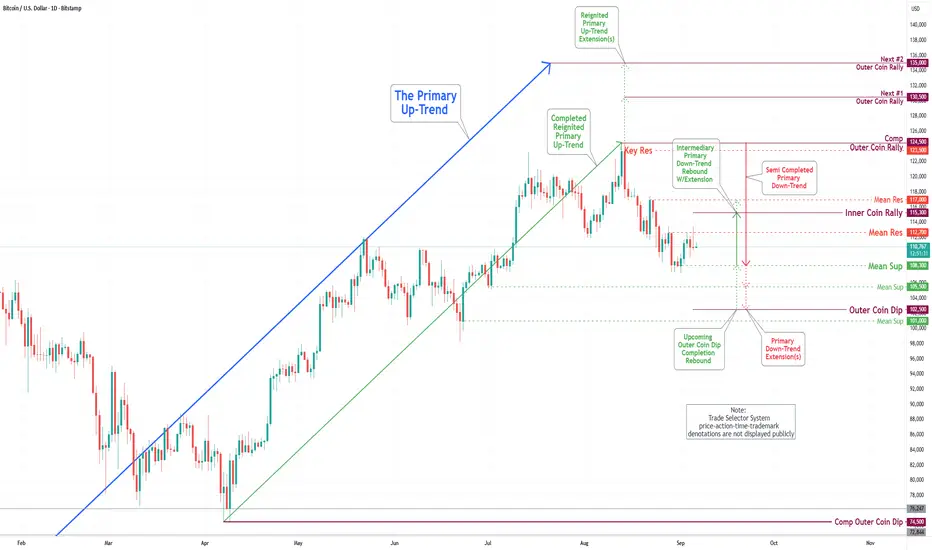
During the trading session of the previous week, the Bitcoin market demonstrated a notable upswing, ultimately reaching our designated Mean Resistance level of 117000. Subsequently, the cryptocurrency experienced a retreat and is currently undergoing a consolidation phase.
The prevailing analysis indicates a firm probability of a continuation of the Intermediary Primary Rebound toward the Inner Coin Rally 115300, with the potential to extend its progression to the Mean Resistance level of 117000. However, it is essential to highlight that the Outer Coin Dip 102500 represents the primary ongoing trend and the overall direction of the market. Upon the completion of this phase, it is anticipated that Bitcoin will resume its bullish trajectory.
Bitcoin Bitcoin Bullish Outlook
Bitcoin (BTC) is currently showing strong upward momentum, reflecting a positive market sentiment.
Technical Highlights:
Support Levels: BTC has shown resilience around key support near $107,000, indicating strong buying interest.
Breakout Confirmation: A decisive close above $111,600 would confirm bullish momentum, with potential targets near $113,500.
Market Breadth: The Bullish Percent Index for Bitcoin indicates a positive phase, suggesting the trend could continue upward.

bitcoinbitcoin is trying to reclaim resitance into support.
I will wait for weekend close to confirm and on Monday we will probabaly go long
