BreachPrice has broke down from its consolidation and breached below the 10 EMA in purple (111,813). Now price is forming on the 21 EMA in yellow, the 108K price area, if price close below that, price could possibly see more downside.
BTCMINI trade ideas

BTC USD KEY LEVELS 01-09Greetings,
Hello traders, this is the BTC-USD 15m pivot resistance zone.
Based on market trend and previous day movement.
Intraday resistance pivot resistance 2 line is represented by the yellow line. (110000)
And circular figure 110000 may act as a resistance zone.
Key levels;
Entry: 110000
Target: 110500
Stop loss: 109500
Risk Reward Ratio 1:1
Your likes and boosts motivate us to keep learning and sharing ideas!

BTC USD TOday Trades Easy Profitssimple and efficent strategy follow for more
🚀 BTC/USD Today: Trade Setup for Quick Profits
Bitcoin is showing bullish momentum today, with strong support holding near $114,700 and upside targets projected around $116,500. Technical indicators like RSI and moving averages are flashing buy signals, suggesting short-term opportunities for traders.
📈 Key Highlights:
- Current Price Range: ~$108,000–$113,000
- Short-Term Bias: Bullish
- Support Zone: $114,700
- Target Zone: $116,500
- Indicators: RSI overbought, MA signals mostly bullish
💡 Traders are eyeing breakout patterns and momentum plays. If you're scalping or swing trading, this could be a prime window—just be sure to manage risk and use stop-loss strategies.

a strong sell for btcusdPrice is hitting a strong resistance zone. A lot of seller are coming in the market,plus Price is shooting down the a liquidity zone were a lot of buy are at

BTC - 150k? BUY?!📊 BTC/USD – Multi-Timeframe Outlook
🔎 Monthly (1M)
Bitcoin has broken out of a bullish wedge pattern and is now consolidating above previous breakout levels.
Long-term structure still favors upside continuation with a target towards 150K if momentum resumes.
Key structural support sits near 76K – 80K (prior breakout zone).
🕰 Weekly (1W)
Clear Elliott Wave count: Wave (3) peaked ~135K, now correcting into Wave (4).
Price retracing into a major support/demand zone around 105K – 110K.
The liquidity trendline from earlier cycles still holds, making this a critical inflection point.
Next move higher (Wave (5)) projects towards 135K – 150K.
⏱ Daily (1D)
Market is testing major support aligned with 0.618 retracement + demand/FVG zone.
Bullish reaction here could ignite the start of Wave (5).
If broken, deeper retracement into the psychological 100K handle may occur before continuation.
⏳ 8H
Short-term bearish momentum pushing into demand.
Liquidity building below, stops resting around 105K – 107K.
A bullish reaction from this zone would confirm Wave (4) completion and set up the impulse higher into Wave (5).
🎯 Trade Plan
Bias: Bullish from demand (Wave 4 → Wave 5)
Entry Zone: 105K – 110K demand region
Targets: 135K short-term, 150K long-term
Invalidation: Clean break & weekly close below 100K

BTCUSD 8/31/2025Come Tap Into the mind of SnipeGoat, as he gives you the smoothest & simplest Market Breakdown from a Full Top-Down perspective you've ever seen! Oh yeah... ANOTHER ONE!!!! SnipeGoat has called ANOTHER MAJOR MARKET MOVE! This is one you'll don't want to miss!
_SnipeGoat_
_TheeCandleReadingGURU_
#PriceAction #MarketStructure #TechnicalAnalysis #Bearish #Bullish #Bitcoin #Crypto #BTCUSD #Forex #NakedChartReader #ZEROindicators #PreciseLevels #ProperTiming #PerfectDirection #ScalpingTrader #IntradayTrader #DayTrader #SwingTrader #PositionalTrader #HighLevelTrader #MambaMentality #GodMode #UltraInstinct #TheeBibleStrategy

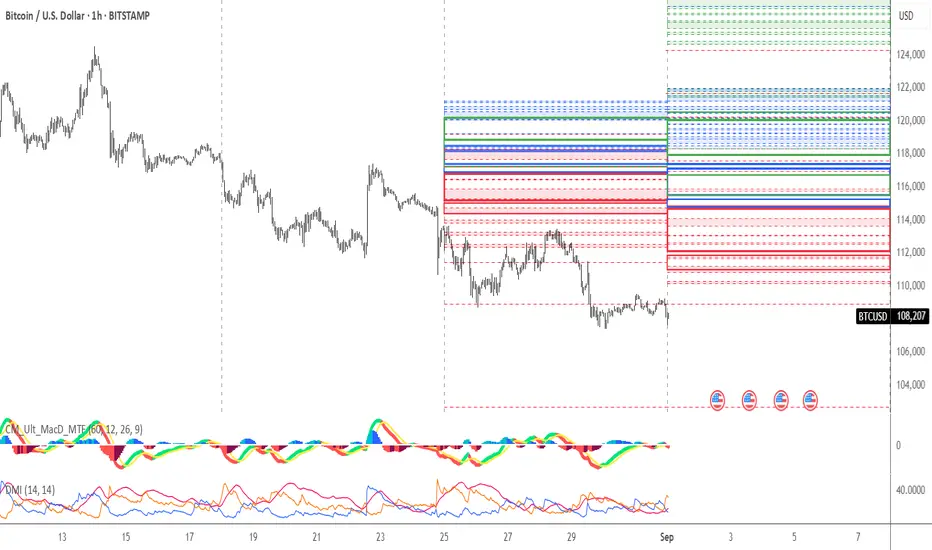
Key Levels for the Week 01-07/09/2025 ∷BitCoin∷🐍Key Levels Overview for the Week🐍
__________________________
BreakoutUpZone🐂117944🐂120077🐂
🏛115536🏛117344🏛
BreakoutDownZone🐻112122🐻114718🐻
__________________________
Upper Support-Resistance🔀
118308
120150
121424
121992
123998
124676
125230
125622
125963
126453
127433
127783
128167
128671
129288
129935
132173
Mids∷∷∷
115174
116748
117702
118329
118657
118905
119225
119481
119800
120115
120496
120733
121216
121514
121823
122195
126930
Lower Support-Resistance🔀
124308
121686
120261
118304
117595
116888
115718
115188
114623
113505
112907
112397
111533
110734
110027
108923
102673
BTC USD LONG RESULT Bitcoin is in an overall falling channel and when it touched the support of the channel and created a double bottom in 15MTF, I decided to long to a level above the resistance level (hoping for a breakout), but it rejected and respected the supply zone, from which I closed and still a good trade overall.
_THE_KLASSIC_TRADER_.💪🔥

btc buy setupBitcoin (BTCUSD) – Long Trade Setup
Currently, Bitcoin is trading around 108530, where I see a potential short-term bullish opportunity. The market has shown signs of upward momentum, and I expect the price to extend higher toward

BitcoinOver the past four weeks, Bitcoin first reached the 125k level before retreating. During the decline, it broke below local support at 112k, opening the way toward the next key level at 100k. The long-term trend remains upward, but a break below 100k would signal a potential reversal to the downside. In light of the above, we are shifting our outlook to neutral.
Long-term trend: No
Resistance level: 125000
Support level: 100000

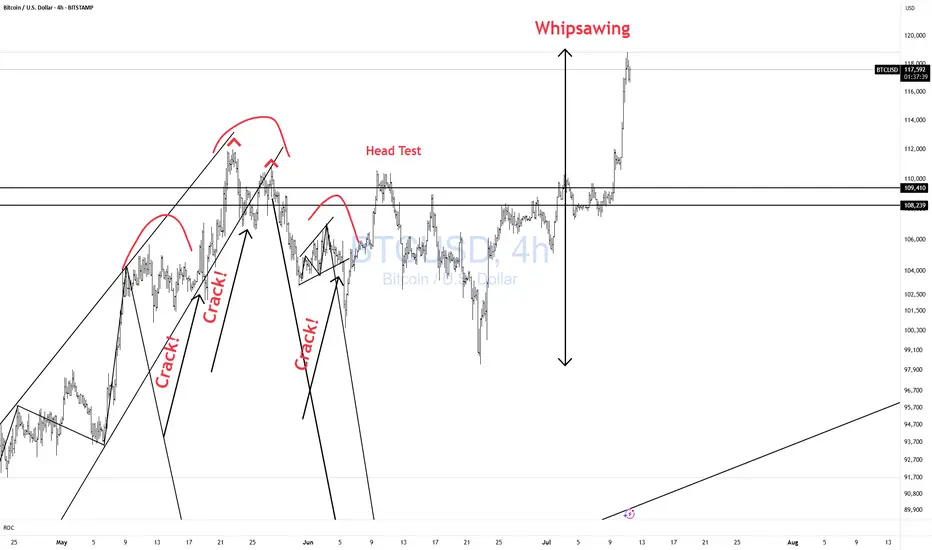
BTCUSD Whipsawing! CAUTION!Bulls CAUTION! Price is whipsawing all over the place.
Better to be out of the market wishing you were in than in wishing you were out!! Don't chase!!
BTC Elliot Wave Count - Current Bull CycleMy current primary count for this bull cycle. Key point is the first wave 2 retracement goes to the 0.618 which rules out with a high degree of certainty that it's a wave 4. Additionally to note, RSI on the monthly peaks in the 3 of 3.

BTC is trying to hold the 108kBTC long term is still bearish but short term is trying to hold the 108k
If it holds 108k we might see a small pump to 112-114k if it gets fomo even 118-124k
If it breaks below 108k then the next stop is at around 98k, so Definitively buy the 98k if it gets there.

BTCUSD Breakout Above Trendline – Bullish Continuation Setup🔹 Market Context
On the 15m timeframe, Bitcoin has decisively broken above the descending trendline that had previously acted as dynamic resistance with multiple rejections. This breakout occurred after the market created Equal Highs (EQH) and engineered liquidity above them, followed by a Break of Structure (BOS) and a confirmed Change of Character (CHoCH) to the upside.
The breakout not only invalidates the short-term bearish structure but also signals a possible shift in order flow, with buyers stepping in after liquidity collection.
⸻
🔹 Price Action Breakdown
• Liquidity Grab: The equal highs at ~$108,700–$108,900 were swept, clearing stop orders and creating fuel for a push higher.
• Trendline Break: The clean break and close above the descending trendline suggests weakening seller control.
• Retest Opportunity: Price may revisit the broken trendline or recent demand zone (~$108,700–$108,900) before continuing upward.
• Strong High in Play: The $110,500 zone represents the untested supply area and “strong high” that will likely attract price in the short term.
⸻
🔹 Trade Idea (Bullish Bias)
• Entry Zone: Retest of $108,700–$108,900 demand area
• Stop Loss: Below $108,250 (invalidates bullish structure)
• Take Profit Targets:
• TP1: $109,350 → first reaction level
• TP2: $109,750–$110,000 → psychological liquidity pool
• TP3: $110,500 → untested supply / strong high
⸻ CFI:BTCUSD
🔹 Invalidation
If BTC closes back below $108,250 with strong momentum, this would suggest a failed breakout and reopen short opportunities toward $107,500 and $107,200.
⸻
🔹 Bias Summary
• Primary Bias: Bullish continuation after breakout
• Key Zone to Hold: $108,700–$108,900
• Upside Targets: $109,350 → $110,500
• Invalidation Level: $108,250

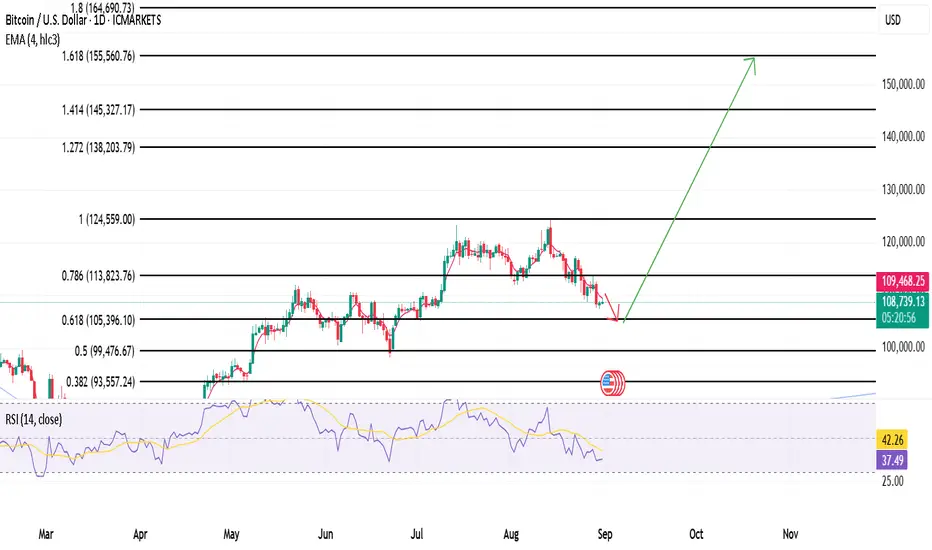
BTC correction is over in area 105k - Target 155kIn my view current BTC correction will find supoprt at 0.618 Fibonacci Level, around 105k area, where bullish trend will resume to complete the bullish cycle startede in 2020 after covid crash.
My final target is around 155k but I see a correlation between BTC and SPX cycle so assuming that my final target for SPX is around 7440 area and considering that usually BTC anticipates SPX inversions I'll close long position when SPX will be in 7300 area.
After bullish cycle completion I see a long term bear cycle starting for SPX and BTC in 2026.
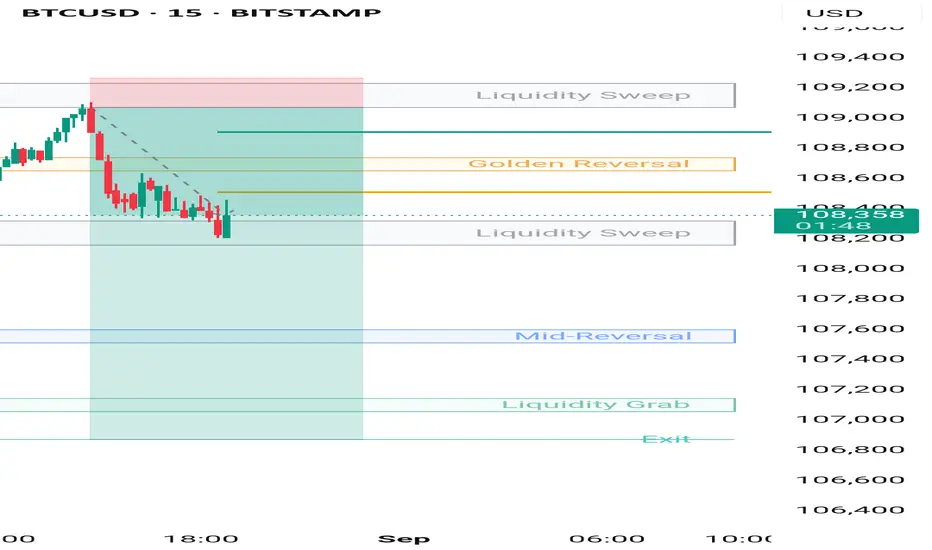
Bit coin target 1 doneBit coin sell extended target once price closes below liquidity sweep . We can see bearish moment continue till liquidity grab . Target 1 zone to zone done .. liquidity sweep to liquidity sweep.
BTCUSD: Next Move Is Up! Long!
My dear friends,
Today we will analyse BTCUSD together☺️
The recent price action suggests a shift in mid-term momentum. A break above the current local range around 108,364.93 will confirm the new direction upwards with the target being the next key level of 108,615.68. and a reconvened placement of a stop-loss beyond the range.
❤️Sending you lots of Love and Hugs❤️

End of the cycle and altcoin seasonI still believe BTC will have a final epic leg up before bear market really kicks in.
Overall market sentiment is pretty bad at the moment, which is not in line with a cycle top.
Altseason should be around the corner, and will probably be short lived.
Good luck to anyone who held until here.


BTC/USD Bullish Chart Pattern ......BTC/USD (Bitcoin) Bullish Setup 🚀
Bitcoin is building strong momentum after holding support and showing bullish continuation. Current market structure favors further upside from the 112,800 entry zone.
✅ Entry Point: 112,800 (Buy Zone)
🔑 Key Resistance / Target 1: 115,000 – First bullish objective where partial profits can be secured.
🛡 Major Resistance / Target 2: 117,500 – Main upside level, completion of the bullish wave.
📊 Trend: Bullish bias remains valid as long as price sustains above entry and continues pushing higher.
📈 Bullish Bias:
Above 112,800, buyers control the market. Breaking through 115,000 key resistance will unlock further strength, targeting the 117,500 major resistance zone.
---
✨ A clean bullish structure with step-by-step targets offers strong potential for secure profits.

Bitcoin to 125,000After 9 months of downtrend/sideways price action, bitcoin has finally broke out of this trend.
If we zoom out to weekly time frame, the 9 months of downtrend/sideways price action, serves as "handle" for "cup and handle" pattern which goes back to Nov 2021. Finally, after 3 years, this pattern is completed and bitcoin is set to get to it's next target which is ~125,000.
On it's way up, bitcoin will probably face some resistance at 100K, since people have been waiting for bitcoin to hit this price target from all the way back in 2019-2020. Moreover, 100K is Fibonacci famous 1.6 extension level, so we might see some sell off at this price. However, we believe that FOMO can break this resistance level with ease and bring up the price to 125,000 USD.
From this point, we probably see more sharp upward trend toward 155K and 200K but this is the danger zone where we might see sharp pullbacks to 100-125K range.

Bitcoin stabilizing last year's high so farBitcoin has reached last year's high and so far has proceeded no where but sideways. Will bulls or bears take charge from here?

BTCUSD Stock Chart Fibonacci Analysis 083025Trading Idea
1) Find a FIBO slingshot
2) Check FIBO 61.80% level
3) Entry Point > 108,860/61.80%
Chart time frame:B
A) 15 min(1W-3M)
B) 1 hr(3M-6M)
C) 4 hr(6M-1year)
D) 1 day(1-3years)
Stock progress:A
A) Keep rising over 61.80% resistance
B) 61.80% resistance
C) 61.80% support
D) Hit the bottom
E) Hit the top
Stocks rise as they rise from support and fall from resistance. Our goal is to find a low support point and enter. It can be referred to as buying at the pullback point. The pullback point can be found with a Fibonacci extension of 61.80%. This is a step to find entry level. 1) Find a triangle (Fibonacci Speed Fan Line) that connects the high (resistance) and low (support) points of the stock in progress, where it is continuously expressed as a Slingshot, 2) and create a Fibonacci extension level for the first rising wave from the start point of slingshot pattern.
When the current price goes over 61.80% level , that can be a good entry point, especially if the SMA 100 and 200 curves are gathered together at 61.80%, it is a very good entry point.
As a great help, tradingview provides these Fibonacci speed fan lines and extension levels with ease. So if you use the Fibonacci fan line, the extension level, and the SMA 100/200 curve well, you can find an entry point for the stock market. At least you have to enter at this low point to avoid trading failure, and if you are skilled at entering this low point, with fibonacci6180 technique, your reading skill to chart will be greatly improved.
If you want to do day trading, please set the time frame to 5 minutes or 15 minutes, and you will see many of the low point of rising stocks.
If you want to prefer long term range trading, you can set the time frame to 1 hr or 1 day
