BTC BOUNCESBitcoin rebounded strongly from the $108K–$109K demand zone yesterday but never came close to retesting the $112K resistance. That leaves the setup largely intact: $112K remains the ceiling that bulls need to reclaim, while $108K continues to act as the key floor. For now, price action is trapped between these two levels, with no clear momentum from either side. Until one of them gives way, expect rangebound trading.
BTCMINI trade ideas

False Breaks Feed True Hunts --- Btc go to 105500Bitcoin just “broke” a massive 4H trendline… but let’s be real — this break smells fake 🤡.
Liquidity was grabbed, emotions were played 🎭, and soon the market will crawl back under the line like nothing ever happened.
Target? 🩸 The liquidity pocket around 105,500 looks like the perfect trap door. Expect a sharp drop, not a gentle correction. ⚔️📉
And about the news? Who cares.
Let the headlines scream 📰🔥 — the wolf already knows where the herd will bleed. 🐑💉
Patience. Ruthlessness. Precision.
🐺 The wolf doesn’t chase the market — the market bends to the wolf. 🩸
#Bitcoin #BTC #BTCAnalysis #CryptoTrading #WolfTrading #MarketTrap #LiquidityHunt #FalseBreakout #BTCPriceAction #CryptoStrategy #SmartMoneyMoves #BearTrap #MarketPsychology #BTC105500 #WolfMindset #Btcusd #Btcusdt

BTCUSD -Bullish reversalBitcoin (BTC/USD) has reacted off the buy entry, which is a pullback support and could potentially rise to the upside.
Buy entry is at 108,972.79, which is a pullback support.
Stop loss is at 107,232.17, which is a multi-swing low support.
Take profit is at 113,313.88, which is a pullback resistance.

BTC 8H – Fib Golden Pocket Holding, Next Move Toward ATH?Bitcoin is consolidating above the ascending trendline support while retesting the Fib golden pocket (0.5–0.618 zone). The demand zone has provided a strong base, keeping price from breaking down into deeper retracement levels. If bulls maintain control above the 0.5 retrace at 111,536, upside continuation toward 123K resistance remains in play. A breakdown below 108,467 (0.618) would put 104K (0.786) back on the table.
This is a key decision area — continuation higher or a retrace to reload before new highs.

Bitcoin is nearing supportFirst, we touched the white Centerline twice.
The third attempt was a miss and triggered a Hagopian, which got filled in mid-August.
Already below the yellow Centerline, Bitcoin wasn’t able to climb back above it.
Now, price is near the L-MLH of both Forks, indicating that potential support lies just ahead. Let’s see if we can hold at the white L-MLH and find a long entry, which would hopefully shoot us back up to the Centerline (remember: there’s an 80% chance of reaching the Centerline).
Patience is key, so let’s relax, grab some popcorn, and watch this movie §8-)

Bitcoin All Time Highs Forecasted DateWas just working on a new study showing the number of months and days between prior ATH's for Bitcoin has typically been between 46-49 months or 1400 to 1492 days as shown in the Green boxes.
Based on the 2017 cycle, that puts this cycle ATH around November 1st 2025.
So we don't have much time if this cycle is going to play out like prior ones.
Also global liquidity is slowing down, and BTC is deviating from following M2 Money Supply.
However, the daily cycle low is signaling a local bottom is in here.
What do you think?

Did Bitcoin top in August 2025, sir? In short, no. At least, I don't think it has.
Expanding on that let's look at why:
- From a technical point of view:
The "Bitcoin tops" chart I'm sharing here shows how, in all the previous normal cycle tops, bitcoin has topped when the monthly RSI has reached a value of about 90. I'm including the word "normal" in front of cycle tops because I'm not considering the November 2021 as a normal cycle top. November 2021 was, in hindsight, a time when different forces had great influence on the price of Bitcoin a surely muted what the potential cycle top would have been (think of operation choke point 2.0, whatever went on with FTX, Terra Luna, etc). Monthly RSI is currently sitting at 68, not even in technically overbought territory. Similarly, the Stochastic RSI is also below technically overbought territory (80 in that case) and far from the overbought levels seen in previous cycle tops.
Similarly, the Relative Volatility Index and the Vortex Indicator are also far from the peaks seen in previous cycle tops.
The famous (or infamous) bitcoin power law, like it or hate it, continues to fit pretty well the monthly logarithmic chart. Yes yes I know, when you have a range going from ~44k to ~460k it's "easy" to be somewhere in the middle. We happen to be not "somewhere" in the middle but pretty much right in the middle (the middle of the power law being currently at 124k, which happens to also be the ATH at the time of writing). The power law corridor shows us there's significant upside left in price if we were to go higher from here.
From a macro economic pov (not included in the chart):
China is in an economic easing cycle. US is about to enter one with at least 2 rate cuts forecasted for the rest of 2025. The 2 biggest economies in the world are either easing or about to start easing monetary conditions.
Global M2 Money supply has been steadily growing since bottoming out in Autumn of 2022. Whilst this is not necessarily the best predictor of price, Bitcoin, like all other risk assets, thrives more in an environment where money supply is increasing.
From a market sentiment pov
The market sentiment towards Bitcoin is currently neutral and flirting with "Fear". Markets do not peak with neutral or fear sentiments among market participants. Markets peak with Greed or Extreme Greed and we are at the moment quite far from that.
Closing thoughts.
Bitcoin price is unlikely to have peaked in August 2025. That doesn't mean we can't go lower from here in the coming days and weeks. Based on current conditions it's quite likely we'll see further market correction. We could see more pain for the bulls with prices potentially visiting the $90k to $100k levels, where many different indicators are converging. But when all of that turbulence is over, we shall continue climbing.

SELL PROJECTION IN BTCUSD-H1 CHARTWe’re able to identify a sell opportunity in BTCUSD around the $112k level. We anticipate a sell off around that zone. Our target profit is at 109281.11
SELL CONSERVATIVELY!

BTC may get to $98,900 zone Apart from the fact that it is obvious to me that the daily Order Flow on BTC is bearish, I have highlighted 4 different good reasons why I personally will not be buying BTC for now.
A lot of BTC fanatics believe that BTC and cryptos in general are driven by Fundamentals, which is absolutely correct but my major challenge is that a lot of them are driven so much by emotions not Price Action.
I have been in this market for well over one and half decades and I can tell you that my technical knowledge, which has its strong Foundation on Market Structure & Price Action has seen me make so much money trading technicals.
Yes, when strong fundamentals such as US election results and other factors, including hypes and other unexpected events, come, they can change the direction and price can go crazy or either way.
This is where your risk management will then play a major role by saving you from unexpected losses or help you minimise your losses. However, do not ignore the importance of market structure and Price Action irrespective of the pairs or assets you trade.

bitcoin's Situation (daily) !!!The price is at the channel's bottom, and if it follows the previous Pump from bottom of thechannel pattern, the price could reach the channel's top.
Best regards CobraVanguard.💚

September 6, 2025: BTCUSDKey Levels
Resistance: The most immediate resistance is around $113,557, a level the price has failed to break above several times recently. A decisive break above this level could signal a potential move to the next resistance zone around $115,572. Beyond that, the long-term resistance and previous high is at $122,390.
Support: The key support level is the horizontal line at $107,550 and the ascending trendline. This is a crucial area; a break and close below this could indicate a significant bearish continuation, with the next major support level being a previous low around $103,257.
Potential Scenarios
Bullish Scenario: For a bullish reversal to be confirmed, the price would need to break above the immediate resistance at $113,557 and hold it as new support. This would invalidate the current bearish pattern and suggest a potential move toward the higher resistance levels.
Bearish Scenario: The path of least resistance appears to be to the downside. If the price fails to break the resistance at $113,557 and instead breaks below the ascending channel and the key support at $109,568, a more significant drop toward $108,555 would be the likely outcome.

Bitcoin at a crossroads: 105K or 113K nextThe trend of Bitcoin is undoubtedly bearish, but right now it’s in a kind of coma. If Bitcoin pushes up to 105 in the next couple of days, the downtrend can continue. However, if buying volume increases and it manages to consolidate around 113, there’s room to hope for a trend reversal. It seems Bitcoin might range here until the end of the week, waiting for the important news that’s coming.

Wedge anybody?Bitcoin’s recent price action on the daily chart is forming a clear **falling wedge pattern**, a technical structure often associated with bullish reversals. After breaking down from its summer uptrend, price has been consolidating within this narrowing channel, marked by descending trendlines and lower volatility, as evidenced by the declining volume throughout the wedge’s development. Key support levels around 106,741 and 104,753 are holding firm, while major resistance sits at the wedge’s upper boundary and above 109,478, setting the stage for a decisive move.
This wedge puts Bitcoin at a critical inflection point: a breakout above resistance would signal renewed bullish momentum and likely attract buyers looking for confirmation, while continued rejection could prolong the corrective phase. Traders should watch for increased volume and a daily close above the wedge line for a credible reversal signal, as the structure and recent price history favor an upside resolution heading into September.(Some help from Perplexity)

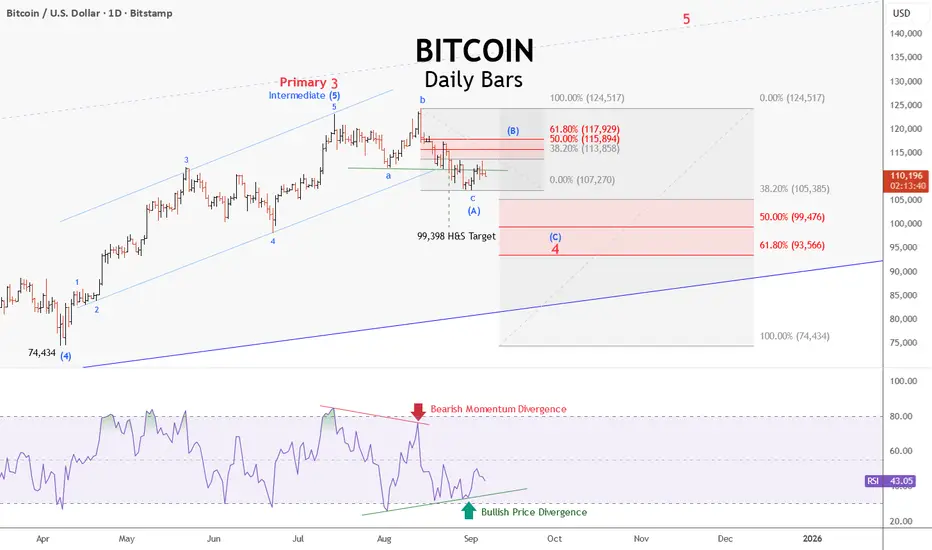
Is the Short-Term Decline in BITCOIN Over?Per the daily price action, the move off recent all-time highs appears corrective. The RSI is showing a bullish price divergence against the 107,720 print low, which may mark an (A) wave base at an intermediate degree.
If that low holds, a counter-trend bounce could rally the market back toward the .618 retracement near the 117,929 level to potentially mark the crest of the answering (B) wave.
The prospective target for wave (C) of primary 4 rests just beneath the 50% retracement of the entire advance from the 74,434 intermediate (4) wave base at the noted bearish Head and Shoulder price target of 99,398.
The most bearish prospect posits that the four-year cycle top is already in place at the 124,517 peak.
Downside Price Target:
As long as price action remains below the head and shoulder neckline, its downside price target will remain firm. The only way the 99,398 target gets taken off the table is if the market makes a fresh all-time high.
Should an imminent rally sustain daily closes above the .618 retracement level at 117,929, the likelihood of fresh new highs increases substantially.
NOTE: In contrast to longer timeframes, Elliott Wave counts at smaller degrees of trend are ambiguous at best, and regularly subject to change along with the price action.
Bullish structures forming in BTC, targeting 117K soon?On the H4 chart we have a double bottom at the 107.5K area with 2 higher highs and higher lows.
The downtrend trendline has also been broken with a decisive close on the H4 chart on 2nd Sept 2025.


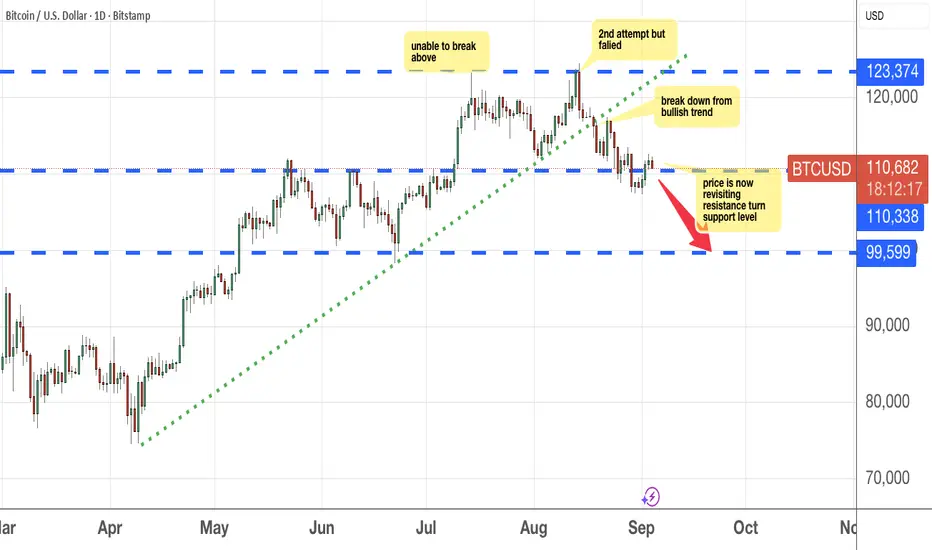
112k Bitcoin bullyBitcoin Price Stuck in Neutral – Levels to Watch Closely
Bitcoin price levels reactive right now. The Elliott Wave count isn’t giving me much confidence, and until we see a decisive move through key levels, I’m treating this as no-trade territory.
The level that stands out is 112k. This has been a major flip point for BTC, and it’s the bulls’ number to beat. A break with an impulsive push followed by a correction that holds above (or even right at it) would start to build a much more convincing bullish case. That would open the door for a potential long setup.
On the flip side, the current structure isn’t inspiring confidence. Price is showing lower lows and lower highs, a textbook downtrend, and every push is getting rejected off resistance. Until Bitcoin can reclaim levels it’s been losing, the bias leans bearish.
For now, it’s a waiting game. The market needs to pick a side, and until it does, sitting on the sidelines is the safest option.
Outlook:
112k break and correction = bullish setup
109k break and correction = bearish setup
Lower lows and lower highs = trend still bearish until proven otherwise

$BTC bounced to the 112K zone as expected, with even a shotCRYPTOCAP:BTC bounced to the 112K zone as expected, with even a shot at 115K possible, but I’m still holding my short from 116K. If we revisit my entry area, I’ll look to add more. For now, I’m staying in the trade and will share updates if anything changes. Targets remain 100K → 95K → 90K.


104k ? I feel Bitcoin is about to touch the $104,000 level to gain strength there and continue its upward move. This will likely cause other coins to dip a bit more, find a stronger floor for accumulation, and then follow the upward trend.

Role of Rating Agencies in Global Capital FlowsIntroduction
Global capital flows—the cross-border movement of financial resources in the form of equity, debt, and investments—are a critical element of the modern financial system. They connect savings from one part of the world to investment opportunities in another, enabling economic growth, diversification of risk, and efficient allocation of capital. However, capital flows are also influenced by perceptions of creditworthiness, risk, and trust in financial systems. This is where credit rating agencies (CRAs) play a decisive role.
Credit rating agencies such as Standard & Poor’s (S&P), Moody’s, and Fitch Ratings have become central arbiters in the global financial marketplace. Their ratings on sovereigns, corporations, and structured financial products serve as signals of risk that investors use when making cross-border investment decisions. From setting borrowing costs to influencing capital allocation, rating agencies have profound power in shaping the direction, volume, and cost of global capital flows.
This essay explores in detail the role of rating agencies in global capital flows, their mechanisms, benefits, criticisms, historical case studies, and the way forward in ensuring accountability and stability in global markets.
1. Understanding Credit Rating Agencies
1.1 Definition and Function
Credit rating agencies are private institutions that assess the creditworthiness of borrowers—whether sovereign governments, financial institutions, corporations, or structured products like mortgage-backed securities. A credit rating expresses the likelihood that the borrower will meet its financial obligations on time.
Investment-grade ratings (e.g., AAA, AA, A, BBB) suggest relatively low risk.
Speculative or junk ratings (BB, B, CCC, etc.) indicate higher risk.
1.2 Types of Ratings
Sovereign Ratings: Evaluate a country’s ability and willingness to repay debt.
Corporate Ratings: Assess credit quality of companies.
Structured Finance Ratings: Evaluate securities backed by assets (mortgages, loans, etc.).
1.3 Market Power of CRAs
Ratings are widely used because:
Institutional investors (pension funds, insurance companies, mutual funds) are often restricted by regulations to invest only in investment-grade securities.
Ratings influence risk premiums, spreads, and interest rates.
Global organizations like the IMF and World Bank rely on ratings for policy design and lending frameworks.
Thus, CRAs act as gatekeepers of global capital flows, determining which entities can access international markets and at what cost.
2. Role of Rating Agencies in Global Capital Flows
2.1 Facilitating Capital Allocation
In an interconnected financial system, investors require credible signals about where to allocate capital. Rating agencies reduce information asymmetry between borrowers and lenders by providing standardized risk assessments. For example:
A pension fund in Canada may consider investing in bonds issued by an infrastructure company in India. Without ratings, assessing risk across borders would be complex.
Ratings provide a benchmark for investors who may lack detailed knowledge about local markets.
2.2 Determining Borrowing Costs
Ratings directly impact interest rates.
A sovereign with an AAA rating can borrow internationally at very low interest rates.
Conversely, a country downgraded to “junk” status faces higher costs and reduced investor appetite.
Example: Greece’s sovereign debt crisis (2010–2012) showed how downgrades led to skyrocketing bond yields and loss of market access.
2.3 Shaping Sovereign Debt Markets
Sovereign ratings are crucial for emerging and developing economies seeking external financing. They:
Influence foreign direct investment (FDI) and portfolio inflows.
Affect perceptions of political stability and governance.
Serve as benchmarks for corporate borrowers in the same country.
If a sovereign rating is downgraded, often domestic corporations are automatically penalized since their creditworthiness is tied to the country’s risk profile.
2.4 Impact on Capital Market Development
Rating agencies encourage capital market deepening by:
Providing credible assessments that attract foreign investors.
Supporting development of local bond markets by setting credit benchmarks.
Enabling securitization and structured finance.
For example, Asian countries after the 1997–98 financial crisis used sovereign ratings to attract stable international capital for infrastructure financing.
2.5 Acting as “Gatekeepers” in Global Finance
Because many regulatory frameworks link investment eligibility to ratings, CRAs effectively decide who can tap global pools of capital.
A downgrade below investment grade can trigger forced selling by institutional investors.
Upgrades attract capital inflows by expanding the base of eligible investors.
Thus, they not only influence prices but also capital mobility across borders.
3. Case Studies on Ratings and Capital Flows
3.1 Asian Financial Crisis (1997–98)
Before the crisis, CRAs maintained relatively favorable ratings for Asian economies despite growing imbalances. When the crisis erupted, they issued sharp downgrades, accelerating capital flight.
Criticism: Ratings were lagging indicators rather than predictors.
Impact: Countries like Thailand, Indonesia, and South Korea saw capital outflows magnified by sudden rating downgrades.
3.2 Argentina Debt Crisis (2001 & 2018)
Argentina’s sovereign debt rating was repeatedly downgraded during its fiscal crisis, pushing borrowing costs higher.
Investors pulled out en masse after downgrades to junk status.
Access to international markets dried up, forcing defaults.
3.3 Eurozone Debt Crisis (2010–2012)
Countries like Greece, Portugal, and Ireland experienced downgrades that worsened their debt sustainability.
Rating actions led to a self-fulfilling prophecy: downgrades → higher borrowing costs → deeper fiscal distress.
EU regulators accused CRAs of procyclicality, meaning they intensified crises instead of stabilizing markets.
3.4 Subprime Mortgage Crisis (2007–2008)
CRAs assigned high ratings to mortgage-backed securities (MBS) that later collapsed.
Resulted in massive misallocation of global capital.
Global investors trusted AAA-rated securities that were actually risky.
This highlighted the conflict of interest in the “issuer-pays” model, where companies pay for their own ratings.
4. Benefits of Rating Agencies in Capital Flows
Reduce Information Asymmetry: Provide standardized, comparable measures of risk.
Enable Cross-Border Investment: Facilitate capital flows by offering risk assessments across jurisdictions.
Support Market Liquidity: Ratings enhance tradability of securities by offering confidence to investors.
Encourage Market Discipline: Poor governance or weak policies may be punished with downgrades, pressuring governments to maintain sound macroeconomic frameworks.
Benchmarking Role: Provide reference points for pricing bonds, derivatives, and risk models.
5. Criticisms and Challenges
5.1 Procyclicality
CRAs often amplify financial cycles.
During booms, they assign excessively high ratings, encouraging inflows.
During downturns, they downgrade abruptly, worsening outflows.
5.2 Conflicts of Interest
The issuer-pays model creates bias: issuers pay CRAs for ratings, leading to inflated assessments.
5.3 Over-Reliance by Regulators
International financial regulations (e.g., Basel Accords) embed credit ratings into capital requirements. This gives CRAs outsized influence and encourages investors to rely uncritically on ratings.
5.4 Lack of Transparency
Methodologies are often opaque, making it difficult to understand rating decisions.
5.5 Geopolitical Bias
Emerging economies often argue that rating agencies, largely based in the US and Europe, display Western bias, leading to harsher ratings compared to developed economies with similar fundamentals.
5.6 Systemic Risks
Errors in ratings can misallocate trillions of dollars in global capital. The 2008 crisis is the most striking example.
6. Regulatory Reforms and Alternatives
6.1 Post-2008 Reforms
Dodd-Frank Act (US): Reduced regulatory reliance on ratings.
European Union: Increased supervision of CRAs via the European Securities and Markets Authority (ESMA).
IOSCO Principles: Set global standards for transparency, governance, and accountability.
6.2 Calls for Diversification
Development of regional rating agencies (e.g., China’s Dagong Global).
Use of market-based indicators (bond spreads, CDS prices) as complements to ratings.
Encouraging investor due diligence instead of blind reliance.
6.3 Technological Alternatives
Use of big data analytics and AI-driven credit assessment.
Decentralized financial platforms may reduce reliance on centralized CRAs.
7. The Way Forward
Balanced Role: CRAs should provide guidance without becoming the sole determinants of capital flows.
Greater Accountability: Legal and regulatory frameworks must hold rating agencies responsible for negligence or misconduct.
Enhanced Transparency: Methodologies and assumptions should be disclosed to prevent opaque judgments.
Diversification of Voices: Regional agencies and independent research firms should complement dominant players.
Investor Education: Encouraging critical evaluation rather than over-reliance on ratings.
Conclusion
Credit rating agencies hold immense power over global capital flows. Their assessments determine borrowing costs, investor confidence, and even the economic destiny of nations. On the positive side, they reduce information asymmetry, facilitate cross-border investment, and provide benchmarks for global markets. On the negative side, their procyclicality, conflicts of interest, and opaque methodologies have at times worsened financial crises and distorted capital allocation.
The history of financial crises from Asia in 1997 to the subprime meltdown in 2008 illustrates both the necessity and the dangers of CRAs. While reforms have sought to improve accountability and transparency, the global financial system remains deeply influenced by their ratings.
The way forward lies in diversification of risk assessment mechanisms, greater transparency, and reduced regulatory over-reliance on CRAs. In doing so, global capital flows can be guided more efficiently, fairly, and sustainably, ensuring that they support economic growth rather than exacerbate instability.

Expecting Bitcoin to revisit 100,000 level again.........if price does stay above the 110K price level and shows more bullish moves in the next few days/week (before Sept 16 - Fed's meeting) then I would expect the price to head south and revisit the 100k mark once more.
There, I would be more keen to accumulate......so patient.... patient......patient........
Possibility of uptrend It is expected that a trend change will take place within the current support area and we will witness the start of an upward trend. If the price breaks through the red support area, a continuation of the correction and downward trend will be likely.
