My BTC target for this pumpBTC broke out of the monthly inverse head and shoulders. Target is the height if the head which is around 125k. Let me know what you think!
BTCMINI trade ideas

BTC: Rebound Imminent, Go LongBTC today broke below 115000, then rebounded right away 📉→📈. The rebound will keep going and retest 120000—now’s a solid chance to go long! 🚀
⚡️⚡️⚡️ BTCUSD ⚡️⚡️⚡️
🚀 Buy@ 115000 - 115500
🚀 TP 117000 - 118000 - 119000
Daily updates bring you precise trading signals 📊 When you hit a snag in trading, these signals stand as your trustworthy compass 🧭 Don’t hesitate to take a look—sincerely hoping they’ll be a huge help to you 🌟 👇

BTCUSD AnalysisAs you can see... Bitcoin is looking for some liquidity... a bit manipulated but still following its casual cycle <3.

BTCUSD Intraday Analysis 19 Aug 2025BTCUSD is currently consolidating near 115,000–115,500 after rejecting lower support around 114,500–114,700. The descending trendline has capped upside attempts, but structure is showing signs of accumulation.
A confirmed breakout above 115,500 and successful retest would signal continuation, opening the way toward the 118,000 supply zone.
As long as price holds above 114,500 support, the bullish outlook remains intact. A breakdown below this zone would invalidate the structure and expose 113,800–114,000 levels.
Buy on breakout and retest above 115,500, target 118,000, stop-loss 114,800.
Stay neutral if price remains between 114,500–115,500.

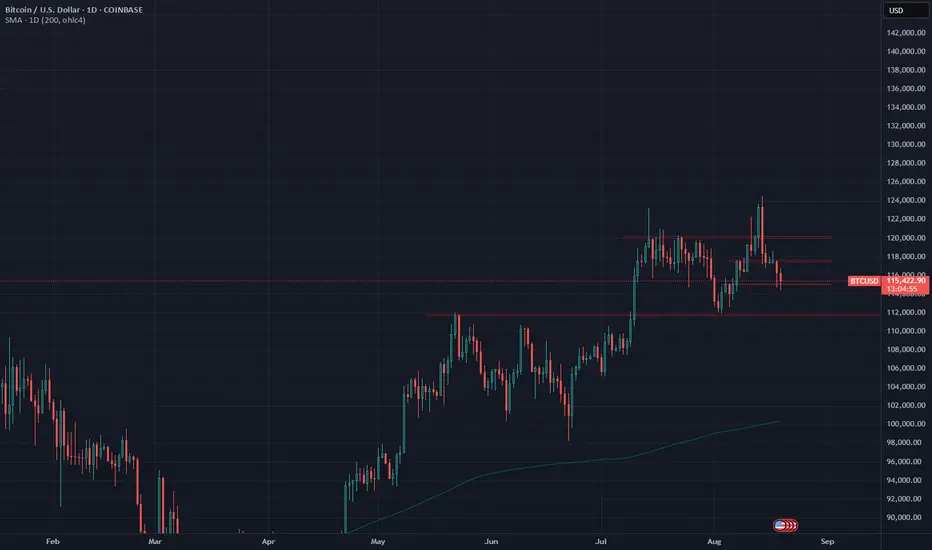
BTC, should we be worried?Despite the calls for a double topping pattern, Bitcoin is yet to enter the territory of worry.
For the time being, support can be expected from as low as $112k. However, potentially signaling a short-term recovery, BTC is testing $115k as support - previous resistance.
Continued short-term weakness could lead to a test of $112k, effectively creating a range with $120k as resistance.
Bitcoin's slow upward grinding could be a reflection of the shift in the market and its players.
Bitcoin Has BULLISH DIVERGENCEBitcoin is showing bullish divergence coming out of oversold RSI on the 4-hour chart. As you know, this is my favorite signal. That said, I want to see a clearer “elbow up” on RSI to confirm.
Remember, there was a bearish divergence with overbought RSI at the recent top… as usual.

THE CRASH OF BITCOIN? IS AUGUST 2025 THE PEAK OF THE SURGE?This Bitcoin monthly chart (BTC/USD, Coinbase) highlights a potential market crash scenario following its parabolic rise. Price action has reached the upper boundary of a long-term ascending channel, with resistance forming near the $124,000 – $130,000 zone (yellow box). This area marks a significant supply zone where sellers are expected to dominate.
The chart indicates a possible rejection at this level, with downside targets identified by major support zones:
First support near $109,400, the midpoint line of the trend.
A deeper retracement towards $73,952, a strong historical support zone that aligns with prior consolidation.
In a more severe crash, Bitcoin could revisit the $38,793 level, representing the base of the long-term structure.
The large risk-reward box drawn suggests traders are bracing for a substantial correction if resistance holds. This aligns with the cyclical nature of Bitcoin’s price history, where sharp rallies are often followed by deep retracements.
Overall, the chart warns of a looming Bitcoin crash from its peak levels, where failure to break above $130K could trigger a multi-year bearish phase, with losses extending as much as 70% from the highs.
Disclaimer: This analysis is for educational and informational purposes only and does not constitute financial advice. Trading and investing in cryptocurrencies involve significant risk, and you should conduct your own research or consult a licensed financial advisor before making any decisions.

BTCUSDT SHORT SETUPBitcoin H4 TF Trade Mapping Update
Selling Now On Fair Value Gap Price 115.400
Next Zone Selling CISD PRICE 117.00
Next Selling BTC Zone Order Block 118.00 / 119,300
Manage Trades Properly And Follow For More Charts And Trades

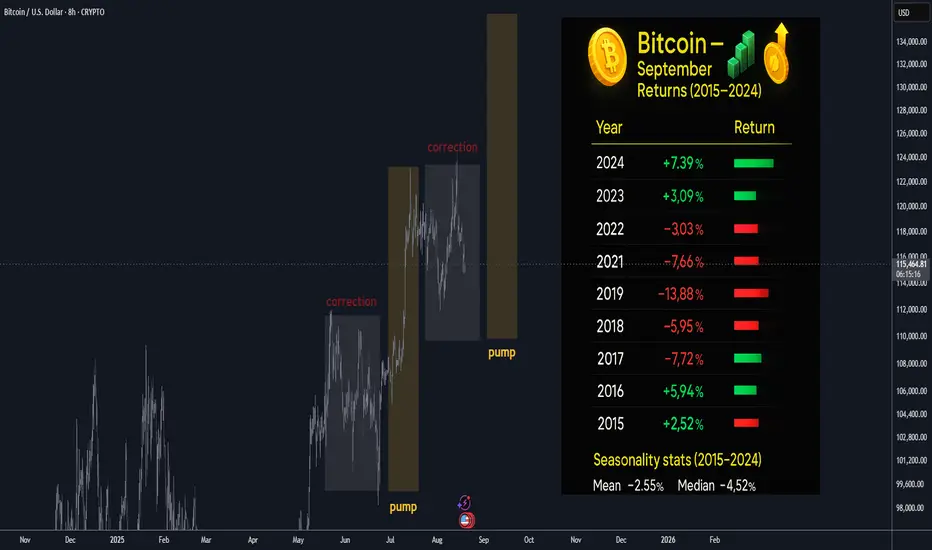
Bitcoin September Seasonality: Correction in progress 100/110K Bitcoin is heading into September after recently printing a new ATH,
historically September is a red month, so expecting further mild losses
heading into September and limited upside, however, once the pattern
and correction is complete, we should see another bull run and mark up.
📊 Bitcoin September Seasonality (Last 10 Years: 2015–2024)
Yearly September Returns
Year 📈 Return
2024 🟢 +7.39%
2023 🟢 +3.99%
2022 🔴 −3.09%
2021 🔴 −7.03%
2020 🔴 −7.66%
2019 🔴 −13.88%
2018 🔴 −5.95%
2017 🔴 −7.72%
2016 🟢 +5.94%
2015 🟢 +2.52%
📌 At-a-glance stats (2015–2024)
📉 Mean (10-yr): −2.55%
⚖️ Median: −4.52%
🔴 Red months: 6 out of 10
❌ Worst September: 2019 (−13.88%)
✅ Best September: 2024 (+7.39%)
📅 Recent Performance (last 3 years)
2024: 🟢 +7.39% → Strongest September in a decade
2023: 🟢 +3.99% → Rare green month, breaking the red-seasonality myth
2022: 🔴 −3.09% → Modest dip during a bearish macro cycle
➡️ Average of last 3 years: 🟢 +2.8%
➡️ Average of last 5 years (2020–2024): 🔴 −1.3%
🔎 Key Insights
September Slump : Historically, September is known as a "red month" for Bitcoin, often averaging −4% to −6% declines. Over the last decade, the median return (−4.5%) aligns with this bearish narrative.
Volatility Factor: The spread between best (+7.39% in 2024) and worst (−13.88% in 2019) September is 21 percentage points, underlining Bitcoin’s volatility even within seasonal patterns.
Changing Trend? The last two years (2023 & 2024) both closed green — suggesting the September slump might be losing strength in the current cycle.
🚀 Macro & Market Context
2019–2020: Heavy red Septembers coincided with global macro uncertainty (trade wars, COVID jitters).
2021: Correction phase post-$64k BTC ATH saw September hit −7%.
2022: Ongoing bear market after Terra/LUNA & 3AC collapses kept September negative.
2023–2024: Renewed momentum, institutional inflows, and ETF speculation helped reverse September’s red streak.
🧭 Takeaway
While September has historically been Bitcoin’s weakest month, the last two years show signs of reversal. The broader trend reminds us that seasonality is a tendency, not a guarantee — macro cycles and catalysts often override calendar effects.
Do you think I'm joking ???As I said, Bitcoin broke the triangle, and now with a slight price correction(109k), it could surge to $150k , and you still think I'm joking!!
Previous analysis

▒₿▒ BITCOIN FORECAST | 6HR ▒₿▒COINBASE:BTCUSD
[ [ ]]
In my last analysis on July 25th, I laid out a bullish forecast targeting the $150K level, based on a fractal pattern that had been tracking well. However, the market has reached a critical divergent point. The recent price action, particularly the confirmation of major weekly bearish signals, requires us to reassess and adapt. As of today, the bullish case has been invalidated, and the inverse bearish fractal is now the primary scenario.
What Changed? The Confluence of Bearish Signals
Several major warning signs have now been confirmed, forcing this change in outlook:
The Double Shooting Stars: As noted on August 14th, two powerful Shooting Star candles appeared on the weekly chart. This was the first major indicator of a potential top. We needed a strong weekly close to invalidate this pattern, and we got the opposite.
Break of Major Trend Support: The price has now broken a major ascending trendline on the daily chart, a clear signal that sellers have taken control of the short-to-medium term trend.
The Fractal Inversion: The price action began to diverge from our bullish fractal and started to perfectly mirror an inverted, bearish version of the same pattern.
The New Forecast: Following the Bearish Fractal
The image above shows the original bullish fractal (in teal) and the now-active inverted fractal (in pink). The breakdown of the daily trendline was the trigger, and this fractal now provides a potential roadmap for the correction that is underway.
This isn't just a pattern; it's a visual representation of the path of least resistance, which is now clearly to the downside.
Key Levels to Watch
This fractal path aligns perfectly with the key technical levels we must now watch. These are the battlegrounds that will define this correction:
Established Resistance: ~$124,000. This is now the confirmed peak. The bears are in full control as long as we remain below this level.
Initial Warning Sign (Triggered): A close below $111,000. We have already breached this level, confirming the initial phase of the downtrend. The likelihood of this being a simple correction, rather than the start of a bear market, drops significantly with every day we spend below it.
Full Bear Market Confirmation: A decisive weekly close below $104,000. This remains the most critical level. According to the analysis, if we break below the $104k-$100k zone, there is an
80% likelihood that we are in a Bear Market and that the ~$124k high was the final top for this bull run.
Conclusion
The bullish forecast has been invalidated by a confluence of powerful, high-timeframe bearish signals. The market is now following a bearish inverted fractal, which aligns with our key technical levels.
The primary expectation is that this correction will continue, with the $104,000 support zone being the next logical destination. Stay safe and manage your risk accordingly.
This is not financial advice (NFA). This is for educational purposes only. Always do your own research (DYOR).
DISCLAIMER
I AM NOT A FINACIAL ADVISOR, NOR AM I YOURS. THIS IS NOT FINANCIAL ADVICE. MEARLY DOODLINGS ON A MATHMATICALLY DRIVEN GRAPHICAL INTERFACE, TRACKING AN INVISIBLE 256BIT MILITARY-GRADE ENCRYPTED ASSET. . . FOR ENTERTAINMENT/AMUSEMENT PUROSES ONLY. ENJOY!


Technical analysis on BitcoinA simple technical analysis always works better for me, my favorite tools are the trendline and Fibonacci tape measure. With the tools I can try to imagine an Elliot wave. I have measured a possible next legg up for bitcoin at a area of confluence as illustrated in the drawing. The RSI is also oversold and showing a bullish divergence. The Fibonacci levels should act as decent supports.

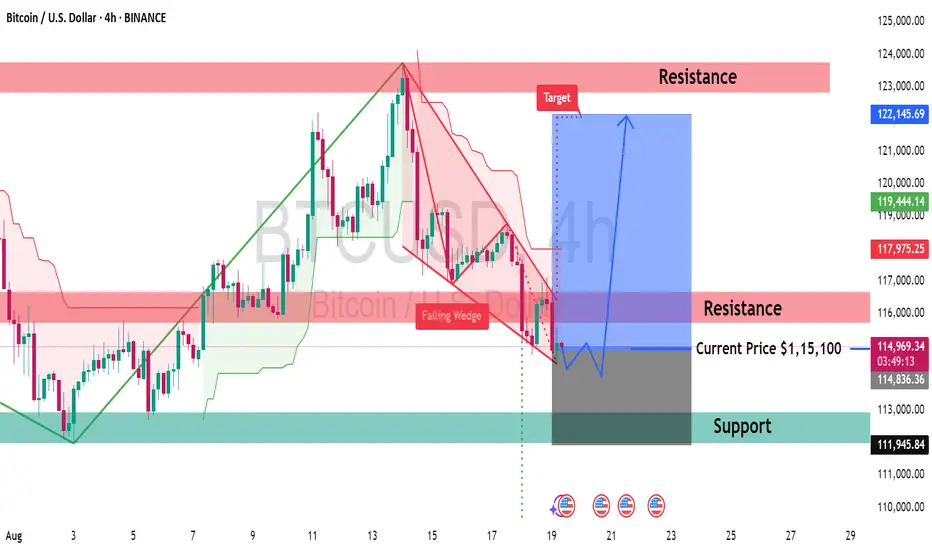
Bitcoin (BTC/USDT) – 4H Chart Analysis📊 Technical Trend & Pattern
Bitcoin is currently trading around $115,100, consolidating within a falling wedge pattern, which is typically a bullish reversal setup. Price has tested the lower support zone near $111,945 and is now attempting a breakout to the upside.
🔎 Key Levels
Support: $111,945 – $113,000 zone
Immediate Resistance: $116,000
Major Resistance Zone: $122,000 – $123,000
Target (upon breakout): $122,145+
⚡ Fundamental Outlook
Market sentiment remains cautiously optimistic, with investors watching macroeconomic data and institutional flows. A confirmed breakout above resistance could trigger renewed bullish momentum toward the $122K zone.
📈 Trading Idea
As per the falling wedge breakout setup, Bitcoin has the potential to move higher if price sustains above $115K. A rejection from resistance could push it back toward support before another breakout attempt.
👍 Like this analysis & 🔔 Follow me for more trading updates and ideas.
💬 What’s your view? Drop your comments and ideas below!
Btcusd Btcusd we hv price on a down trend on the weekly and daily chat so we are expecting a retracment back to the zone then we sell

Time to resume uptrend till 147k Bitcoin completed its 4th wave ABC correction at 14.9xx and will behin uptrend to reach 134k and 147k by mid-Nov.

Bitcoin Short: Either Wave 2 of 5 or in Cycle Wave CorrectionBitcoin had completed a 5-wave structure and peaked very near to our previous target of $124,000 (see linked idea on 2nd Aug). Currently it has corrected more than $8000 from the peak. We are either in a Sub-Wave 2 of Cycle Wave 5 or in a Cycle level correction (A-B-C). Regardless, the direction is still down, just the target is different.
For Sub-wave 2, the target is $98,400.
For Cycle Wave correction, the target is $74,400.
At this moment, we do not need to decide on which degree of Wave we are in. We can review again when Bitcoin price nears $98,400 and study the wave structure then.
I discussed on where to set the stop loss if you are shorting bitcoin. There are 3 different levels, but remember that only a breach of the peak will invalidate this idea.
Good luck!

Bitcoin – Updated ScenarioBitcoin – Updated Scenario
BTC followed the expected move by retesting the 117,000 zone before turning lower, but the price action has not developed in line with the anticipated ABC correction under Elliott Wave theory. At present, price is showing signs of slipping below the 114,700 support, suggesting that the correction may not have ended at the wave 5 low as previously expected.
According to Dow Theory, this decline could extend towards the 113,000 area before the market attempts a stronger rebound. A descending channel has now formed, and price is reacting well to the upper trendlines, reflecting that short pressure remains dominant.
In this context, favouring short positions in line with the prevailing trend may improve the probability of success. The next target sits around 110,000 – an area where multiple levels of strong resistance converge across higher timeframes.
Short-term traders can take advantage of pullbacks towards the descending trendline to look for entries in the direction of the main move. Managing risk effectively is key here, and it is important to avoid rushing into longs while the corrective leg remains in play.
Downtrends often last longer than expected, but once selling pressure is exhausted, the recovery can be sharp. Patience and discipline are crucial in waiting for the right timing rather than going against the main flow.
#BTCUSD #Bitcoin #CryptoAnalysis #TechnicalAnalysis #PriceAction #ElliottWave #MACD #CryptoTrading #UKTrading #SwingTrading

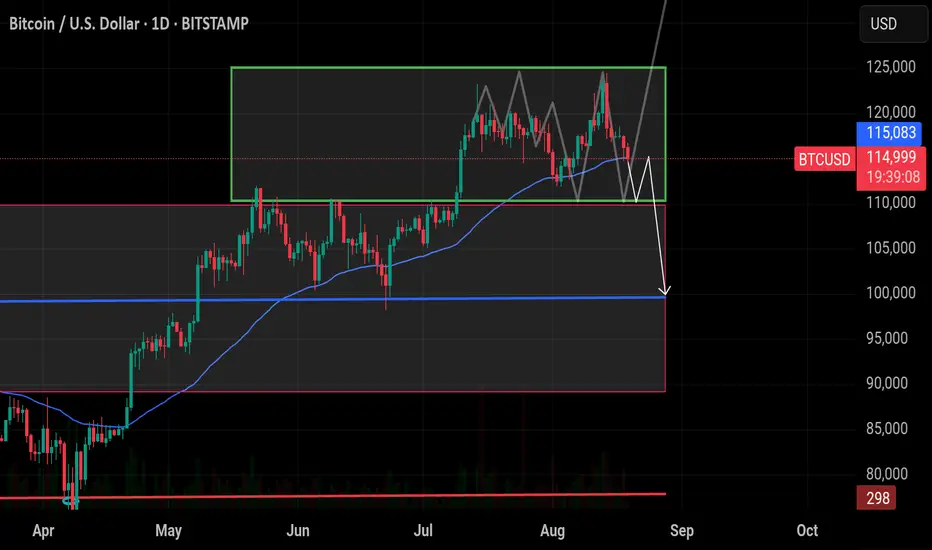
#Bitcoin Weakness Alert: $BTC is showing weakness as it struggle#Bitcoin Weakness Alert:
CRYPTOCAP:BTC is showing weakness as it struggles around the 115K (50 EMA) level.
🔸 Key Support:
If BTC loses the 115K support and resists below the 50 EMA, downside pressure increases. The next critical level is 110K.
🔸 Upside Target:
Holding above 115K with strength can trigger a move back toward 120K and possibly extend to 125K.
🔸 Risk Level :
A confirmed break below 110K will likely open the path for a dump toward 100K.🚨
🔸 Outlook:
Monitor 115K closely. If price holds above, upside continuation is possible. If broken, expect a deeper correction with 110K as the last major support before 100K.
BTCUSD – Daily Technical & Fundamental AnalysisBTCUSD – 4hr Technical & Fundamental Analysis
Bitcoin recently declined by 2–4% after hitting a new all-time high near $124,000, as investors secured profits. Options data show traders heavily accumulating puts, signaling expectations of a 20%+ correction in the short term.
From a technical perspective, BTC formed a new all-time high at 123,600, then failed to sustain momentum, creating a change of character (ChoCH) by forming lower lows. Price has since moved toward the major key support zone at 115,800. This indicates heavy accumulation of sell orders before potential liquidity grabs.
Currently, BTC is pushing further to the downside. While the initial move is already extended, we remain cautious for a possible retest at our key point of interest (POI).
Sell Entry: 115,695.40
Stop Loss: 117,096.20
Take Profit: 112,869.30
📌 Disclaimer: This is not financial advice. Always wait for proper confirmation before executing trades. Manage risk wisely and trade what you see—not what you feel.

19/8 4H Breakout vs 1D Pressure – Key Levels to WatchOn 19/8, a valid 4H breakout has formed. However, the 1D chart has not shown any clear directional bias yet. For TP1, it is safer to follow the 1D conservative outlook, though aiming for a higher TP1 can also be considered.
On the 1D timeframe, the prevailing pressure remains bearish, so overall short bias is preferred.
For 20/9, the key considerations based on the 1D close of 19/8 are:
A. If the daily close is above 3344, a long setup can be considered.
B. If the daily close is below 3327, a short setup is favored.
C. If the daily close falls between 3344 and 3327, market remains range-bound, leaning bearish.
Reasonable sell entry zones: 3343 – 3349
Stop loss level: 3360
Short-term buy scalps may be taken within 3350 – 3327 range.


#Bitcoin Double Bearish Divergence!Using the ChartPrime Oscillator Pro, a double bearish divergence has formed on the weekly timeframe, which could play out between Sept. and Nov.
Medium term, the price could retest the $90K level, which aligns with a major support trendline.
