Btc / UsdtBITSTAMP:BTCUSD
Next Support Zone is 109k / 110k Soon.
Alts gonna bleed..
Disclaimer : Not Financial Advice.
BTCMINI trade ideas

Is Bitcoin accumulating strength for an upward move or peaking? Bitcoin rebounded after hitting the minor support of the rising channel. The recent pattern is still in the stage of oscillation and accumulation, with the price running between the strong support level of 113200 and the strong resistance level of 116784. The bullish arrangement of the moving average and the engulfing pattern form a strong bullish resonance. The lows are also gradually rising, so this rebound is not over. Friends who opened long orders can continue to hold, with targets at 116784-118000-121000.


bitcoin short setup ! BTC took final liquidity !CRYPTOCAP:BTC took last liquidity around 117.8 a close blow last 1hr FVG and i will looking for short other wise it can jut make higher higher for rest of week ! will make update if another setup shows up

Bitcoin Cycle Analysis – The Fourth TurningThe dominant cycle identified here is ~292 bars, which has consistently marked major pivots in Bitcoin’s price action. Each cycle builds in intensity, and according to fractal theory, the fourth turning often delivers the most severe correction.
At present, BTC is pressing against the upper bounds of this dominant cycle. If the cycle roadmap continues to hold, we are now in the early stages of the declining phase, with downside risk extending into the mid-to-lower support zones.
Key Insight:
In fractal cycle analysis, the fourth turning is often the most devastating one. If this pattern repeats, the coming downswing could be sharper and deeper than previous declines, preparing the ground for the next major cycle low.
Caution is warranted as both fractal and cycle models are flashing warnings that this market may be in the process of topping out.

BTCUSD 4H – Swing Trade SetupBTCUSD is respecting its bullish structure, holding above the 114,000 support zone. Price is consolidating near 115,000, while the 116,000 level acts as the nearest resistance. If buyers maintain control above support, the structure favors continuation toward 118,000 in line with the broader trend.
Key Levels:
Buy Area: 115k
First TP: 116k
2nd TP: 117k
Target: 118k
Reasoning:
The trend shows higher lows with EMA/Alligator support, signaling momentum remains bullish. Consolidation near resistance suggests accumulation, and a push through 116,000 opens room toward 118,000.
Disclaimer: Educational purpose only. Not financial advice.

Bitcoin, Ethereum Breakout: 401(k) funds & the next "Altseason"Bitcoin is up 10% in August, driven by strong ETF inflows and a game-changing executive order allowing 401(k) retirement funds to invest in cryptocurrencies, potentially bringing trillions of dollars into the sector.
Technically, Bitcoin and Ethereum are breaking out toward multi-year highs, with BTC leading and ETH close behind—setting the stage for a possible "altseason" if these levels hold and capital rotates into altcoins.
This content is not directed to residents of the EU or UK. Any opinions, news, research, analyses, prices or other information contained on this website is provided as general market commentary and does not constitute investment advice. ThinkMarkets will not accept liability for any loss or damage including, without limitation, to any loss of profit which may arise directly or indirectly from use of or reliance on such information.

sell signal for BTC4 hour RSI breakout to the downside, based on rsi indicator it looks like chart trendline is gonna be broken

Today's BTCUSD Market AnalysisBTCUSD has shown little overall change compared to yesterday, with the broader market structure remaining intact. The support level remains firm, while esistance level continues to be concentrated in the 117,000–118,000
Buy 114500-115000
TP 115500-116500-117500
Daily-updated accurate signals are at your disposal. If you run into any problems while trading, these signals serve as a reliable reference—don’t hesitate to use them! I truly hope they bring you significant assistance

Daily Market Analysis of BTCUSDFrom the observation of price movements, recently, after a wave of rise, BTCUSD has experienced short-term pullback, but the overall bullish structure remains intact. During the pullback, the support below was effective, and then the price rose again.
For upper resistance, the focus remains on the 117,000–118,000 USD range.
Buy 114500-115000
TP 115500-116500-117500
Daily-updated accurate signals are at your disposal. If you run into any problems while trading, these signals serve as a reliable reference—don’t hesitate to use them! I truly hope they bring you significant assistance

BTCUSDBTCUSD needs some correction for the next few days before any upside.
Disclosure: We are part of Trade Nation's Influencer program and receive a monthly fee for using their TradingView charts in our analysis.

Expanding TriangleThe price makes a false breakout followed by a sharp pullback, only for buyers to push the price higher, now the price has broken out followed by a small pullback and now it looks to make a higher high and go long
WE ONLY TRADE PULLBACKS
Comment your thoughts

Straight to the pointTaking a long on BTC we got a break of that daily & 4 hour structure aiming for 120
Blah blah what do I know

Fed rate cut in focus: Bitcoin eyes new ATHFed rate cut in focus: Bitcoin eyes new ATH
Markets are on edge ahead of today’s Fed decision, with a 25 bps cut to 4.1% widely expected. Traders see this as fuel for risk assets, though surprises could trigger sharp moves. Bitcoin leads the pack, backed by $230M ETF inflows and growing dominance over alts. Still, strong sell walls at $117K–119K signal heavy resistance.
Support remains firm at $111K–113K, where fresh demand continues to absorb supply from large holders. Momentum indicators show strength, similar to Q2 when BTC rallied from $105K to $120K.
Altcoins stay in the background: ETH faces outflows and struggles to hold above $4,500, while SEC delays on new ETF applications weigh on sentiment. Other majors like Solana and Ripple could see inflows if BTC stabilizes, but downside risks remain high if expectations disappoint.

BTC vs fed rate :0Taking the buy above the open of the week for bitcoin. Hopefully “To Late Powell” doesn’t pull the rug and we see a juicy pump up to 120,000
With all my experience (lol) I know that when the news drop the market will probably pump dump and then continue to the upside so be ready for that.
But hey….. what do I know?

BTCUSD - Long 137,000BTC is expected to hit the levels of 137,000.
The Crypto is expected to fall to the levels of 97000 or even to the levels of 90500 before moving to higher levels of 137k.

BTCUSD 4H chartAs we mentioned yesterday, BTC dipped to around 115500 at one point today and that was a great time to buy. Right after the pullback, it rebounded and started rising. BTC is now trading between 115600–115700, but the overall upward trend holds, and support level strong.
Buy 115000 - 115500
TP 116000 -116500 - 117000
Daily-updated accurate signals are at your disposal. If you run into any problems while trading, these signals serve as a reliable reference—don’t hesitate to use them! I truly hope they bring you significant assistance

Big Bears Waiting Near $118KNearing the finish of a small upside wave, there seems to be many bearfriends waiting near $118K. Surf carefully.

Will Bitcoin break new highs?Bitcoin has seen no major market moves. Overall, the ascending channel remains intact, and there seems little more to elaborate on. We maintain our previous view: exchange time for space.
Key Resistance: The $116,800 level has become the main battlefield for bulls and bears. If it breaks through strongly, the short-term target will look toward $118,000 or even $120,000.
Key Support: The $114,400 level is the first line of defense below; a break below this level may lead to a retracement to $113,200.
If you agree with my views, please give me a thumbs up. Thanks for your encouragement and support.

$BTC Bearish Divergence on 1H Chart Near Key Support#BTC BearishBTC/USDT on the 1-hour timeframe is flashing a bearish structure with clear divergence. The immediate correction zone looks to be around $111K, with the $110.8K support acting as the deciding level. If that floor gives way, we could see a sharp drop toward $98K. But if buyers defend the level, it may reset as a new higher low, setting up continuation. With Fed data on deck today, expect liquidity grabs both ways—first stop likely downside before any rebound.

UPDATE FOR LONG ON BTC/USD READINGTrend Line Rebounce the current trendline after a short PullBack On H2 timeframe
An Entry to the Upside on the current Trend Line to a Price target $113500.
Target for all the Entries we picked in our group is in huge profits guys
Entry Price .... $110,229.0
BTC/USD... $110,229.0
S/L ...$109,600.0
T/P ...$113,500.0
And More
Make sure to like and Subscribe to for more trade ideas in the coming week.
Kindly our trade ideas to others as well, Trade Responsibly.

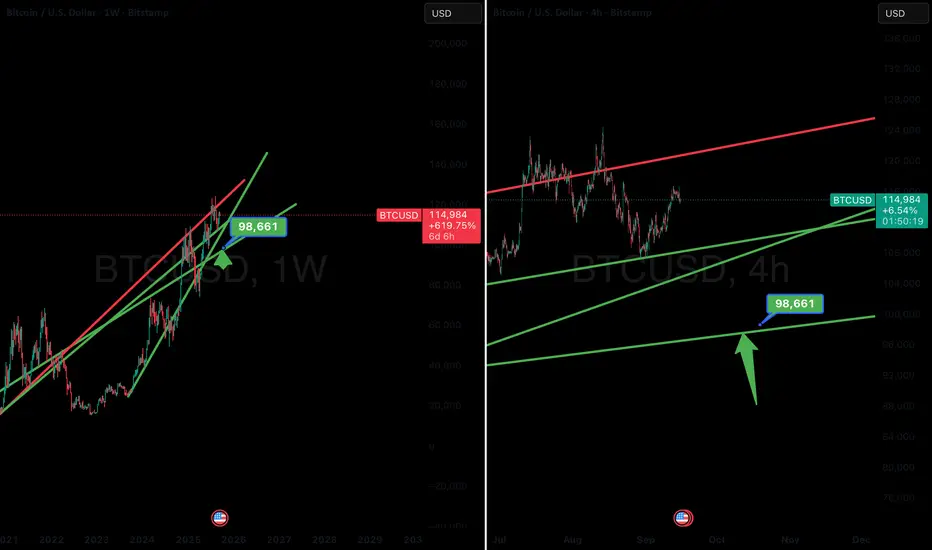
Still Bullish on Bitcoin — Loading the Dip at 98KBitcoin Long-Term Bull Thesis with Accumulation Perspective
From a macro perspective, Bitcoin continues to demonstrate its role as the premier hard asset in the digital age. The long-term structural trend remains intact — higher highs, higher lows, and a steady expansion of institutional adoption all reinforce the bullish thesis. As capital flows into the space and Bitcoin cements its narrative as “digital gold,” I remain a firm supporter of its trajectory toward significantly higher valuations over the coming cycles.
That being said, no uptrend is without healthy corrections. Markets breathe, and Bitcoin is no exception. Should we see a pullback, my eyes are firmly on the $98,000–$100,000 zone. This level aligns with a key confluence of prior trendline support and mid-range accumulation structure on both the higher-timeframe weekly chart and the lower-timeframe 4H structure. In professional trading terms, this is where value buyers are likely to step in, absorbing supply and reloading positions for the next leg higher.
In essence, my stance is unchanged: I remain a long-term Bitcoin bull. A correction, if it comes, is not a threat to the bigger picture — it is an opportunity. For those who understand the long-term story, the $98K area represents a strategic accumulation zone, a chance to strengthen positioning in an asset that I believe is only in the early chapters of its global adoption curve.
Summary: Long-term bullish, unwavering in conviction. If the market grants a correction, the $98K zone is where smart money will be waiting.
Bit Coin Short Term bearishThis chart presents an Elliott Wave analysis of Bitcoin (BTC/USD) on a 4-hour timeframe, shared by Wave Count Pro. The pattern shows a complex corrective structure unfolding within a well-defined channel, with key turning points labeled as A, B, C, D, and a projected E.
Currently, price action is approaching a critical decision zone around $117,211.36. The analysis suggests two potential scenarios:
Bullish Breakout: If the price breaks above the $117,211.36 resistance, it could trigger a strong bullish move toward the upper trendline, targeting around $140,218.55 (labeled as point E).
Bearish Rejection: A failure to break above this level could lead to a pullback toward the lower boundary of the channel, possibly completing a wave (e) before a potential rally.
Key Levels:
Buy Above: $117,211.36
Sell Below: $113,966.84
WaveCount Pro
Gautam Khanna
