btc 1h scalpfallen wedge back to .786 fib
shows hidden bullish div = rsi makes lower lows while price makes higher lows meaning we could break 126248 before losing 122569
time will tell
BTCUSD.P trade ideas

High-Probability Long at Round Number Resistance Post-ATHTrade Setup Overview
Risk-Reward Ratio: 1:2
Entry Zone: Confirmed resistance at the round number 122.00
Price Action: Price is retracing back into the order flow channel, aiming toward the Point of Control (POC)
Context & Confluences:
✅ Trend Direction: Overall trend is up
✅ Channel Breakout Attempt: Price attempted to break out of the channel, failed, and re-entered with aggressive buyers stepping in
✅ FVG (Fair Value Gap): Identified on the 1-minute timeframe, aligning with the area of aggressive buying
✅ Confirmation via Bookmap: Buyer activity confirmed on Bookmap at the identified FVG zone
✅ Key Level: Strong round number (122.00) adds further confluence
✅ Rule-Based Trade: All trade entry rules and confirmations are met
Caution:
The only concern is timing — this setup occurred over the weekend, outside of the active New York session. However, given that the market just reached a new all-time high (ATH), there is a strong likelihood of volatility resuming in the next session.
Conclusion:
This trade meets all criteria and is backed by technical confluence, order flow confirmation, and alignment with market structure. Despite the timing concern, it's a high-probability setup worth considering.

BITCOIN HIGH PROBABILITY SETUP SOON!!!🚨 BTCUSD HIGH PROBABILITY SELL SETUP 🚨
* Here We Can See Clearly The Next Potential Moves For BTC Coming Hours/Days.
* Keep Your Eyes Close On Your Trading Positions.
* Happy PIP Hunting Traders.
FXKILLA.

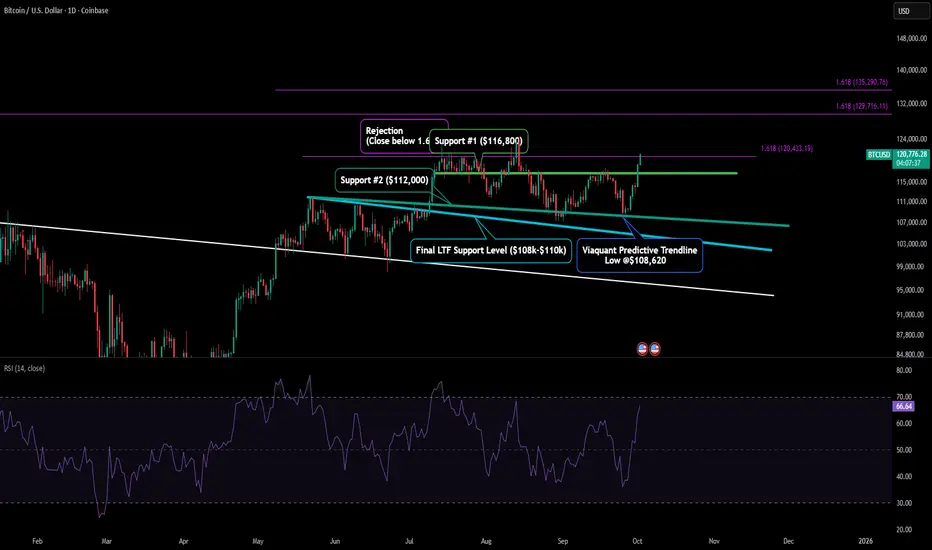
BTC - Viaquant Predicts the Future yet AgainHere is an update to our LTF Retracement Targets:
We made this post almost 3 months ago and were predicting that BTC would drop from the 1.618 ($120.4k) to either our support level #2 or our final support level for the bull trend to remain intact.
What's interesting is our "Teal trendline" that we mention as support #2 lead to the price we were predicting as our "final support level".
Since both of those support levels aligned, our recent low was established at our teal trendline and created a low at $108.6k which was right in line with that being the range for a higher low to be created before a continuation rally.
In this post, I have extended the trendline and extension levels so we can see how future price action develops with these levels.
BTC long term holders look to 03/2026Seems BTC will be floating up and down between 120-130 for a while

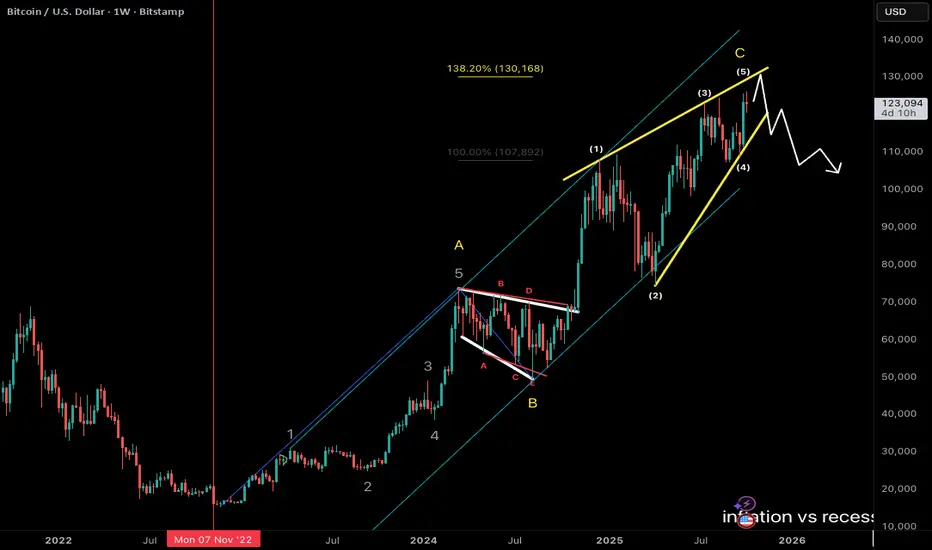
bitcoin ending diagonalbitcoin price going up in a parallel channel
wave A = 12345 and wave C making ending diagonal pattern
C = 138% of A
wave C projection, yellow ending diagonal upper line near 130k
so 130k area is big resistance zone
it has been three years for debasement trade gold and bitcoin are going up
feels like crowd panic on debt
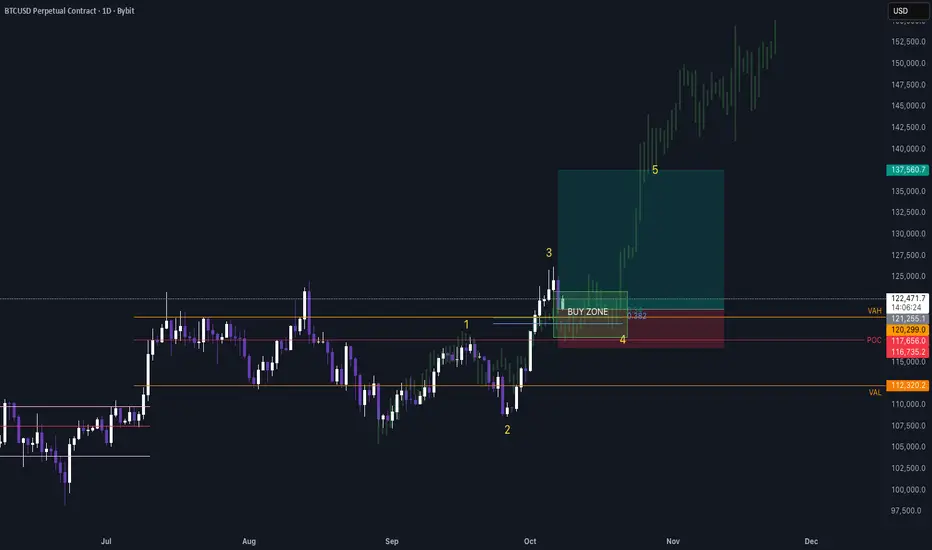
BTCUSD – Wave 5 Setup (Elliott Wave Analysis)Bitcoin appears to be completing Wave 4 and getting ready for the next bullish impulse (Wave 5).
The structure looks clean and follows classical Elliott Wave symmetry.
📊 Wave count:
Wave 1 → 107.2k → 117.8k
Wave 2 → retrace to 108.3k
Wave 3 → strong move to 126.4k
Wave 4 → correction into the 0.382 Fibonacci zone (~118.5k) → BUY ZONE
📈 Projected Wave 5 targets (Fibonacci extensions):
0.618 × Wave 1 → ~125k
1.0 × Wave 1 → ~129k
1.618 × Wave 1 → ~135k
💚 BUY ZONE: 118k–122k
📉 Invalidation: daily close below 117.8k
📍 Expectation: a strong bullish continuation soon — potential breakout toward 130–135k if momentum confirms.
⚡ “Wave 5 loading… the final impulse before correction.”
#BTC #ElliottWave #Crypto #Bitcoin #Trading
Bitcoin chart looks horrificReady for ascending wedge to take a deep plunge in the near future. how will this affect other cryptocurrencies?

Monthly Analysis: Bitcoin (BTC), Issue 278 The analyst believes that the price of Bitcoin will decrease within the time specified on the countdown timer. This prediction is based on a quantitative analysis of the price trend.
___Please note that the specified take-profit level does not imply a prediction that the price will reach that point. In this framework of analysis and trading, unlike the stop-loss, which is mandatory, setting a take-profit level is optional. Whether the price reaches the take-profit level or not is of no significance, as the results are calculated based on the start and end times. The take-profit level merely indicates the potential maximum price fluctuation within that time frame.
The validity of this analysis is based on a specific time range (until 03 Nov 2025), and after this period, the analysis will be reviewed and updated (once every 28 days).

SCENARIO 2- BITCOIN WEEKLY CHART (STRONG BULLISH MOMENTUM)In this analysis I see a Cup and Handle formation likewise a Bull Flag formation ((more reason why I foresaw next (highs) target for Bitcoin to be within the 100k-104k range i.e. Price Objective for Flag pattern)).
Range bound Price objective met 81k-82k.
As for Cup & handle price objective sits at 125k.
Let's see how Price Action unfolds in the coming weeks and months.
Bitcoin has gathered strong momentum to the upside. No doubt there will be retracements on its journey but caution is required if & when SHORTING Bitcoin at this time.
RECAP on Bullish Chart Patterns
1. Range breakout
2. Bull Flag
3. Cup & Handle.

Bullish pennantOn the 1hour timeframe we have a bullish pennant pattern wich is good for the sunday rally tomorrow.

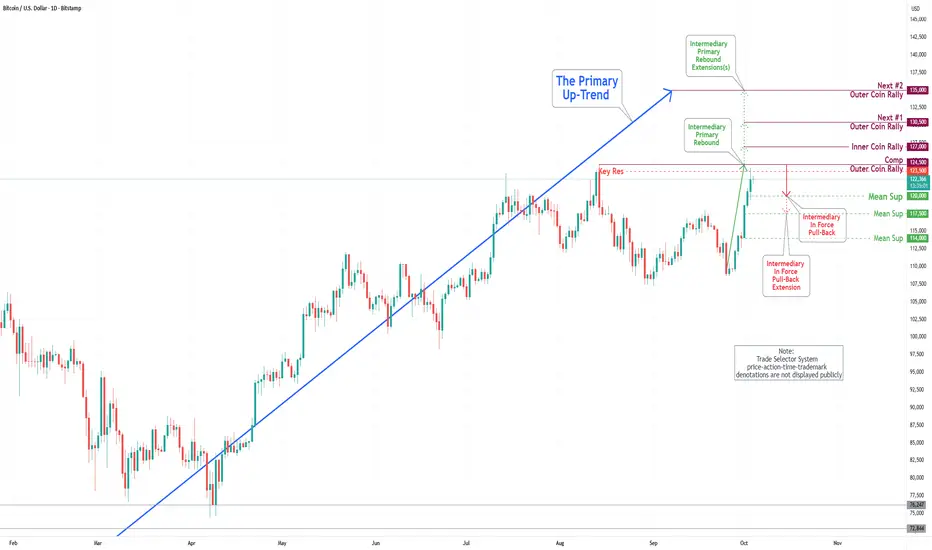
Bitcoin(BTC/USD) Daily Chart Analysis For Week of Oct 3, 2025Technical Analysis and Outlook:
During the most recent trading session, the Bitcoin market exhibited a notable surge, surpassing our Mean Resistance levels of 111600 and 113300, and the established Inner Coin Rally threshold of 117700. Currently, Bitcoin is fluctuating around the Key Resistance level of 123500 as it attempts to retest the completed Outer Coin Rally at 124500.
Following the conclusion of this retest, it is anticipated that the cryptocurrency may initiate an Intermediary In-Force Pullback towards the Mean Support target of 120000, with the potential for a further correction dip to Mean Support at 117500. Upon the completion of this phase(s), we expect Bitcoin to resume its upward trajectory.
Current analysis suggests the following designated upside targets: the Inner Coin Rally at 127000, the Next #1 Outer Coin Rally at 130500, and the Next #2 Outer Coin Rally at 135000. It is essential to recognize that Intermediary In-Force Pullbacks may occur at these specified levels.
again predicted it !!Alright, so let me break it down for you.
You see this blue ascending line here? This has been acting as major support for a while now. Every time price came down and touched it, we’ve had a strong bounce — it happened three times before, and now we’re on the fourth one.
Right now, Bitcoin is sitting around $122,500, and just like the previous bounces, it’s starting to push back up. If the pattern continues like before, the next logical target is the upper red channel line, which has been a key resistance. That’s roughly in the $126K to $128K range.
If we manage to break through that red line with real momentum, then the next big target is this yellow trendline up here. That’s a much larger resistance zone — somewhere around $135K to $140K, depending on how quickly price moves.
The volume on this bounce is picking up, which is a good sign. But I’m keeping an eye on that red resistance, because in the past, that’s where rallies have stalled.
So in short:
Short term, I’m looking for a move toward $126K–$128K.
If we break out, then $135K–$140K is on the table.
If we fall back below the blue support line, the bullish scenario is off.
Pretty clean structure so far — Bitcoin has been respecting these lines almost perfectly.

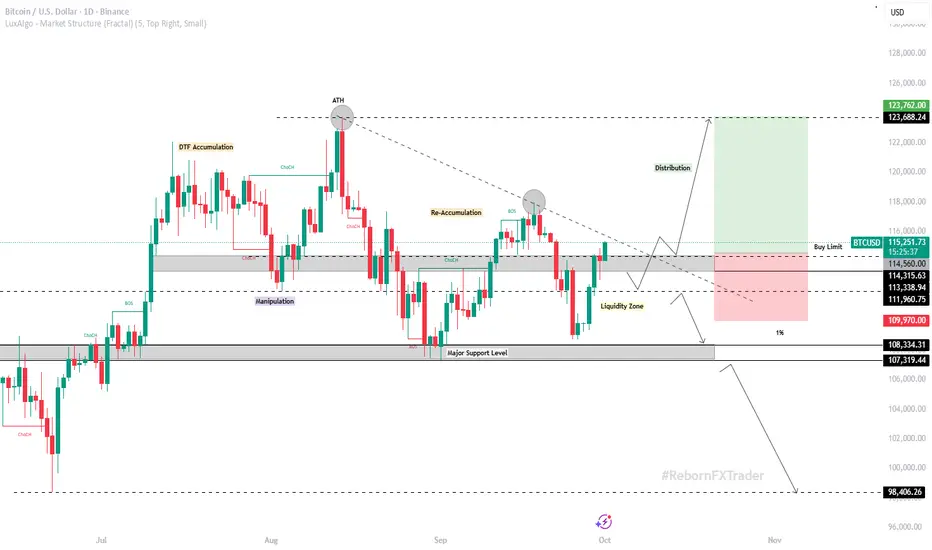
BTC Daily Timeframe – Technical & Fundamental AnalysisBTC Daily Timeframe – Technical & Fundamental Analysis
Fundamentals:
In October 2025, the U.S. SEC is expected to decide on multiple crypto ETF proposals, making this month a potential turning point for institutional adoption. Market participants are anticipating the launch of spot crypto ETPs, which could bring in significant inflows.
The SEC also unveiled plans to revamp crypto regulations, aiming to ease compliance burdens for digital asset firms and provide clearer broker-dealer guidelines. Reduced regulatory uncertainty could attract more institutional participation.
Historically, Q4 has been one of Bitcoin’s strongest performance periods, providing a seasonal tailwind that may support further upside if macroeconomic conditions remain favorable.
Technicals:
BTC recently created a new all-time high at 123,700 before breaking below its previous higher low. Price retraced down to the major key support at 108,100 before bouncing back.
Following the bounce, price formed lower highs, suggesting a re-accumulation phase before liquidity hunting. Liquidity has already been tested twice, and price has since broken above the minor key level at 113,400. BTC is now consolidating above the minor key area, indicating a bullish bias as long as the level holds.
📌 Trading Plan (DTF Bias – Bullish):
Point of Interest (POI / Buy Limit): 114,560
Stop Loss (SL): 109,970 (below liquidity zone)
Take Profit (TP): 123,762 (previous ATH)
📌 Disclaimer: This is not financial advice. Always wait for proper confirmation before executing trades. Manage your risk wisely and trade what you see—not what you feel.
BTC still tracking the projection of the last pumpsBTC is currently retesting its breakout, similar timing and magnitude to the past pumps.
Last post:

BTCUSD – 30M | Bullish Continuation Expected BITSTAMP:BTCUSD
Structure | Trend | Key Reaction Zones
Market recently tapped into strong demand zone (120,400–120,800) after a clean supply rejection.
Clear liquidity grab above highs followed by a deep correction to retest demand base — structure still bullish overall.
Market Overview
BTC has completed its corrective phase and is now reacting strongly from the demand box, suggesting potential continuation towards 123,000–125,000 if buyers sustain momentum. Price respecting the structure beautifully — accumulation signs visible again.
Key Scenarios
✅ Bullish Case 🚀 →
🎯 Target 1: 123,400
🎯 Target 2: 124,800
🎯 Target 3: 125,700 (supply zone retest)
❌ Bearish Case 📉 →
Invalidation below 120,000 (strong demand break).
Current Levels to Watch
Support 🟢: 120,400–120,800
Resistance 🔴: 123,400 / 125,700
⚠️ Disclaimer: This analysis is for educational purposes only. Not financial advice.

BITCOIN TRADE IDEABITCOIN(Daily): Bearish engulfing on Daily after breaking a previous high = shift in sentiment! Probability
Price took out liquidity above the high, then sellers stepped in strong, completely engulfing the last bullish candle.
This could signal a reversal and possible downtrend. Watch for confirmation; smart money may move the market down from here.
#ICTConcepts #MarketStructure #LiquidityTaken #BearishEngulfingBearish engulfing formed on Daily after breaking a previous high – classic liquidity grab!
The market took out stops above the high, then sellers stepped in heavy and engulfed the previous bullish candle. This often signals a potential reversal or new bearish move. Wait for confirmation #ICT #PriceAction #MarketStructure

Bitcoin Go 108000Bitcoin is ready to correct towards 108,000 after breaking the major trend line.
Tp1:119800
Tp2:116500
TP3:108000

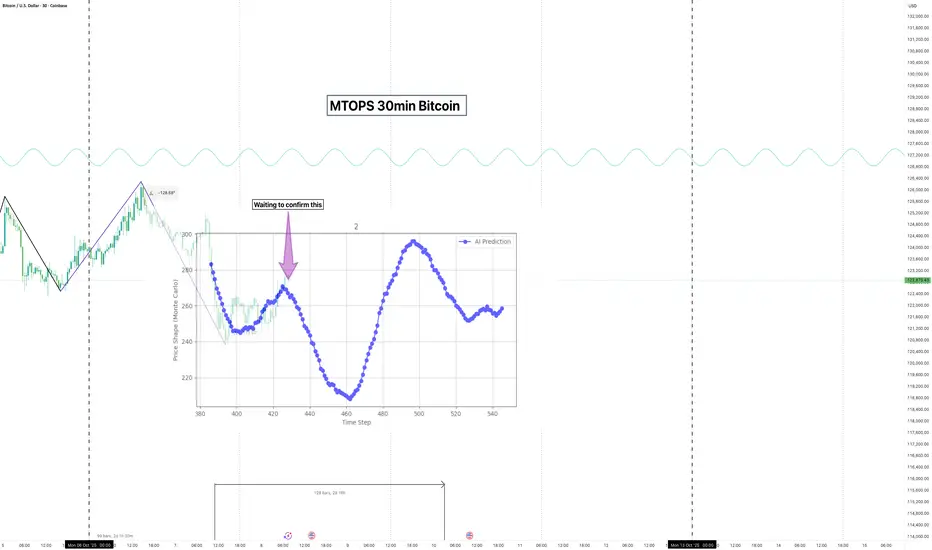
AI FORECAST OUT - waiting on confirmation the base model seems to be on fire, with 5 out of 5 forecasts correct
I am putting this one out early should we get ahead of the curve
As always, keep your trade sizes responsible if following these calls
Bitcoin Analysis – Bearish Butterfly Nears Reversal ZoneAs discussed in my previous forecast, Bitcoin remains in an uptrend, holding firm above $124,600 with the October rally guided by a strong ascending trendline. The Bearish Butterfly harmonic pattern is nearing its completion zone (PRZ) between $128K and $130K, where short-term profit-taking could occur.
The RSI near 73 suggests mildly overbought conditions, yet both the 50-day and 100-day SMAs continue to provide strong support — a sign that dips may attract new buying. A breakout above $130K would invalidate the bearish structure, setting the stage for a move toward $160K in the medium term.
Bitcoin’s price structure still favors continuation over correction, supported by consistent higher lows and growing institutional participation. The setup remains one of consolidation before expansion — not exhaustion.

BITCOIN’S 3 DRIVES OF BULLISH DIVERGENCE ON THE WEEKLY CONFIRMEDBITCOIN’S 3 DRIVES OF BULLISH DIVERGENCE: A WEEKLY RSI SIGNAL YOU CAN’T IGNORE
Bitcoin’s technical structure on the weekly timeframe is flashing a powerful setup that seasoned traders know too well — the Three Drives of Bullish Divergence. This pattern has historically preceded major macro reversals, and it’s now aligning perfectly with Fibonacci extension targets that point to the next potential leg higher.
1️⃣ The 3 Drives of Bullish Divergence
Looking at the RSI oscillator below the chart, we can clearly identify three consecutive higher lows on RSI, while the price printed relatively equal or slightly lower swing lows.
This RSI structure is a textbook “3 Drives of Bullish Divergence” — a pattern that signals waning bearish momentum before a major upside reversal.
Each of the three drives shows buyers stepping in earlier and with greater strength:
1st Drive: RSI bottomed near ~57, signaling initial absorption.
2nd Drive: RSI held higher around ~53, confirming momentum recovery.
3rd Drive: RSI reclaimed the ~55 line with strong bullish follow-through — historically the ignition point for macro rallies.
This sequence often marks the transition from distribution to full trend continuation — and in Bitcoin’s case, the bulls appear ready to take back control.
2️⃣ Fibonacci Extensions — The Roadmap Ahead
Overlaying the Fibonacci extensions from the last correction projects several key upside levels that traders are eyeing:
1.272 extension: ~$132,290
1.414 extension: ~$136,000
1.618 extension: ~$141,425
2.0 extension: ~$151,510
2.618 extension: ~$167,825
Historically, Bitcoin’s rallies after multi-drive RSI divergences have extended toward the 1.618–2.618 zones, making $140K–$167K a high-probability target zone if momentum continues to build.
3️⃣ RSI Momentum Confirmation
The RSI crossing back above its EMA and breaking out of the midline zone (~50) is a critical validation signal. It indicates that underlying buying pressure is expanding even before price fully confirms — a hallmark of institutional accumulation phases.
The combination of a three-drive divergence pattern and a bullish RSI crossover on the weekly timeframe gives a rare confluence of macro momentum and market structure alignment.
4️⃣ What It Means for Bitcoin’s Macro Cycle
This setup mirrors prior long-term inflection points — similar divergences were seen in 2019 and 2020, both preceding multi-month rallies of over 250%.
Given the RSI structure, Fibonacci projections, and improving on-chain accumulation, Bitcoin appears to be entering the expansion phase of its next macro cycle.
⚡ Conclusion
Bitcoin’s chart is sending a clear message — momentum is rebuilding under the surface.
Three bullish drives on RSI, confirmed by strong Fibonacci confluence levels, suggest a technical roadmap toward $140K–$167K in the coming cycle.
The market is evolving — and those who understand the deeper signals will rise with it.
📘 For a deeper dive into how institutional cycles, technical structures, and macro adoption converge in crypto’s evolution, explore my book Rise with Crypto — available worldwide in 🇺🇸 🇪🇸 🇧🇷 on Amazon.
#Bitcoin #BTC #CryptoMarkets #TechnicalAnalysis #Blockchain #RiseWithCrypto #RSI #Fibonacci #CryptoTrading #DigitalAssets

Bitcoin Bullish Flag In play. - $150,000 Target📈 Bitcoin Bullish Flag Confirmed — $150K Target in Play
🚀 This is a follow-up to my buy signal posted 4 days ago at $74,000, where we nailed the entry with precision. As mentioned then, the setup was clean, and now price action has confirmed our thesis.
🟩 Bullish Flag Formation:
📉 Consolidation is healthy — and this one just resolved to the upside.
