BTC Breakout and Rally to $100k Is ImminentBTC broke out of a longer term bull pennant and is now consolidating above and forming another bull flag on a smaller time frame. I'll be looking for longs on this and things like COIN if the breakout occurs, ATH would be the final obstacle.
BTCUSD.P trade ideas

Cup and handle still validBulls need to step up to confirm the short squeeze (handle breakout)
trade is still valid, and active.
still above 200 ema
sp500 still in the green

BTC predictionsOver the past week, Bitcoin has experienced a notable surge, reaching its highest level since November 2021. The price of Bitcoin topped $57,000, marking a significant increase from its previous levels earlier in the year. This uptrend is driven by a combination of factors, including positive market sentiment, strong institutional inflows into Bitcoin ETFs, and anticipation of the upcoming Bitcoin halving event scheduled for April 2024.
Coinbase analysts have observed that the factors exerting downward pressure on Bitcoin are diminishing. The completion of liquidations by the defunct exchange FTX and the recovery of some bankrupt crypto entities have stabilized the market. Additionally, the Bitcoin spot ETF market has shown stable performance, with significant daily net inflows and trading volumes, further boosting investor confidence.
Looking ahead, analysts are optimistic about Bitcoin's performance for the remainder of 2024. Predictions indicate that Bitcoin could reach $85,000 by the end of the year, driven by continued ETF inflows and historical post-halving price trends.
Overall, the outlook for Bitcoin remains bullish, with market conditions and institutional interest supporting its upward trajectory.

My active tradeGood luck to all traders
Cup and handle forming, it can fail but no indicators are showing at the moment

Bitcoin Monthly Chart Analysis!!Hello friends.
Bitcoin (BTC) has broken its previous all-time high and successfully retested it.
The monthly candle closed at $67,548, indicating strong bullish momentum.
Previous All-Time High: BTC breaking and retesting this level indicates strong support and a potential base for further gains.
Monthly Close: The monthly close at $67,548 indicates continued buying interest and bullish sentiment in the market.
Support Level: The previous all-time high now acts as a strong support level, providing a solid base for BTC’s upward move.
Resistance Level: The next significant resistance levels could be around $72,000, $74,000, and $76,000.
Bullish Scenario: Continued upward movement could see BTC testing and potentially breaking the next resistance levels.
Continued bullishness could lead to new all-time highs being reached due to strong market sentiment and institutional interest.
BTC may consolidate around current levels, gaining strength before the next significant move. Consolidation phases are common after substantial bullish momentum, causing the market to stabilize.
If BTC fails to maintain its current levels, we could see a pullback to retest support around the previous all-time high. Failure to hold this support could signal a deeper correction, although this is unlikely given the current bullish momentum.
The current levels provide a favorable entry point for long positions, with significant upside potential.
Apply stop-loss orders below key support levels to mitigate potential downside risks.
BTC’s successful retest of the previous all-time high and strong monthly close at $67,548 indicates a bullish trend. We are optimistic about BTC’s ability to continue its upward trajectory and reach new highs. Stay tuned for further updates and analysis! 🚀
What are your thoughts on this chart? Feel free to share your thoughts in the comments section. Thanks!

BTCUSD SELL Looking at the chart we have a displacement to the down side and a PDH and ARH sweep and a MSS followed by an IMB and a breaker we enter of the IMB stops at the high and target 1:2 RRR..

BTCUSD SHORT IDEAThis is my analysis of where price goes. If you want to follow strictly follow stop loss and secure profits.
Trade at your own risk!

A break above $70k, could be more bullish than you might think.We don't have perfect conditions here, but I think with a news catalyst or some new fundamentals we could have a big break up. There are 2 bull flags that I have noted on the chart and I would expect to see some action soon. I am neutral for now... The 2nd triangle should have a break soon. Not financial advice, DYOR.

next posibblity moveStochastic at oversold, the price is making sideways movement and we have higher low above EMA50. soon next move posibilty is upward after breakout from shortime downtrend. $75k next new high or $85k?

BITCOIN - $150,000 OR $40,000? - 2024 - CryptoManiac101BITCOIN / USD TA
1. Price Levels and Movements:
- The current price is around $67,696.56.
- There is a notable high at around $68,470.80.
- Fibonacci retracement levels are displayed, indicating potential support and resistance levels:
- 0.236 level at around $21,782.45.
- 0.382 level at around $26,761.12.
- 0.5 level at around $31,684.07.
- 0.618 level at around $37,486.17.
- 0.786 level at around $47,664.25.
2. Future Projections:
- The chart suggests potential future price targets/retracements:
- 1.0 Fibonacci extension level at around $64,736.25.
- 1.618 Fibonacci extension level at around $156,705.06.
3. Trend Lines and Channels:
- The price is moving within upward-sloping trend channels.
- There are dotted lines indicating potential future price channels.
4. Annotations and Indicators:
- Green arrows indicating potential buy signals and points of interest.
- A pink arrow suggesting a significant price movement.
- A highlighted oval region projecting a potential bullish move.
- Various potential future price paths indicated by white lines.
Overall, the chart is a technical analysis of Bitcoin’s price, indicating possible future price movements based on historical data and Fibonacci retracement levels.


BTC - Silence before the storm?BTC has been quite quiet lately but is it accumulating for an ATH? Let's look at the technicals.
Technicals
→ We broke above the channel and respected the retest. However, we failed volume to confirm the trend break. Are we accumulating to go up, or we are we failing?
→ There is also a zone which price touched multiple times.
Trade
→ I am conservative here for a swing trade. I like to see we a confirmed break at the 8H first resistance of around 70K$
Your trading friend,
Simba Trades

REVERSAL with BODY FACTS BTC Reversal signaling ready. Smart money green trendline pointing up; all I did was retrace it.
White trendline pointing out to both bottom wicks equals uptrend which the body candles are also pointing out the facts.

PullbackLast time was not the time. This time is the time for a pullback. We reached ATHs, time for a small breather before going wild. Unless we reach 71k.

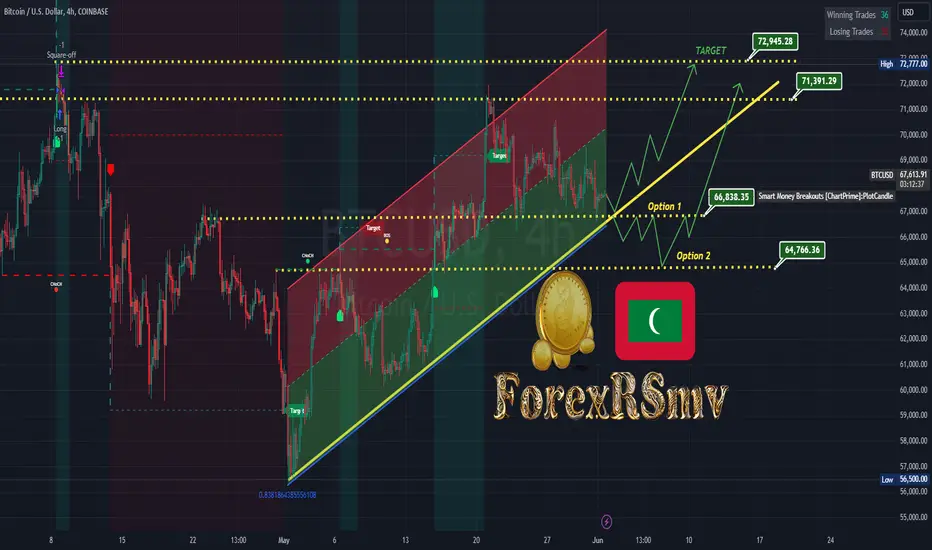
BTCUSD IDEAThe price is still in consolidation.
Now we need to watch for the reaction to the mentioned area :-
(66838-66000-64766 Support ).
If the bulls hold, then the price will head towards the resistance. But, most likely, the market has not yet accumulated the proper potential and the price may go deeper and test the support at 64500 before going up.
But, there is no talk about a crash or a global fall now.
BITCOIN - TIME TO BUY?$2.5 Billion In Bitcoin Withdrawn From Centralized Exchanges – A Bullish Signal?
Investor confidence in the crypto market is rising, and Bitcoin is reaping the benefits. Large-scale investors are accumulating BTC despite its recent price fluctuations.
In May, Bitcoin's price failed to stay above the critical $70,000 mark, even though it briefly touched this level twice in the last two weeks. However, recent on-chain data shows growing faith in Bitcoin.
Is BTC Ready for a Price Rally?
Prominent crypto analyst Ali Martinez highlighted a significant outflow of Bitcoin from centralized exchanges in a recent post on the X platform. This observation is based on the CryptoQuant Exchange Reserve metric, which tracks the amount of a specific cryptocurrency held in centralized exchange wallets.
An increase in this metric indicates more deposits than withdrawals of Bitcoin into exchanges, whereas a decrease implies more withdrawals than deposits.
Martinez reported that over 37,000 BTC, worth approximately $2.53 billion, have been withdrawn from exchanges in the past three days. This significant outflow signals a shift in sentiment and suggests that investors are increasingly opting to hold Bitcoin in self-custodial wallets for the long term.
While the exact reasons for this massive outflow are unclear, the movement of funds away from exchanges points to increased investor confidence in Bitcoin's future. This shift could lead to a supply crunch, a situation where demand exceeds supply, potentially driving up Bitcoin's price.
Bitcoin Price Overview
As of now, Bitcoin is priced around $67,489, showing a 1.5% decline in the past 24 hours. Despite this, the ongoing reduction of BTC on exchanges might set the stage for a bullish rally, especially if the supply crunch materializes.
