BITCOIN ( BTCUSD ) BREAKOUT ANALYSISHistorically, BTC has gained on average 30% - 50% on Q4. For the better part of the year, BTC has been in a consolidation phase since the last Q4 breakout from 68k to 106k. At the current price, BTC has broken the previous resistance @ 124,500k. The price action in itself remains firmly bullish, since the rising prices are accompanied with rising volume. There is also minimal selling pressure as candles on the Daily TF close at or near the highs with very small or no wicks.If history repeats itsels, a 50 % gain on the Digital Gold could possibly propel it to >160k ny the end of the year.
BTCUSD.P trade ideas


BTCUSD analysis on daily timeframe BTCUSD is touching all time high resistance a possibility of short time downside move to nearest support.

Against the trend, risky but worthy trade..I found the head and shoulder potential pattern in BTCUSD today.
As price now is challenging its high and been around 88.6% fibo level as well as the previous swing high (left shoulder), i will entry short from this level..
GOOD RR, i am expecting a correction to 114-115k in upcoming week.
CHEERRRSSS...!!!

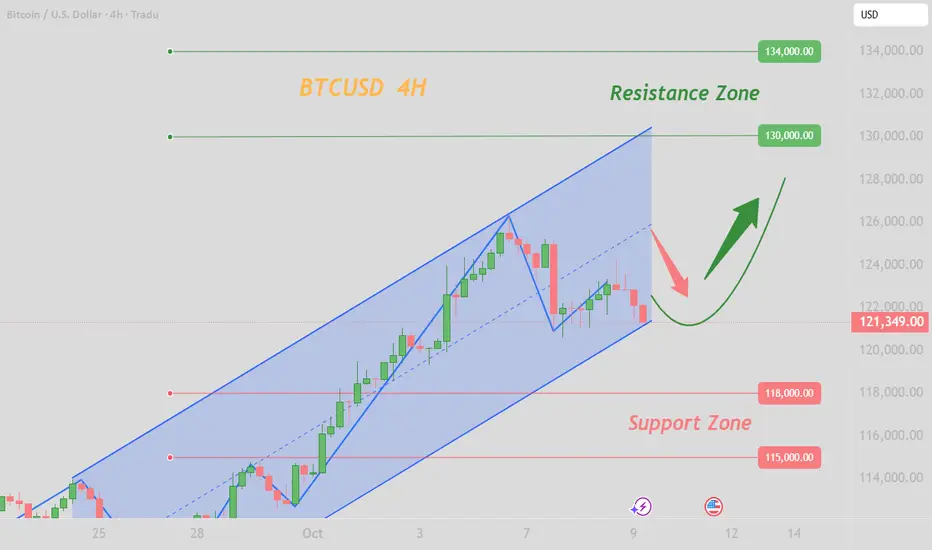
BTCUSD H4 | Bullish Momentum Likely to ContinueBitcoin (BTC/USD) is falling towards the buy entry at 117,764.14, which is a pullback support that aligns with the 23.6% Fibonacci retracement and could bounce from this level to the upside.
Stop loss is at 114,705.13, which is a pullback support that lines up with he 50% Fibonacci retracement.
Take profit is at 124,031.38, which acts as a swing high resistance.
High Risk Investment Warning
Trading Forex/CFDs on margin carries a high level of risk and may not be suitable for all investors. Leverage can work against you.
Stratos Markets Limited (tradu.com ):
CFDs are complex instruments and come with a high risk of losing money rapidly due to leverage. 65% of retail investor accounts lose money when trading CFDs with this provider. You should consider whether you understand how CFDs work and whether you can afford to take the high risk of losing your money.
Stratos Europe Ltd (tradu.com ):
CFDs are complex instruments and come with a high risk of losing money rapidly due to leverage. 66% of retail investor accounts lose money when trading CFDs with this provider. You should consider whether you understand how CFDs work and whether you can afford to take the high risk of losing your money.
Stratos Global LLC (tradu.com ):
Losses can exceed deposits.
Please be advised that the information presented on TradingView is provided to Tradu (‘Company’, ‘we’) by a third-party provider (‘TFA Global Pte Ltd’). Please be reminded that you are solely responsible for the trading decisions on your account. There is a very high degree of risk involved in trading. Any information and/or content is intended entirely for research, educational and informational purposes only and does not constitute investment or consultation advice or investment strategy. The information is not tailored to the investment needs of any specific person and therefore does not involve a consideration of any of the investment objectives, financial situation or needs of any viewer that may receive it. Kindly also note that past performance is not a reliable indicator of future results. Actual results may differ materially from those anticipated in forward-looking or past performance statements. We assume no liability as to the accuracy or completeness of any of the information and/or content provided herein and the Company cannot be held responsible for any omission, mistake nor for any loss or damage including without limitation to any loss of profit which may arise from reliance on any information supplied by TFA Global Pte Ltd.
The speaker(s) is neither an employee, agent nor representative of Tradu and is therefore acting independently. The opinions given are their own, constitute general market commentary, and do not constitute the opinion or advice of Tradu or any form of personal or investment advice. Tradu neither endorses nor guarantees offerings of third-party speakers, nor is Tradu responsible for the content, veracity or opinions of third-party speakers, presenters or participants.

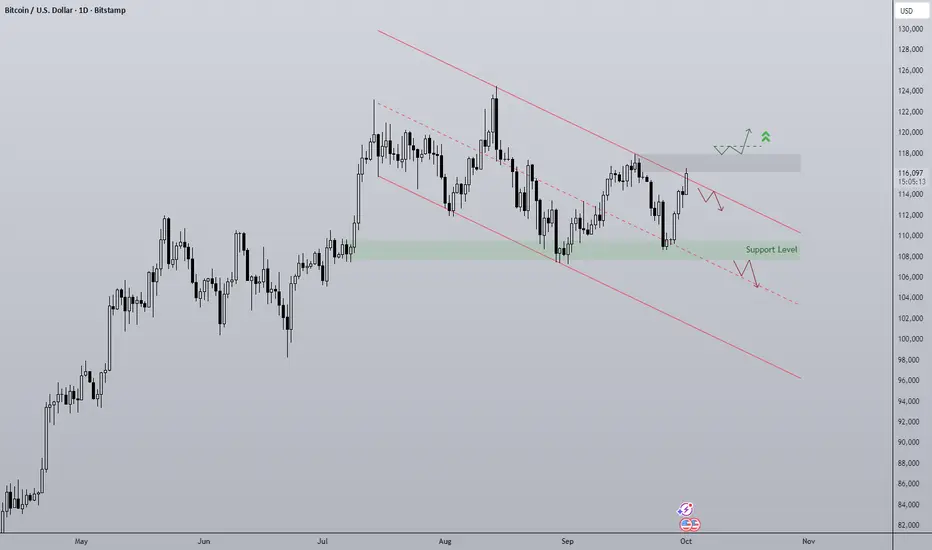
check the trend It is expected that after some fluctuation and correction, the trend change will take place and we will witness the start of the uptrend.
If the price breaks through the support range, the continuation of the downtrend is likely.

BTC: Three-stage trajectorToday's BTC market shows a pattern of high-level consolidation with a pullback, characterized by a three-stage "surge - retracement - consolidation" trajectory. In the early session, it attempted to break through the 124,000 resistance level but failed. Subsequently, it pulled back to around 121,000 to seek support, and later, a bull-bear tug-of-war unfolded within the 122,000 range.
Close attention should be paid to the October 15 deadline for the U.S. government shutdown (Polymarket predicts a 56% probability of it lasting until that date). If the shutdown is extended, leading to further delays in ETF approval, Bitcoin may retrace below 120,000, and in extreme cases, test the support level at 118,000.
The current market is suitable for a "low-leverage + position-splitting strategy": Holders can set 121,000 as the trailing stop level. Given that the current support level has moved upward and trading volume has not contracted, the stop-loss range can be appropriately widened. On the other hand, observers may wait for the price to stabilize above 123,600 or for signs of stabilization with reduced volume after retracing below 120,500 before considering entry, avoiding chasing gains or selling in a panic within the consolidation range.
Buy 121000 - 121500
TP 122000 - 122500 - 122300
SL 120000
Daily-updated accurate signals are at your disposal. If you run into any problems while trading, these signals serve as a reliable reference—don’t hesitate to use them! I truly hope they bring you significant assistance
BitcoinBTCUSD
- Completed " 12345 " Impulsive Waves
- Break of Structure
- RSI - Divergence
- Fibonacci Level - 38.20%
- Order Block

Back-up model did WELL, but Bitcoin disappointed (lol) we got 3 good transitions out of this AI prediction
Where I expected price to rally back up, it instead ranged into a consolidation zone (WEAK!)
I'll load up the next prediction and send that out sometime...

BTC 167.000 240.000 how bullish?Don´t have an idea , maybe 167k or 240k. Major probability = 200-240k range

BtcusdUsing the daily timeframe I've come across three major touches for btcusd,moving to smaller time frames such as the thirty minutes time frame and lower i see a market structure that tells me price might possibly correct back to 118 000


Btcusdt !!!:)No need to panic btc on the resistance fan everything is fine .
5% retracement is nothing .
Now e everyone predi t altseason because it is but they try to make you sell all of them.
#btc #altseason #memesage

Trading: The Most Relative Profession in the WorldIntroduction
Most professions operate within clear boundaries of right and wrong, success and failure. A doctor either saves the patient or doesn’t. An engineer either builds a stable bridge or one that collapses. But trading doesn’t work like that.
In trading, “being right” and “being wrong” are relative. Two traders can look at the exact same market, take opposite positions, and both can be right. At the same time, they can both be wrong. This relativity is what makes trading not only fascinating, but also psychologically challenging.
________________________________________
Why “Being Right” Is an Illusion in Trading
Many traders fall into the trap of needing to be right. They celebrate when their forecast matches the price action, and they criticize others when opinions diverge. But trading isn’t about intellectual debates — it’s about execution, timing, and money management.
You can make the perfect call, but if you enter at the wrong time or exit poorly, you still lose. Conversely, you can be “wrong” in your forecast, yet still make money because you managed your trade correctly.
________________________________________
A Real Example: Gold’s Price Action Yesterday
Take gold, for instance:
• Trader A says: “Gold will rise.”
• Trader B says: “Gold will fall.”
Who is right? The answer is not straightforward.
• Gold made a new all-time high during the day — Trader A can claim victory.
• Gold sold off after — Trader B can also claim victory.
But here’s the twist:
• Trader A was wrong if he bought at the very top before the selloff.
• Trader B was wrong if he sold too early at 3860 before the new ATH.
This example shows how trading doesn’t operate in absolutes. The market gives both validation and punishment, depending not only on the direction, but also on timing and execution.
________________________________________
Timeframe Relativity: Scalper vs. Swing Trader
This relativity becomes even more visible when we compare a scalper with a swing trader — in fact, this is where it shows itself most clearly.
Consider this scenario:
• The scalper buys against the larger trend, catching a quick 50-pip bounce from intraday volatility.
• The swing trader sells with the dominant trend, holding for several days and capturing 300 pips once the broader move unfolds.
At first glance, their positions contradict each other. One is long, the other is short. Yet both can be right — and both can make money — simply because they operate on different timeframes, with different objectives and risk tolerances.
Don’t believe me? Here’s a real and concrete example: back in 2022, I shorted BTC heavily and made strong profits. At the same time, a good friend of mine kept buying into weakness and applying a DCA strategy.
Who was right?
The answer, again, is relative. I was right in the medium term — profiting from the bearish momentum. My friend was right in the long term — building a position that paid off when the market eventually recovered.
This is the purest example of relativity in trading: the same market, moving in both directions, rewarding two very different strategies.
________________________________________
The Key Lesson
Trading is not about proving a point. It’s not about winning an argument on social media or showing that your market call was correct. It’s about managing trades in a way that consistently extracts profits, regardless of who “guessed” the move better.
The market doesn’t reward opinions. It rewards discipline and risk control. Always remember:
• Entries are relative.
• Exits define success.
• Risk is king. A “right” prediction with poor risk management can still end in disaster.
In other words: you don’t get paid for being right — you get paid for good execution and risk management.
________________________________________
Why Relativity Matters
Understanding the relativity of trading helps in three ways:
1. It kills the ego. You stop caring about being right and start caring about making money.
2. It reduces conflicts. Another trader’s opposite view doesn’t threaten yours; both can co-exist.
3. It shifts focus. The conversation moves from “Was I right?” to “Was my trade profitable?”
________________________________________
Conclusion
Trading is the most relative profession in the world because “truth” in markets is never absolute. Two traders can both be right, both be wrong, or both at once.
What separates successful traders from the rest is not their ability to “predict,” but their ability to trade with discipline, adapt to changing conditions, and manage risk.
In the end, the scoreboard is your trading account — not your pride in being right. 🚀

October 2 Bitcoin Bybit chart analysisHello
It's a Bitcoin Guide.
If you "follow"
You can receive real-time movement paths and comment notifications on major sections.
If my analysis was helpful,
Please click the booster button at the bottom.
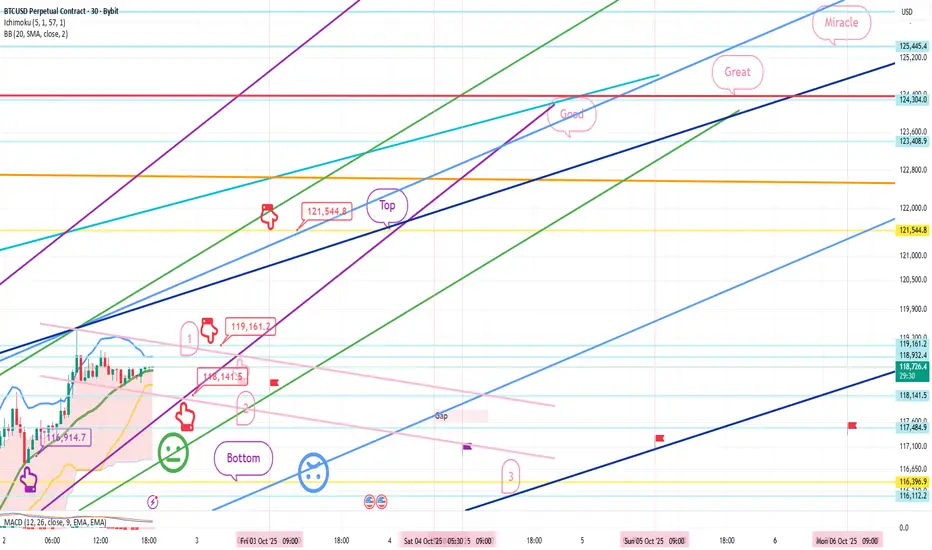
This is a 30-minute Bitcoin chart.
The bottom left shows yesterday's long position re-entry point, $116,914.7, indicated by a purple finger.
We will continue with the trend-following strategy.
*Red finger movement path:
Long position strategy
1. $118,668.2 long position entry point / Stop loss price if the green support line is broken
2. $119,161.2 long position primary target -> Target prices in order from the top to the miracle level
If the strategy is successful, the first section is the long position re-entry point,
and a new high is reached after the great breakout.
The second section is the final long position entry point.
If the green support line is maintained until the second section,
it will become an upward sideways market.
If the light blue support line holds through the weekend and next week,
it could continue to rise as it's a mid-term uptrend line.
Please keep this in mind.
Bottom -> I've left up to three sections.
You can check the prices of the major support and resistance lines above and below the section I've left or by dragging.
Please use my analysis as a reference only.
I hope you operate safely, with a principled trading strategy and stop-loss orders in place.
Have a nice holiday until next Friday.
I'll be back on Friday.
Thank you.
BTC consolidates after a significant price spikeBITSTAMP:BTCUSD price has had a slight correction after the previous increase.
Yesterday, the price broke the trendline and the EMA approached, creating a momentum accumulation zone before a strong break - as planned to buy.
Currently, BTC is correcting after the increase, just cutting down the EMA, showing that buying power is weakening, the short-term trend may turn down.
There is no clear signal to enter the order. Continue to observe the price reaction around the EMA and wait for a clear setup before taking action.
You can refer to my previous analysis here:
Please like and comment to support our traders. Your feedback motivates us to produce more analysis in the future 🙏✨

BITCOIN - BULLISH MOVE!Hello Traders!
The Bitcoin failed to create a new lower low!
The price broke the resistance line!
So, I expect a bullish move🚀
______________
TARGET: 116830.00🎯

BTC vs USD: Macro Liquidity vs TechnicalsBitcoin is at a hinge point.
Technical View: Weekly volume profile looks bearish, but if BTC closes above 119,465.52 the setup flips into an explosive breakout.
Macro View: The dollar is boxed (96.7–98.3) and fiscal stress + Fed cut bets are weighing on USD. Gold is at record highs on safe-haven demand. In this environment, macro liquidity can override technical ceilings.
That’s why I’ve stepped back to scalping until the macro picture stabilizes. The market is running on liquidity hunts, not clean structure.
🔑 Levels to Watch
BTC: Weekly close >119,465.52 → ignition higher
DXY: Breakout from 96.7–98.3 range decides cross-asset direction
When macros dominate, technicals bend. Patience and risk control matter more than chart perfection here.

The science of hindsight I didn't sleep easy last night at the AI back-up model getting the forecast wrong (the dip bit)
So after a 'ah-ha', I rushed over to the trade computer and saw that the primary AI model actually DID GET IT RIGHT, it was human error that missed it.
My confidence is restored, the King of the AI models defends it's thrown

$BTC anatomy of a steady trendConstructive price action within a steady uptrend since beginning of Jan 2023

Bitcoin in Q4 As "Uptober" begins the layout for Bitcoin is as follows:
- Downtrend on the daily officially since 18th September but really it began after the SFP of ATH on August 14th.
- The origin of the rally to ATH has served as support twice since at $108,000
- Diagonal trendline resistance being tested as Q4 begins, seasonality shows October is very strong for returns, 21.89% average since 2019.
- Compression of the range inevitably leads to a breakout in either direction.
Bullish scenario is reclaim of $117,500 to push towards ATH.
Bearish scenario is a loss of $108,000
BITCOIN USD UPDATE🚀 “117,998.17” — We Hit the Trigger
We pierced a massive rally threshold today (117,998.17) — a short squeeze or momentum flush — yet dollar and gold remain locked in ranges. That dissonance tells you this is a liquidity-game market, not a clean trend.
We’re still trading in what I’d call an overpriced arena — volatility amplified, direction masked. Price action will mislead until a big macro break comes.
The dollar remains boxed: Value Area High ~98.322 / Low ~96.747. Gold, meantime, is ripping higher under safe-haven flows, hitting record highs amid shutdown fears and rate cut bets.
Meanwhile, bitcoin is getting a bullish tailwind. Whale accumulation, institutional demand, and macro narratives favoring digital gold are pushing sentiment.
Macro catalysts (Fed, U.S. jobs, fiscal politics) could fuel either direction — but the setup is leaning toward asymmetric upside in risk assets if USD weakens.
LOOK OUT:
Liquidity hunts likely before clarity — expect fake-outs.
Dollar must break its box for cross-pairs and cryptos to trend.
Bitcoin is better aligned with the upside in this regime than dollar or gold.
