BITCOIN Risky Short!
HI,Traders !
#BITCOIN grew up fast
But then hit a horizontal
Resistance level of 117678.7
From where we are already
Seeing a nice pullback
And we will be expecting
A further local move down !
Comment and subscribe to help us grow !
BTCUSD.P trade ideas

btc Ready for PUMP or what ?The price is at the channel's bottom, and if it follows the previous Pump from bottom of thechannel pattern, the price could reach the channel's top.

Bitcoin Direction and Biasprice rejects two times from daily order block. from there its a normal fvg that trust will fail pushing price towards 114

Had to share the sauce now everybody drippinNot to toot my own horns but Toot toot lol
But I took partial profit around 117,000 and moved stops to break even.
I’m still aiming for 120,0000 but if you have a strong rejection I’m take what I can get!
But hey…. What do I know?

BITCOIN Will Go Lower! Sell!
Please, check our technical outlook for BITCOIN.
Time Frame: 9h
Current Trend: Bearish
Sentiment: Overbought (based on 7-period RSI)
Forecast: Bearish
The market is approaching a significant resistance area 116,555.66.
Due to the fact that we see a positive bearish reaction from the underlined area, I strongly believe that sellers will manage to push the price all the way down to 113,250.42 level.
P.S
Please, note that an oversold/overbought condition can last for a long time, and therefore being oversold/overbought doesn't mean a price rally will come soon, or at all.
Like and subscribe and comment my ideas if you enjoy them!

Bitcoin to 700k and above Looking back at the Bitcoin price chart I shared in October 2024 (link) which projected a rise to $120,000 based on the upward trend line and historical cycles, I'm thrilled to report that my prediction came true—not just in price, but exactly on the timeline I anticipated. That chart, showing the weekly BTC/USD data from Bitstamp with key levels like the high of around $73,794 and the trend pushing toward six figures, captured the momentum building after years of consolidation. Fast forward to now in October 2025, and Bitcoin did indeed hit that $120,000 mark right when the pattern suggested, validating the reliability of these recurring market rhythms. This success isn't luck; it's rooted in observing how Bitcoin weathers extended low-price phases before unleashing bull runs that redefine its value.
Building on that proven track record, I'm even more convinced that Bitcoin can surge to $700,000 or beyond in the coming years. The chart from last year already hinted at this potential with its steepening trajectory, and the underlying dynamics remain the same: prolonged bearish or sideways periods—often 2-3 years of grinding lower or stagnating—give way to explosive 12- to 18-month bull markets fueled by halvings, institutional adoption, and macroeconomic factors. We've seen this play out multiple times, from the post-2018 lows leading to the 2021 peak, to the recent accumulation phase setting up the next leg up. With prices now consolidating after that $120,000 milestone, it feels like the perfect setup for another parabolic move.
To my readers, I urge you to pay attention to these patterns and not get discouraged by the quiet times—they're the foundation for massive gains. If my $110,000 call from October 2024 panned out precisely as charted, imagine what $700,000 could mean if we stay the course. Keep watching indicators like those Fibonacci levels on the chart (e.g., 38,446, 53,272, up to 106,034 projections), and let's position ourselves for the ride. History doesn't repeat exactly, but it rhymes, and this rhyme is shouting opportunity.

Bitcoin establishes early Uptober support baseToday was a positive sign as bitcoin rose $3236, or 2.9%, to $114,3500. That move potentially helped establish a potential floor for the Uptober rally.
From a technical perspective, Bitcoin is holding above the rising 100-day exponential moving average, which has acted as dynamic support at times since April. The price has broken this trendline multiple times over the past few months, and each time buyers have stepped in to defend it.
Upside levels to watch:
$116,500 – First resistance from late September intraday highs.
$120,000 – Key swing high from July, a strong psychological barrier.
$124,000 – Major resistance from August.
$128,000 – Year-to-date peak.
$140,000 – Round number resistance and measured move target if Bitcoin clears $128K. Also lines up with Fibonacci extensions of the April–August rally.
$150,000 – Big psychological milestone.

........BITCOIN........SO this is how i think i like to see your way of thinking so write a comment please
right now we are trying to brake an important resistance in btc.d and we must wait because in before we tried to break there but we didnt and now we are trying again to break there and if we do that bullrun can start because were also getting out from downtrend we were in btc.d so chek btc.d in usdt.d we brake our downtrend but the thing is our bull momentum in usdt.d is not that good and even we tried to brake a resistance but we failed and chart is making a head and shoulder pattern to downtrend and yeah btc CAN start going up you just have to wait for some breakings, good momentum and btc.d going up with usdt.d going down

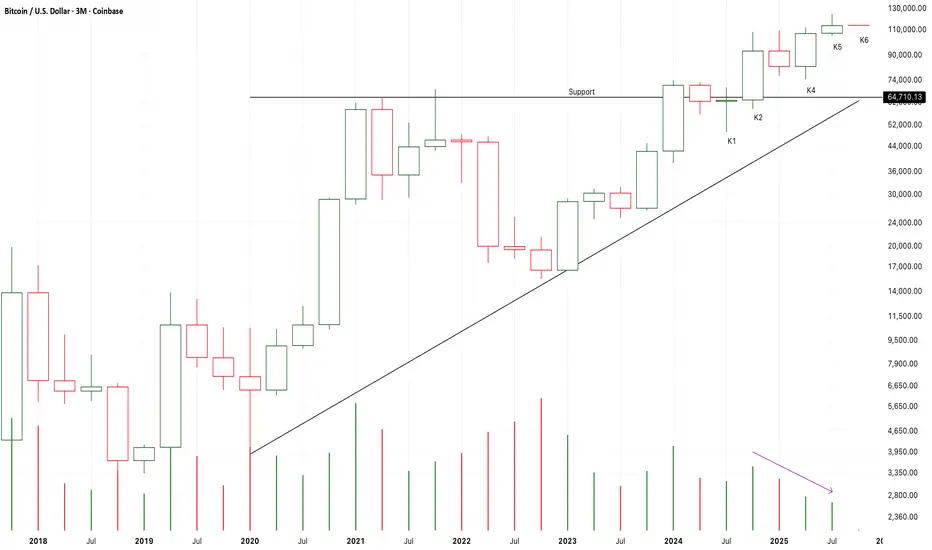
Chart Pattern Analysis Of Bitcoin.
After K2 breaking up a bullish triangle pattern,
The market failed to accelerate to get away from the support line.
From K2 to K6,
There is a trend that both the price and demands keep decreasing to a lowest level.
It verified a weakness of the market.
I am expecting a pull back to retest the support at the following cancels to verify a valid break up of K2.
If K6 is a red candle,
There will be a bearish evening star pattern and the market will most likely fall to test the support.
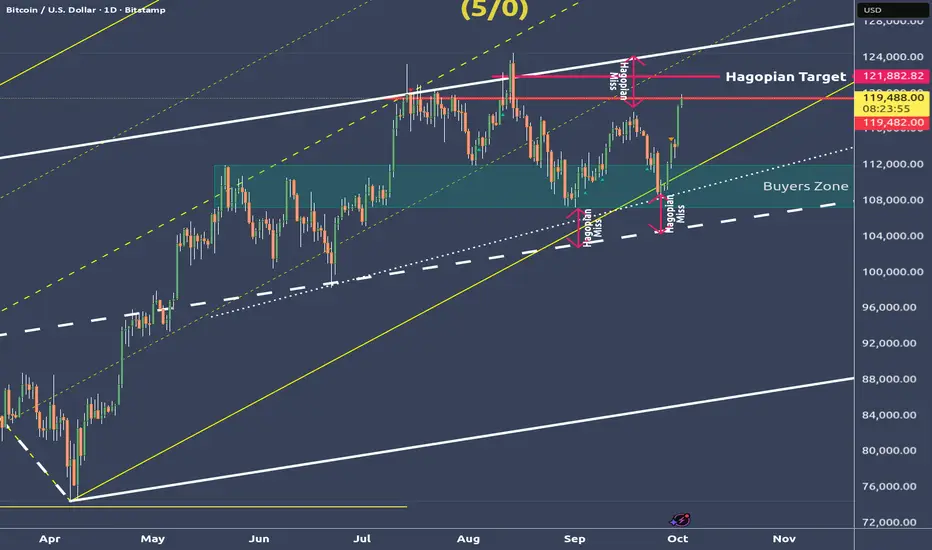
Bitcoin deep dive - We go up to the Hagopians line🔱 Up to the HAGOPIAN's line! 🔱
My last post showed what the possible moves are.
Bitcoin blew through both U-MLH's and is now on the way to the HAGOPIAN-Line.
I could imagine that we even tag the white U-MLH again.
That would be about where the confluence with the yellow forks 1/4 line is.
Because there is much more to say about this chart, I thought I'll do a video.
⛏️ I constructed the Chart from the ground up so you can see all the details and thoughts running through my Mycel Network §8-)
👉 Just check my SOM links.
🙏 Thanks you all for the Boosters I got lately. You all are absolutely awesom and I really appreciate it! 🙏
BTC rejected from key 114,228$ - down to 103,792$ now!Hey, guys
sometimes I wish I could do more regular updates to make you aware of things as they happen, but I don't get the chance to, saw this pump coming but was away from my computer and TV only allows to post on desktop and not mobile, if I am correct.
There's a strong support at 110,600$ but this should be broken to the downside, for price to see lows of 106,607$.
if 106,607$ is broken to downside, which I expect it will, then we will reach final target of 103,792$ for this move - we expect downside to 80k before EOY but, lets take things step by step as it most likely won't be a straight drop to that level.
so yes, we are still very much bearish on BTC.
Everyone will have the chance to dollar cost average on BTC between 30-50k in the long run before the next bull cycle, I will make sure you all achieve this.

BTC/USD Buy-Stop, Bullish Trend, No Bearish DivergenceBitcoin is showing a Bullish Trend without any divergence. If it breaks the last Higher High (HH), it can go further up.
We have placed a "Buy-Stop" order in case the price goes up. This is a 1:1 Risk to Reward Trade. Let's see how it goes.
02-10-25
12:17 AM

BTCUSD: Watching for the Dip and Bounce to the Trend LineHello everyone, here is my breakdown of the current Bitcoin setup.
Market Analysis
From a broader perspective, the price of Bitcoin is currently consolidating within a large Range, just below a major descending Trend Line. This indicates a period of balance and energy build-up after a significant prior move.
Currently, the price is in a corrective pullback within this Range. It is heading towards the lower support levels, a key area where buyers have previously shown strength and absorbed selling pressure.
My Scenario & Strategy
My scenario is built on the idea that this consolidation is a bullish accumulation phase. I think that before the main rally continues, the market will make a small corrective movement down to test the Support zone.
I'm looking for a confirmed bounce from this Support zone around the 109000 level. This would be the key signal that the pullback is over and that buyers are ready to take control for a move towards the upper boundary of the consolidation.
Therefore, the strategy is to watch for this bounce. A successful rebound would validate the long scenario. The primary target for the subsequent rally is the 115500 trend line at the top of the Range.
That's the setup I'm tracking. Thank you for your attention, and always manage your risk.

BTC VS GOLD 56 DAY OFFSETBTC VS GOLD 56 DAY OFFSET.
Gold reaches new aths, bitcoin likely to follow soon.
This is a chart with 56 days(8 week) lag.

Bitcoin (BTC) Bulls Face Critical Test at 120K Resistance
Bitcoin (BTC) Bulls Face Critical Test at 120K Resistance
Bitcoin (BTC) is currently exhibiting strong bullish momentum on the 4-hour chart, having rallied significantly from a confirmed "Double Bottom" around the "Strong Support 108K" level and now trading at 118,949.27.
The price is actively challenging the "Current Resistance 120K level" and a crucial ascending "Trend line" (blue dotted) around 121K-122K, indicating a pivotal test for the ongoing upward movement.
Failure to decisively break above these immediate resistance levels could trigger a retracement, with the "117K to 118K - Immediate Support" zone being the first critical area to watch for buyers to step in.
Maintaining price action above the "115K Good Support" and the "112K- 113K Important Level" is essential for the bullish structure to remain intact and for further upside potential.
Disclaimer:
The information provided in this chart is for educational and informational purposes only and should not be considered as investment advice. Trading and investing involve substantial risk and are not suitable for every investor. You should carefully consider your financial situation and consult with a financial advisor before making any investment decisions. The creator of this chart does not guarantee any specific outcome or profit and is not responsible for any losses incurred as a result of using this information. Past performance is not indicative of future results. Use this information at your own risk. This chart has been created for my own improvement in Trading and Investment Analysis. Please do your own analysis before any investments.

Bitcoin BTC: VWAP Extension, Three-Drive Pattern, & Trade Plan📊 Bitcoin (BTC) continues to hold a strong bullish trend, but in my view it is now overextended as we head into the end of the week ⚡.
🔎 In the video, I break down how BTC is currently trading two deviations above VWAP, highlighting its stretched positioning. We also discuss the three-drive pattern, which often precedes a correction — particularly when combined with a VWAP extension and end-of-week institutional activity as larger players wind down their trades 🏦.
📈 With that in mind, I’m anticipating a retracement. If price pulls back into support and then confirms with a bullish break of structure, I’ll be looking for a long opportunity 🎯.
⚠️ Disclaimer: This analysis is for educational purposes only and not financial advice. Always trade responsibly and manage risk carefully.

Bitcoin (BTC/USD) Daily Analysis📊 Chart Structure:
Bitcoin is currently trading inside a descending channel / falling wedge pattern. The price recently bounced from the lower boundary and is now moving toward the upper resistance zone.
🔑 Key Levels:
Immediate Resistance: $119,800 – $120,000 (upper trendline + supply zone)
Major Support: $113,500 – $114,000 (demand zone / blue box)
Extended Support: $108,000 – $105,000 (200-day MA + channel support)
📈 Moving Averages:
Price is consolidating above the 20-day (green) and 50-day (yellow) MAs.
The 100-day MA (blue) is acting as short-term support.
The 200-day MA (red) sits near $105K and remains a strong long-term support.
📉 RSI Indicator:
RSI is around 63 – showing neutral to slightly bullish momentum. A push above 70 could lead to overbought conditions.
🔮 Outlook:
A breakout above $120K could trigger bullish continuation toward $124K – $126K.
A rejection at resistance would likely send the price back to the $114K – $113K demand zone.
📌 Conclusion:
Bitcoin is at a critical level. Bulls need a confirmed breakout above $120K to sustain momentum, while a close below $114K would give bears an edge.

BTCUSD Reversal trade🚀 BTC Bulls Still in Control… but Watch This Zone 👀
I’m currently riding buys from 109.5K, targeting the 117.5K zone 🔥. That’s where I’ve marked a key sell zone.
⚡️ On the 4H chart, we’re pushing into a strong resistance area. Previous bearish OB + valid supply zones = high probability of a pullback here.
My plan:
Take profits at 117.5K ✅
Watch the sell zone closely 👀
If we see rejection, I’ll look to flip into sells.
Watch decision zone closely I’ll switch back into buys for the next leg up.
👉 What’s your bias here — bulls 🐂 or bears 🐻?

BTC Rally – New Highs or Bull Trap?Hey Traders, IG:BITCOIN is currently trading within established descending channel since August highs at $124k , The recent bounce has now pushed price back up, currently sitting at the 38.2% Fibonacci retracement and likely heading into a critical supply zone at 115K–116K , which also aligns with the 50% Fib level .
This confluence, combined with RSI nearing overbought territory and the potential formation of a hidden bearish divergence (price making lower highs while RSI makes higher highs), suggests that momentum is weakening as we approach resistance. Historically on this chart, bearish divergences have often preceded meaningful pullbacks.
Unless bulls can break decisively above this zone and invalidate the channel structure, the probability favors rejection and continuation lower . My short‑term outlook points toward a move back into the demand zone, with Target 1 and Target 2 marked as key levels to watch for the next leg down.
Scenarios
🔴 Bearish (Higher Probability)
Rejection from 115K–116K supply zone (Fib 50–61.8 + channel resistance).
Short-term correction toward 110K, with deeper moves into 107K–105K demand zone.
🟢 Bullish Alternative
Break & close above 116K (channel + supply + 61.8 Fib) would invalidate this setup.
Opens room for a rally toward 120K+, but less likely given RSI divergence and supply pressure.

BTC Outlook: Constructive Above 112k, Risky BelowLast week in my BTC analysis, I mentioned that the price could reverse from the 108k zone. That scenario played out, and while this was a positive development, I also noted that bulls needed to reclaim 112k for a brighter outlook.
The market delivered: BTC not only reversed but also broke back above 112k, pushing as high as just under 115k.
Now, the 112k zone has become crucial for two reasons:
1. If bulls hold above 112k – it confirms strength and validates the recovery as a genuine move higher.
2. If price breaks back below 112k – the recent move above would be revealed as a false upside break, with 115k locked in as a new lower high and a potential descending triangle taking shape.
With this in mind, I remain constructive on BTC. But the message is clear: 112k is the key level that will decide whether momentum continues or fades. 🚀

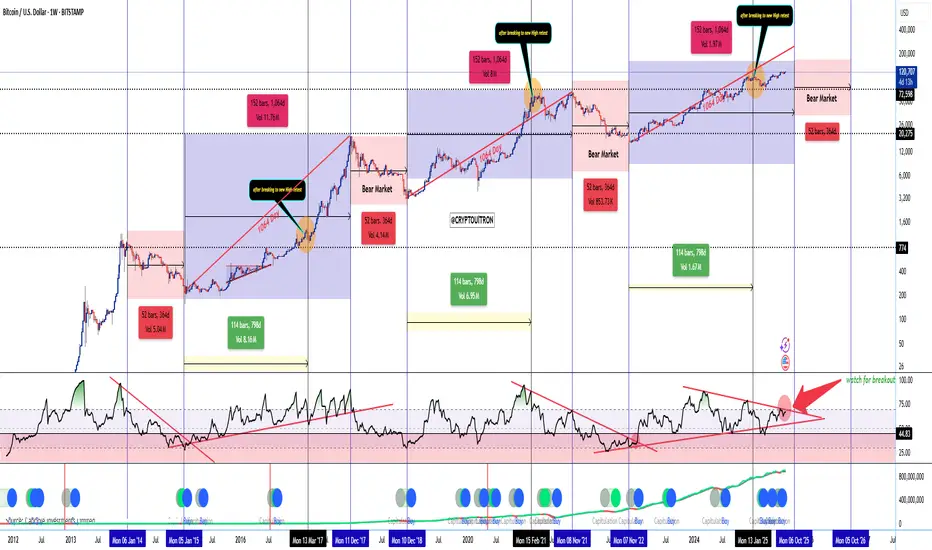
BTC 1W Cycle Map — 1064-Day Cadence Intact (update)📊 BTC 1W Cycle Map — 1064-Day Cadence Intact
🎯 Top window: Week of 06 Oct ’25 (± 1–2 weeks)
🧩 Cycle structure (from chart):
1064-day rhythm to macro top has played out in 2013, 2017, and 2021.
From the Nov ’22 cycle low, the next 1064d lands on Oct ’25 → that’s my projected cycle top zone.
Each cycle shows ATH break → retest → terminal leg before topping. Orange circles = retests. We’ve completed ours.
Bear markets have been rhythmic: ~52 weeks / 364 bars of decline post-top. Marked in red for all past cycles.
📈 RSI setup:
1W RSI downtrend break has always preceded the final blow-off leg.
Currently coiling just under that trendline (big red arrow). A confirmed breakout is my ignition trigger.
🔍 Key chart signals:
Blue/green capitulation buy dots (hash ribbon + cycle models) historically cluster before major legs up, not at tops.
Volume cycles also show ~114 weeks (798 days) of expansion phases between retest and top.
📌 My read:
If RSI fails and price closes <95–100k weekly, I’ll treat it as an early-top scenario.
⏳ Post-top expectations:
~1 year of decline/mean reversion → likely retrace to prior breakout demand (mid-70s to low-80s).
Chart from 2023
BTCUSDT Cut n Reverse Area? what's next??#BTCUSDT - perfect holdings upside as we discussed in our last idear regarding Bitcoin and now market just reached at his ultimate area/region, that is around 107500-700
keep close that region because that is market full n final region for buyers.
dont hold your buying positions below that.
NOTE: we will go for cut n reverse below that that region.
good luck
trade wisely

Bitcoin Bullish Continuation Backed by Weak Dollar and Shutdown BTC/USD is currently trading around 114,300, maintaining its bullish momentum after successfully breaking through the key resistance level at 113,600. This breakout signals growing market confidence and a potential continuation toward the next upside target at 116,200.
🔍 Technical Overview:
Resistance Turned Support: The 113,600 level previously acted as a strong resistance zone but now appears to be providing support, reinforcing the bullish structure.
Trend: The pair remains in a short-term uptrend, supported by higher highs and higher lows on the 4H chart.
Target: Immediate upside target remains at 116,200, where traders should monitor for potential profit-taking or reversal signs.
🌍 Fundamental Drivers:
Weakening US Dollar: A softening dollar is providing broad support to crypto markets, with DXY showing signs of exhaustion amid concerns over interest rate stability.
US Government Shutdown Fears: Investors are beginning to price in the risk of a potential US government shutdown, contributing to increased demand for alternative assets like Bitcoin as a hedge.
Sentiment & Market Outlook:
Market sentiment remains cautiously optimistic, with on-chain data showing steady inflows into BTC. The macroeconomic backdrop, particularly concerns over US fiscal policy and a weaker dollar, is creating a supportive environment for BTC's continued rally.
⚠️ Risk Management:
Watch for any rejection near 116,200, which could prompt short-term consolidation.
A confirmed break back below 113,600 would invalidate the current bullish thesis and may open the door to a deeper pullback.
