BTCBitcoin is expected to extend its bearish move with a potential target around 101,000. This level stands as a significant downside zone in the current Elliott Wave structure. Traders should maintain a cautious bearish bias, watching for short opportunities while monitoring key support areas for possible reversals.
BTCUSD.P trade ideas

BTC – Key Supports Breaking, Bears Gaining ControlAfter reaching a local high around 118K in mid-September, Bitcoin turned lower and yesterday broke decisively below the important 112K support.
The break accelerated the selloff, sending price tumbling into the next key zone around 108,500 – 109,000.
With a clear lower high now in place compared to the 124,500 ATH, the structure doesn’t look favorable for the bulls. On the contrary, there are strong chances of continued downside pressure, with the 100K level standing out as the next major magnet for price.
Trading Plan:
• As long as 112,000 – 112,500 holds as resistance, I maintain a bearish bias.
• The strategy remains to sell rallies into resistance, keeping targets toward 105K and potentially 100K.
• Only a decisive reclaim above 112.5K would weaken the bearish case and force me to reassess.

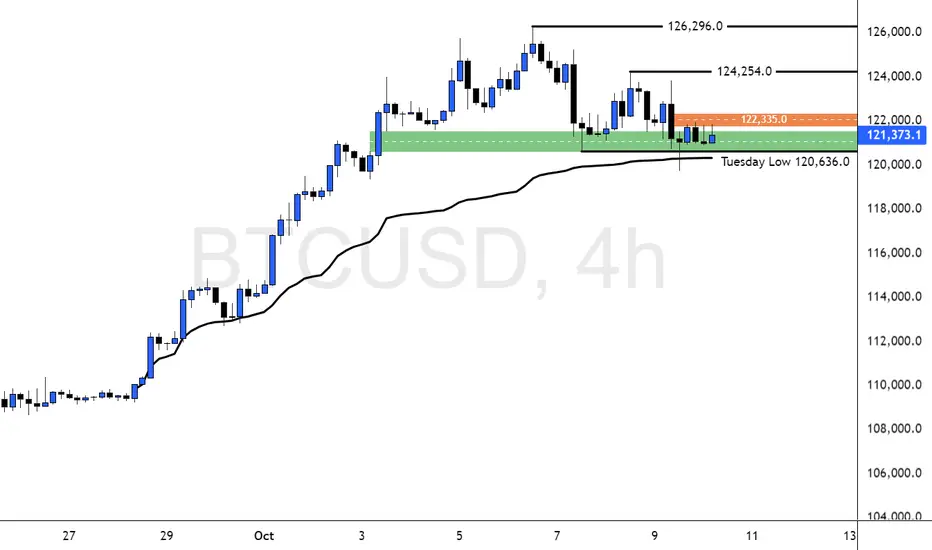
Bitcoin Leaps for a New Bullish Run Above this ResistanceFenzoFx—Bitcoin remains bullish. Yesterday, price dipped below Tuesday’s low, but failed to close beneath it. This support zone is backed by a bullish fair value gap and anchored VWAP from September 28.
Immediate resistance stands at $122,335.0. If bulls close above this level, BTC/USD could target $124,254.0, followed by all-time-high. However, the bullish outlook is invalidated if BTC/USD closes below recent lower lows.
BTC: Range trading & event-driven tradingToday's BTC market demonstrates the dual characteristics of "rallying and then pulling back and range-bound fluctuation". In the short term, it will most likely remain in a range-bound state, and the probability of breaking out of the range before the option expiry is relatively low.
If the U.S. Dollar Index breaks below 99.2, BTC is expected to move upward to test the resistance level; if whales show signs of closing long positions, it may continue to decline.
Given that whales' 40x highly leveraged positions may trigger liquidity squeezes, it is recommended that retail investors limit their leverage ratio to no more than 5x and avoid chasing longs above 121,800.
Based on the current market conditions, it is advisable to adopt a composite strategy of "range trading & event-driven trading".
Buy 120500 - 121000
TP 121500 - 122000
SL 120000
Daily-updated accurate signals are at your disposal. If you run into any problems while trading, these signals serve as a reliable reference—don’t hesitate to use them! I truly hope they bring you significant assistance

Taurus Acquisition Review: Your First Step Into Online TradingFor most beginners entering the world of online investing, the first question is always the same:
Which platform should I trust, and how do I actually start trading safely?
This article walks you through a simple beginner’s roadmap and provides a short, data-based look at Taurus Acquisition — what to know, what to expect, and how to build steady results without unnecessary risks.
Is Taurus Acquisition Legit?
Before trading, every investor asks one crucial question — is this broker trustworthy?
Based on available data and verified user reviews, Taurus Acquisition appears to operate transparently, offering clear deposit and withdrawal terms, responsive support, and solid account security.
That doesn’t mean risk-free trading — but it does provide the level of reliability new traders need to get started. Trust in your broker is the foundation of every trading decision you’ll make later.
Taurus Acquisition Review — What Beginners Should Know
User feedback highlights several advantages that make the platform beginner-friendly:
Simple onboarding – quick registration and verification.
Intuitive interface – essential tools without unnecessary complexity.
Smooth learning curve – allows you to start small and grow gradually.
Active support – real responses, not templates, especially for technical questions.
A Step-by-Step Roadmap for New Traders
Create and Verify Your Account
Registration is fast. Use only official payment methods and complete your KYC verification for smooth future withdrawals.
Make Your First Trades
Start small — focus on liquid assets like Bitcoin or Ethereum.
Avoid chasing “hype coins” early on. Your first goal is to understand execution, not to chase instant profit.
Build Your Position Gradually
Never go all in.
A good rule of thumb: invest 25–30% of your planned capital first, keeping reserves for averaging or adjustments.
Manage Your Risk
Only invest what you can afford to lose.
Always set stop-losses.
Keep your exposure small — 1–2% of your account per trade.
Simple discipline often protects beginners better than any strategy.
Keep a Trading Journal
Record every position — entry, exit, reasoning, and outcome.
A consistent journal turns random trades into a measurable process.
Building Consistency
Sustainable trading isn’t about luck — it’s about repetition and control.
The best traders focus on:
Process over emotion.
Risk management over profit chasing.
Planning and adaptation.
Combine Taurus Acquisition’s tools with structured habits, and you’ll see results grow steadily instead of chaotically.
Today, Taurus Acquisition stands out as a legit and accessible platform for those starting their trading journey.
If you follow a methodical plan — from account setup to journaling and consistent reviews — you give yourself the best chance to grow sustainably.
Remember: markets reward patience, not rush.
Learn, adapt, and think long-term.
That’s how traders evolve from testing platforms to building lasting success.

uptrend Given the price behavior in the current support area, the upward trend is expected to advance to the resistance trend line.
With the support area broken, the continuation of the downward trend is likely.

Bitcoin Bullish Scenario: Bitcoin Bullish Scenario:
*Expecting price to retrace to 50% of current daily trend range and bounce back to may another All time High.
*Purple area is Support for current bullish trend.

BTCUSD Market Analysis (15M Chart)BTCUSD Market Analysis (15M Chart)
🧠 Trade Idea:
Looking for a bullish breakout after minor consolidation. If price sustains
#BTCUSD #BTC #PriceAction #BullishSetup #TechnicalAnalysis

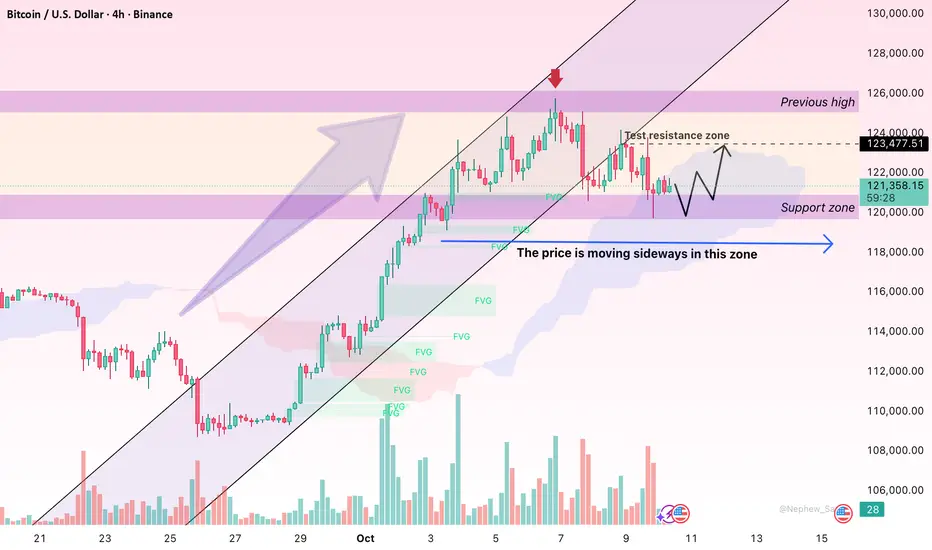
Bitcoin Pauses at $121K: Consolidation Before the Next Big Move?Hello everyone, after reaching a peak of $121,759, Bitcoin (BTC/USDT) is entering a clear sideways phase. The market seems to be taking a breather after a strong rally — as if gathering strength before deciding its next direction. With the US dollar strengthening, investor sentiment turning cautious, and new global regulations emerging, Bitcoin appears to be consolidating rather than weakening.
The recent strength of the USD is the main factor putting pressure on risk assets, including Bitcoin. Following upbeat economic data from the US and hawkish comments from the Fed, the greenback has recovered further, prompting short-term capital to flow out of the crypto market. Historically, when the dollar rises, Bitcoin tends to move sideways or correct slightly — and that pattern has been clearly reflected over the past few sessions.
Market sentiment remains neutral for now. Investors are cautious as the Fed has yet to provide clear guidance on future rate cuts, while several Asian countries — particularly Japan and South Korea — have introduced new regulatory measures for crypto trading. These factors are limiting large inflows, leaving the market lacking fresh upward momentum.
Technically, the 4-hour chart shows Bitcoin fluctuating within a narrow range, facing resistance near $121,760 and support around $120,000. The Fair Value Gaps (FVGs) from the previous rally are gradually being filled, suggesting a possible retest of support before any breakout. The price remains above the Ichimoku cloud, which still signals a medium-term bullish structure, even though the short-term pace has slowed.
Overall, Bitcoin is being held back by three main forces: the strong USD, absence of bullish catalysts, and regulatory caution. However, if the $120,000 support continues to hold, the probability of a rebound remains high — with the next targets around $124,000 to $125,000.
What do you think — is Bitcoin just catching its breath, or preparing for another explosive move?
BTCUSD – Key Decision Zone Forming Between 121.7K–122.3K | Bitcoin is currently retesting a key supply zone around 121.7K–122.3K, aligning with previous structure highs and imbalance.
This zone will likely determine the next major intraday move.
Market Outlook:
📊 Previous Day High: 123,841 – acts as upside liquidity target
🟨 Key Zone: 121.7K–122.3K (potential reaction area)
🧠 Scenarios:
Bullish: Clean break + retest above 122.3K → targets 123.8K
Bearish: Rejection from the zone → move back to 119.7K (previous day low)
⚖️ Bias: Neutral until breakout confirmation
Smart traders will wait for a liquidity sweep + confirmation candle before committing. Stay patient — volatility incoming.

BTC/USD approaches key trendline on daily chartIntroduction
VelorGain reports that the BTC/USD pair is moving closer to a significant trendline on the daily chart, a level that may act as a key point of decision for market direction. The approach toward this technical boundary highlights the balance between continuation and reversal scenarios, as traders monitor whether momentum will sustain a breakout or face rejection.
The proximity of Bitcoin to this structural trendline reflects the broader uncertainty in the digital asset market. While price action has shown resilience, the inability to establish a clear trajectory underscores the cautious sentiment that continues to shape market behavior.
Technology & Innovation
VelorGain applies advanced algorithmic systems and adaptive AI frameworks to identify critical technical structures such as trendlines, confluence zones, and breakout thresholds. The platform’s models integrate data from liquidity flows, order book depth, and historical analogs, recalibrating in real time as volatility and volume shift.
The platform’s design emphasizes layered analytics, where short-term indicators are contextualized within longer-term patterns. By combining machine learning models with traditional chart-based tools such as moving averages and momentum oscillators, VelorGain provides structured insights into the significance of daily chart levels.
An innovative feature of the platform lies in its predictive simulations, which map the probability of breakout or rejection scenarios at critical levels. These tools allow participants to consider multiple outcomes without introducing bias, ensuring that analysis remains neutral. The system’s modular framework further supports scalability across additional asset classes and trading environments, strengthening its role as a versatile analytical solution.
Growth & Adoption
The approach toward a key trendline coincides with growing demand for data-driven insights in digital asset markets. VelorGain has observed steady adoption of structured analytics during phases where technical levels dominate market focus. Such demand reflects the importance of clarity when price action nears decision points.
Scalability has been central to VelorGain’s architecture, enabling seamless integration of new markets, derivatives, and cross-asset correlations. This ensures that as adoption of digital assets accelerates, the platform can continue delivering consistent and precise outputs across increasingly complex trading environments.
User trends suggest that phases of technical inflection often attract higher engagement with analytical tools. Traders and analysts seek greater granularity when market outcomes hinge on well-defined levels such as trendlines. VelorGain’s scalable and adaptive systems address this need, reinforcing its role in providing structure to market interpretation.
Transparency & Risk Management
Transparency and risk awareness remain foundational to VelorGain’s methodology. The platform prioritizes clarity in reporting analytical processes, ensuring that participants can understand how critical levels are identified and how breakout probabilities are modeled. This transparency reduces uncertainty around algorithmic outcomes, enhancing confidence in the system’s reliability.
Risk management frameworks embedded within the platform emphasize the importance of disciplined exposure during phases of technical significance. Approaching key trendlines can increase the likelihood of volatility expansion, and VelorGain’s models track liquidity concentration, potential slippage, and drawdown thresholds to provide context on risk dynamics.
Compliance-aligned structures further reinforce the platform’s credibility. By aligning analytics with evolving regulatory expectations, VelorGain underscores its commitment to accountability and stability in an environment where transparency is increasingly valued.
Industry Outlook
Bitcoin’s approach to a major trendline on the daily chart reflects the market’s cautious stance as it digests prior movements and evaluates future direction. Historically, interactions with long-term structural levels have acted as catalysts for shifts in volatility and sentiment. Whether Bitcoin confirms a breakout or faces resistance, the resolution of this phase is likely to influence broader market behavior.
From a wider industry perspective, the emphasis on structural chart levels highlights the growing role of technical analysis in digital asset markets. Market participants increasingly rely on platforms capable of combining traditional technical frameworks with adaptive, data-driven models. This hybrid approach provides a more balanced perspective in an environment shaped by both chart dynamics and macroeconomic influences.
Bitcoin’s positioning relative to its daily trendline also reflects broader macro uncertainty. Shifts in monetary policy expectations, liquidity flows, and global risk sentiment continue to filter into digital asset markets. As such, the outcome of this technical phase may extend beyond Bitcoin, shaping the performance of correlated assets and sector-wide sentiment.
Looking forward, the industry outlook remains closely tied to how markets interpret key technical boundaries. Consolidation near trendlines often precedes decisive moves, and the market’s reaction at this level may help determine whether momentum resumes upward or transitions into deeper consolidation.
Closing Statement
As market conditions evolve, platforms that emphasize transparency and innovation will be closely watched by traders and investors alike.
Bitcoin technicals suggest market slowdownIntroduction
TPKtrading reports that Bitcoin’s latest technical signals point to a potential slowdown in market activity, with momentum indicators flattening and volatility showing signs of compression. The BTC/USD pair has shifted into a more measured trading phase, where directional conviction remains muted compared with prior sessions.
This pause highlights the market’s adjustment to a balance between demand and supply, as traders and investors weigh broader macroeconomic conditions alongside sector-specific developments. The lack of clear directional bias emphasizes the importance of consolidation phases in framing the next stage of price action.
Technology & Innovation
TPKtrading applies algorithmic and AI-driven methodologies to interpret Bitcoin’s current technical profile. The platform’s models are built to track changes in momentum, volume distribution, and liquidity depth, identifying where signals suggest slowing conditions rather than accelerated trends.
The platform design integrates adaptive analytics that function across multiple timeframes, aligning intraday observations with broader structural movements. Dashboards are modular, combining traditional tools such as moving averages and oscillators with machine learning models that adjust to volatility shifts in real time.
One of the key innovations is the ability to simulate probable outcomes from phases of technical slowdown. By modeling volatility compression and breakout probability distributions, TPKtrading provides structured insights into how sideways or tempered trading environments may evolve. This process ensures that analyses are grounded in objective, data-driven frameworks rather than speculative assumptions.
Growth & Adoption
The detection of a slowdown in Bitcoin’s technical indicators coincides with increased reliance on structured analytics during phases of reduced market activity. TPKtrading has observed a rise in usage of its models during such environments, as participants look for clarity when momentum and volatility decline.
Scalability remains central to the platform’s development strategy. TPKtrading’s infrastructure has been designed to expand beyond Bitcoin into a broad array of digital assets, derivatives, and cross-market analytics. This ensures consistency and accuracy even as adoption broadens and data inputs grow more complex.
User behavior during slowdown phases often reflects a defensive posture. Traders tend to reduce leverage, prioritize capital preservation, and focus on short-term accumulation strategies rather than aggressive positioning. Platforms capable of identifying these patterns and contextualizing them within larger cycles have seen consistent growth in adoption. TPKtrading’s scalable framework is aligned with this demand, ensuring that its insights remain relevant as market participation diversifies.
Transparency & Risk Management
Transparency and risk management form the foundation of TPKtrading’s analytical process. The platform emphasizes open reporting of the criteria used to identify market slowdown signals, reducing the opacity often associated with complex algorithms. This clarity ensures that participants can understand the basis of observed technical outcomes.
Risk management features are integrated throughout the system, highlighting potential risks during periods of reduced momentum. Slowdown phases can often precede sharp volatility when markets exit consolidation. By monitoring drawdown thresholds, support and resistance stability, and liquidity concentration, TPKtrading ensures that risk is clearly contextualized.
Compliance-oriented protocols strengthen this approach by aligning analytical practices with evolving industry standards. This commitment enhances accountability and reinforces trust in the long-term reliability of TPKtrading’s analytics.
Industry Outlook
The suggestion of a market slowdown in BTC/USD reflects a broader trend across digital assets, where periods of reduced activity often occur following volatility expansion. Historically, these phases serve as recalibration points, allowing participants to reassess positioning before the next major directional move.
From a macro perspective, Bitcoin’s measured performance mirrors cautious sentiment in global financial markets. Shifts in monetary policy expectations, liquidity flows, and cross-asset risk appetite continue to influence Bitcoin’s behavior. A prolonged slowdown could extend consolidation, while renewed volatility might emerge from external triggers or internal market dynamics.
The broader industry outlook highlights the growing importance of platforms capable of interpreting slowdown signals within a wider context. Neutral phases demand transparency, adaptability, and discipline, as participants cannot rely solely on momentum-based strategies. TPKtrading’s emphasis on structured and data-driven analysis positions it to provide clarity during these transitional environments.
Looking forward, the resolution of Bitcoin’s current slowdown may carry significant implications. A return of volatility could drive decisive breakouts or breakdowns, while an extended range-bound environment may reinforce defensive trading strategies. In either case, the current slowdown phase is an important reference point for understanding the market’s next stage.
Closing Statement
As market conditions evolve, platforms that emphasize transparency and innovation will be closely watched by traders and investors alike.

BTC/USD holds steady despite market uncertaintyIntroduction
Solr reports that the BTC/USD pair continues to hold steady in the face of broader market uncertainty. Recent sessions have highlighted a period of limited directional movement, with Bitcoin maintaining stability within a defined range. This steady performance underscores a cautious balance between buyers and sellers, as the market awaits new catalysts to establish momentum.
Despite fluctuations in risk sentiment across global assets, Bitcoin’s resilience within its current range suggests a phase of consolidation rather than decisive trend formation. The muted volatility reflects ongoing hesitancy among participants, as macroeconomic factors and sector-specific developments remain unresolved.
Technology & Innovation
Solr employs algorithmic intelligence and adaptive data frameworks to monitor the stability of BTC/USD in uncertain conditions. The platform’s models track liquidity flows, sentiment patterns, and technical levels to detect shifts in consolidation phases. These systems are designed to adapt in real time, recalibrating when volatility compresses or expands.
The platform’s design emphasizes modular analytics, combining short-term price action with broader structural insights. By layering traditional technical models such as moving averages, oscillators, and volume analysis with AI-driven pattern recognition, Solr delivers a balanced view of both immediate market action and longer-term positioning.
Key innovations include predictive scenario modeling, which allows the simulation of potential outcomes under varying conditions of volatility and liquidity. By offering probability-based perspectives on breakout or continuation scenarios, Solr provides structured insights without bias toward a specific direction. This neutral, data-driven approach reflects the increasing demand for clarity in uncertain environments.
Growth & Adoption
The persistence of steady ranges in BTC/USD coincides with increased adoption of advanced market analytics. Solr has observed growing reliance on its tools during consolidation phases, as traders and analysts seek guidance when markets lack clear momentum. Periods of uncertainty often heighten the value of structured analytics, as participants turn to data to frame expectations.
Scalability underpins the platform’s development strategy. Solr’s infrastructure supports the addition of new assets, derivatives, and cross-market indicators while maintaining speed and precision. This ensures consistent delivery of insights as user demand expands and as digital asset markets become increasingly interconnected with broader financial systems.
User trends reflect a cautious stance, with many participants positioning defensively during market uncertainty. Incremental accumulation, reduced leverage, and shorter holding periods are common characteristics of this environment. Platforms that can detect these behavioral patterns and provide transparent analysis of their implications have seen stronger adoption, underscoring the importance of scalability and adaptability.
Transparency & Risk Management
Transparency and risk management remain central to Solr’s framework. The platform emphasizes clear reporting of its analytical methodologies, ensuring that users understand how outcomes such as consolidation zones, volatility shifts, and breakout scenarios are derived. This commitment to clarity reduces opacity in modeling and strengthens confidence in the reliability of the insights provided.
Risk management tools embedded in the system highlight the importance of monitoring volatility compression, liquidity concentration, and drawdown risk. In environments defined by uncertainty, the potential for abrupt changes remains elevated even as price action appears stable. Solr’s systems are designed to identify these inflection points early, offering context on how risk dynamics may evolve as conditions shift.
Compliance-oriented processes further reinforce the platform’s accountability. By aligning with industry standards in transparency and structured reporting, Solr ensures that its analytics meet expectations of both professional and retail market participants. This alignment reflects the sector’s broader trend toward emphasizing stability, discipline, and trust in digital asset analysis.
Industry Outlook
The steady behavior of BTC/USD amid uncertainty reflects a broader pattern in the digital asset market. Consolidation phases often occur when participants pause to reassess exposure, awaiting macroeconomic clarity or sector-specific developments before committing to directional positions. Historically, such periods have served as precursors to renewed volatility.
From a wider perspective, Bitcoin’s stability in recent sessions underscores its growing role as a barometer of sentiment across the asset class. The muted volatility mirrors broader caution in global financial markets, where liquidity conditions and monetary policy expectations continue to shape risk appetite. Whether the consolidation phase resolves upward or downward, the current range has become a reference point for market participants.
Platforms like Solr play a significant role in contextualizing these phases. By providing neutral, transparent, and adaptive analysis, they help frame market behavior without speculative bias. This capacity is particularly valuable during uncertain periods, where clarity and discipline are essential.
The resolution of Bitcoin’s current range will likely influence broader sector sentiment. A breakout to the upside could signal renewed momentum, while a failure at resistance may extend consolidation or invite corrective pressure. Regardless of the outcome, the ongoing phase illustrates how digital asset markets often move through cycles of volatility expansion and compression.
Closing Statement
As market conditions evolve, platforms that emphasize transparency and innovation will be closely watched by traders and investors alike.

BTC/USD remains range-bound amid market pauseIntroduction
Scholz reports that the BTC/USD pair continues to trade within a narrow range, reflecting a pause in market momentum after recent periods of heightened volatility. This consolidation highlights the balance between bullish and bearish forces, with neither side asserting a decisive breakout.
The range-bound structure underscores the market’s cautious stance, as traders await stronger catalysts to define Bitcoin’s next directional move.
Technology & Innovation
Scholz integrates algorithmic intelligence and advanced data-driven systems to analyze how range-bound markets form and evolve. The platform’s design emphasizes real-time adjustments through adaptive AI models that evaluate liquidity dynamics, sentiment shifts, and price clustering.
Key technological features include layered dashboards that merge traditional technical indicators with machine learning analytics. This approach allows for a precise view of how resistance and support zones interact under varying market conditions. By mapping intraday order book flows alongside long-term structural trends, Scholz provides clarity during phases of low volatility where price compression often precedes breakout events.
The modular architecture of the platform allows for seamless scalability, extending analysis beyond BTC/USD into other major currency pairs and correlated assets. This adaptability ensures consistent insights while accommodating the evolving complexity of digital asset markets.
Growth & Adoption
The persistence of range-bound conditions in Bitcoin reflects a phase where traders and analysts increasingly rely on structured insights. Scholz has observed consistent growth in the use of its tools during consolidation phases, as participants seek clarity when directional conviction is limited.
Scalability plays a key role in this trend. The platform has been designed to handle expansion across additional assets, derivatives, and macro indicators without sacrificing efficiency. This expansion aligns with broader market adoption trends, where institutional and retail users demand analytics that function seamlessly across a growing spectrum of digital instruments.
User behavior indicates that range-bound phases are often characterized by cautious positioning and incremental accumulation strategies. Platforms capable of capturing these subtle shifts remain central to helping participants navigate quieter markets without overlooking potential breakout triggers.
Transparency & Risk Management
Transparency and disciplined risk management remain central to Scholz’s approach. The platform emphasizes clarity in algorithmic interpretations, ensuring that the process behind identifying support, resistance, and consolidation zones is openly communicated.
By reducing the opacity associated with complex modeling, Scholz provides participants with confidence in the integrity of its analytics. Risk management frameworks are embedded throughout the platform, focusing on volatility assessment, liquidity concentration, and drawdown monitoring.
In the current BTC/USD range, these tools highlight the potential for volatility compression and subsequent expansion—a dynamic often seen at the conclusion of prolonged pauses. Scholz’s disciplined approach ensures that risk remains a priority even when markets appear subdued.
Compliance-aligned structures further reinforce the platform’s methodology. By adhering to emerging standards in transparency and accountability, Scholz strengthens its positioning as a reliable provider of structured insights within a developing regulatory environment.
Industry Outlook
The current range-bound stance of BTC/USD is reflective of broader trends in the digital asset sector. Periods of consolidation often occur when markets digest prior movements and await fresh drivers. Whether the eventual breakout occurs to the upside or downside, these phases typically set the stage for renewed volatility.
From a wider perspective, Bitcoin’s consolidation mirrors broader macroeconomic uncertainty, including interest rate expectations, liquidity conditions, and risk sentiment across global markets. As such, the behavior of BTC/USD within its defined range is not only relevant to cryptocurrency traders but also to market participants tracking correlations with traditional assets.
Platforms like Scholz, which emphasize adaptive analytics, play an increasingly important role during these neutral phases. Identifying the boundaries of range conditions and monitoring for signs of momentum shifts provides participants with structured perspectives in an environment often characterized by indecision.
Long-term, the resolution of Bitcoin’s current range is likely to influence sentiment across the wider digital asset sector. A breakout above resistance could reinforce confidence in bullish momentum, while a rejection at key levels may extend the consolidation or trigger corrective phases.
In either scenario, the range serves as a critical reference point for market participants.
Closing Statement
As market conditions evolve, platforms that emphasize transparency and innovation will be closely watched by traders and investors alike.

BTC/USD faces resistance near trendline confluenceIntroduction
Scandindex reports that the BTC/USD pair is encountering notable resistance at a trendline confluence zone, highlighting a technical juncture that may determine the near-term trajectory of the market. While underlying sentiment remains cautious, the convergence of technical levels has drawn attention to the possibility of constrained upside momentum in the current session.
Market participants continue to monitor how Bitcoin reacts to these structural levels, as the consolidation phase provides insights into both short-term volatility and longer-term positioning.
Technology & Innovation
Scandindex integrates algorithmic frameworks and AI-driven tools to interpret trendline interactions, confluence zones, and liquidity clusters with precision. These analytical systems are designed to adjust in real time, capturing both macro and micro shifts in order flow and price behavior. By combining traditional technical models with adaptive machine learning, the platform provides structured assessments of how resistance and support levels interact under varying conditions.
The platform’s design emphasizes modularity, allowing its core analytics to expand across multiple trading pairs while preserving accuracy in BTC/USD—the market’s primary reference point. Proprietary algorithms highlight where significant confluence points align with broader market momentum, providing traders and observers with contextual insights into prevailing market patterns.
This dual approach of technical mapping and AI adaptation underscores the increasing relevance of hybrid analytical tools in navigating a maturing digital asset landscape.
Growth & Adoption
The neutral to mildly cautious stance in BTC/USD coincides with a period of steady growth in demand for structured market intelligence. Scandindex has observed increased reliance on advanced analytics from both institutional and retail participants, particularly in environments where resistance zones and consolidation phases dominate.
As the market matures, participants increasingly seek platforms that can scale insights across volatile regimes without compromising analytical clarity. Scandindex’s scalable infrastructure accommodates expanding coverage across digital assets while maintaining robust performance in high-volume environments.
This scalability reflects broader industry adoption trends, where traders and analysts expect analytical tools not only to cover Bitcoin but also to integrate seamlessly across multiple correlated markets. As adoption grows, platforms that can balance depth, accuracy, and adaptability remain central to supporting more informed decision-making.
Transparency & Risk Management
Transparency and risk management remain critical elements as the market encounters resistance at structural levels. Scandindex prioritizes clear reporting of algorithmic outcomes, ensuring that interpretations of trendline confluence zones are presented in a manner that avoids opacity.
By structuring outputs that detail both the methodologies and data inputs behind key findings, the platform reinforces the importance of analytical accountability. Risk management frameworks embedded within the platform emphasize the monitoring of volatility clusters, liquidity imbalances, and drawdown thresholds.
In the case of BTC/USD approaching resistance, such frameworks are particularly relevant as traders assess whether momentum can sustain a break higher or if the market is more likely to consolidate further. This disciplined approach reflects the industry’s broader recognition that transparent, risk-aware systems are essential for navigating uncertainty in digital asset markets.
Compliance-oriented protocols further support the platform’s risk practices, aligning analytical methodologies with emerging regulatory expectations. This integration reinforces the credibility of structured insights and enhances long-term confidence among participants engaging with high-volatility assets like Bitcoin.
Industry Outlook
The current resistance at trendline confluence for BTC/USD highlights the ongoing balance between optimism and caution in the cryptocurrency market. From a technical perspective, such zones often serve as inflection points, where the resolution can dictate the direction of medium-term momentum.
Neutrality in sentiment, combined with constrained volatility, underscores the possibility of a consolidation phase before more decisive price action unfolds. Within the broader market, confluence-based resistance has historically coincided with periods of recalibration, where participants reassess exposure and await macro or on-chain catalysts.
Platforms like Scandindex, which emphasize structured, transparent, and adaptive analytics, are positioned to provide valuable insights during these phases. The emphasis remains on observing how liquidity, sentiment, and global financial conditions interact to shape Bitcoin’s next directional move.
In the context of the wider digital asset landscape, the ability to identify resistance and support levels with precision has become increasingly important. As more capital enters the sector, market participants require tools that can navigate both microstructural technicals and broader systemic shifts.
The present resistance zone serves as a reminder of how pivotal technical confluence can be in framing market narratives.
Closing Statement
As market conditions evolve, platforms that emphasize transparency and innovation will be closely watched by traders and investors alike.

Bitcoin trading range remains tightIntroduction
OYO Finance reports that the BTC/USD pair continues to trade within a narrow range, reflecting a subdued phase in market activity. Despite recent fluctuations, price action has remained confined, with volatility showing signs of compression compared to prior periods.
This development highlights the cautious stance of market participants as they await new catalysts to provide clearer directional momentum. The tight range illustrates the balance between accumulation and distribution, suggesting that traders are weighing broader macroeconomic conditions and sector-specific developments before committing to larger positions.
Technology & Innovation
OYO Finance applies algorithmic intelligence and adaptive analytics to monitor Bitcoin’s evolving trading ranges. Its systems are designed to capture periods of volatility contraction and assess the probability of breakout scenarios. By analyzing liquidity concentrations, order book depth, and momentum signals, the platform identifies structural dynamics that underpin range-bound trading.
The platform architecture emphasizes layered analytics, combining traditional tools—such as moving averages, oscillators, and support-resistance mapping—with AI-driven models that recalibrate in real time. This ensures that insights remain responsive as market conditions shift.
An innovative component of OYO Finance’s approach is scenario-based modeling. These simulations test potential outcomes of prolonged tight ranges, projecting the likelihood of volatility expansion and directional movement. By grounding the models in both historical analogs and real-time conditions, the platform provides neutral, data-driven perspectives on how consolidation phases may resolve.
Growth & Adoption
The persistence of Bitcoin’s tight trading range coincides with growing adoption of structured analytics across the digital asset space. OYO Finance has observed that during periods of reduced volatility, traders and analysts turn more frequently to disciplined frameworks to interpret price behavior and prepare for potential transitions.
Scalability underpins the platform’s development strategy. OYO Finance’s systems support expansion into multiple asset classes, derivative products, and cross-market analytics, ensuring consistent delivery of insights across increasingly interconnected markets. This adaptability is critical as digital asset adoption continues to accelerate globally.
User activity patterns suggest that tight trading ranges often lead to cautious positioning, with strategies focusing on risk management, incremental accumulation, or shorter-term trades. Platforms capable of detecting these behavioral adjustments and contextualizing them within larger market cycles have seen consistent adoption. OYO Finance’s scalable and adaptable framework reflects this demand.
Transparency & Risk Management
Transparency and disciplined risk practices remain at the core of OYO Finance’s methodology. The platform emphasizes clarity in explaining how trading ranges are identified and how breakout probabilities are modeled. By reducing opacity in algorithmic outputs, the system builds confidence in its analytical outcomes.
Risk management frameworks embedded in the platform focus on monitoring liquidity stress points, volatility compression, and potential expansion triggers. Tight ranges can often precede sharp moves, making risk awareness essential. OYO Finance’s systems track drawdown thresholds, support-resistance durability, and liquidity imbalances, ensuring participants understand potential risks in subdued environments.
The platform also integrates compliance-aligned processes that reinforce accountability and align analytics with emerging industry standards. This approach reflects the sector’s broader trend toward transparency and disciplined practices, particularly as institutional adoption grows.
Industry Outlook
Bitcoin’s current tight trading range reflects a broader period of recalibration across the digital asset sector. Historically, phases of compressed volatility have acted as precursors to more significant moves, with breakout direction often shaped by macroeconomic developments and liquidity trends.
From a macro perspective, the subdued trading conditions mirror uncertainty in global financial markets. Monetary policy expectations, liquidity availability, and risk appetite across asset classes continue to play a central role in shaping cryptocurrency price action. Bitcoin’s limited range therefore reflects both internal structural dynamics and external influences.
The industry outlook emphasizes the increasing relevance of platforms capable of contextualizing tight ranges within broader cycles. Neutral, data-driven insights are critical during such phases, as speculative assumptions can misrepresent risk and opportunity. OYO Finance’s emphasis on transparency and innovation underscores the shift toward more disciplined frameworks across the industry.
Looking ahead, the resolution of Bitcoin’s tight range will likely provide clarity on the next stage of market activity. A breakout above resistance could reinforce bullish sentiment, while failure to sustain upward momentum may extend consolidation or invite corrective pressures. Regardless of direction, the persistence of the tight range highlights the cyclical nature of digital assets, where compression often precedes expansion.
Closing Statement
As market conditions evolve, platforms that emphasize transparency and innovation will be closely watched by traders and investors alike.

BTC/USD faces overhead resistance zoneIntroduction
Niagara Hub reports that the BTC/USD pair is approaching an overhead resistance zone, a level that has capped price advances in recent sessions. While Bitcoin has maintained relative stability, upside momentum has struggled to extend beyond this structural boundary, reflecting a cautious market stance.
The presence of overhead resistance underscores the importance of technical levels in shaping sentiment. Traders remain focused on whether Bitcoin can sustain a breakout above resistance or if renewed selling pressure will extend the consolidation phase. This juncture highlights the balance between optimism for continuation and the potential for corrective moves.
Technology & Innovation
Niagara Hub integrates algorithmic intelligence and adaptive analytics to identify and evaluate resistance zones. The platform’s systems track liquidity concentrations, order flow dynamics, and historical analogs to determine where price barriers are likely to emerge and how they may influence market behavior.
The platform architecture emphasizes layered analytics across multiple timeframes. Traditional chart-based methods—such as moving averages, trendlines, and oscillators—are paired with AI-driven models that recalibrate in real time as volatility and liquidity conditions shift. This ensures that signals around resistance zones remain current and responsive to evolving conditions.
An innovative feature of Niagara Hub’s system is probability-based simulation modeling. By running scenarios under varying volatility and liquidity environments, the platform highlights the likelihood of breakout or rejection at resistance levels. This structured approach provides participants with neutral insights grounded in both historical precedent and real-time market inputs.
Growth & Adoption
The test of overhead resistance in Bitcoin coincides with increased adoption of structured analytics in digital asset markets. Niagara Hub has observed heightened engagement with its platform during phases where price action is concentrated near critical levels, as traders seek clarity when directional conviction is limited.
Scalability has been built into the platform’s infrastructure. Niagara Hub supports expansion across multiple asset classes, derivative markets, and macroeconomic indicators, allowing consistent delivery of insights in increasingly interconnected environments. As digital asset adoption continues to broaden, the ability to scale analysis without compromising precision remains a central advantage.
User behavior patterns suggest that during resistance tests, market participation tends to intensify. Traders adjust exposure quickly in response to breakouts or rejections, creating volatility spikes. Platforms that can capture these dynamics with neutrality and transparency have seen steady growth in adoption. Niagara Hub’s scalable framework is designed to meet this demand, providing consistent analysis during pivotal market phases.
Transparency & Risk Management
Transparency and disciplined risk practices form the foundation of Niagara Hub’s methodology. The platform emphasizes clarity in explaining how resistance zones are identified and how breakout probabilities are modeled, reducing the opacity often associated with complex algorithmic outputs. This fosters greater trust in the integrity of the analysis.
Risk management frameworks are deeply integrated into the platform. Overhead resistance zones often serve as inflection points where volatility expands and liquidity becomes fragmented. Niagara Hub’s models monitor drawdown thresholds, liquidity stress points, and potential breakout failure scenarios to provide participants with a clear picture of risk dynamics.
The platform also aligns with compliance-oriented processes, ensuring that analytical methods are consistent with emerging industry standards. By prioritizing transparency and accountability, Niagara Hub underscores its commitment to reliable, risk-aware analytics in the digital asset sector.
Industry Outlook
Bitcoin’s challenge at overhead resistance reflects a broader theme in the digital asset industry: the importance of structural technical levels in shaping sentiment and guiding positioning. Historically, resistance zones have acted as key markers, with confirmed breakouts often driving momentum higher, while rejections reinforce consolidation or trigger corrections.
From a macroeconomic perspective, Bitcoin’s current struggle highlights the sensitivity of digital assets to external conditions. Shifts in monetary policy expectations, liquidity availability, and global investor sentiment continue to filter into cryptocurrency markets. Resistance zones, therefore, serve as more than technical levels—they represent decision points for broader risk appetite.
The industry outlook emphasizes the growing importance of platforms that can contextualize these technical phases with clarity and neutrality. As adoption expands, participants increasingly rely on data-driven insights rather than speculative narratives. Niagara Hub’s focus on transparency, innovation, and scalability reflects this evolution in digital asset analysis.
Looking ahead, the resolution of Bitcoin’s interaction with its overhead resistance zone will likely set the tone for the next phase of market activity. A successful breakout could reinforce optimism and extend momentum, while failure at resistance may deepen the current range or trigger corrective selling. Either scenario demonstrates the cyclical nature of digital assets, where resistance levels often mark pivotal turning points.
Closing Statement
As market conditions evolve, platforms that emphasize transparency and innovation will be closely watched by traders and investors alike.

BTC/USD bears lose momentum in sideways marketIntroduction
MetaQuora reports that the BTC/USD pair is showing signs of reduced bearish momentum, with recent sessions characterized by sideways trading. The market has transitioned into a consolidation phase, where downside pressure has eased but no clear bullish reversal has yet materialized.
The current range-bound structure reflects a balance of forces between buyers and sellers. Bears appear to have lost some momentum after previous attempts to drive the market lower, while bulls remain cautious, waiting for clearer signals before committing to more aggressive positioning. This pause underscores a period of uncertainty, where the market is recalibrating after prior volatility.
Technology & Innovation
MetaQuora leverages algorithmic intelligence and adaptive data analytics to track shifts in momentum during sideways market phases. The platform’s systems are designed to identify transitions from bearish dominance into neutral or consolidative structures, highlighting when momentum signals are weakening.
The platform integrates layered dashboards that combine traditional technical indicators—such as moving averages, oscillators, and volume patterns—with AI-driven models that continuously adjust to volatility shifts. This dual approach provides structured insights into how momentum loss translates into consolidation across different timeframes.
An innovative aspect of the platform is its scenario-based simulation tools. These models test potential outcomes of extended sideways markets, assessing probabilities for eventual breakout or continuation of the prior trend. By grounding simulations in both historical data and real-time market flows, MetaQuora delivers adaptive insights into how neutrality may evolve.
Growth & Adoption
The appearance of reduced bearish momentum in Bitcoin coincides with increasing reliance on structured analytics across the digital asset sector. MetaQuora has observed growing engagement with its tools during periods of consolidation, as participants look for clarity when directional conviction is limited.
Scalability is a central feature of the platform. MetaQuora’s infrastructure supports analysis across a wide range of digital assets, derivatives, and macro-linked instruments, ensuring consistency as market adoption broadens. This flexibility reflects the growing complexity of digital markets, where participants demand tools that adapt seamlessly across multiple instruments.
User behavior during sideways phases suggests a preference for defensive positioning and shorter holding periods. Incremental accumulation and reduced exposure to leverage are common strategies in these environments. Platforms that can contextualize such behaviors within larger cycles have seen steady growth in adoption. MetaQuora’s scalable and adaptable design aligns with this trend, reinforcing its role in helping participants navigate uncertain markets.
Transparency & Risk Management
Transparency and disciplined risk practices remain central to MetaQuora’s methodology. The platform emphasizes clarity in reporting analytical outcomes, ensuring that participants understand how momentum shifts are identified and how consolidation signals are interpreted. This transparency reduces opacity and enhances confidence in the integrity of the analysis.
Risk management frameworks embedded in the platform focus on volatility compression, liquidity stress points, and drawdown thresholds. Sideways markets may appear stable but often precede sharp expansions in volatility once consolidation resolves. MetaQuora’s systems track these inflection points, framing risks within clear parameters and allowing participants to better understand potential outcomes.
Compliance-aligned processes reinforce accountability, ensuring that the platform’s analytics align with evolving industry standards. This structured approach reflects a broader industry focus on transparency and risk-aware practices in digital assets.
Industry Outlook
The weakening of bearish momentum in BTC/USD highlights a broader recalibration in the digital asset market. Sideways conditions often arise when traders reassess exposure and await catalysts to drive directional momentum. These phases are historically important, as they frequently precede volatility expansions that reshape market sentiment.
From a macroeconomic perspective, Bitcoin’s sideways posture mirrors broader uncertainty in global financial markets. Shifts in monetary policy, liquidity availability, and investor sentiment continue to influence digital assets. While bears have lost some control, the absence of a decisive bullish breakout reflects ongoing caution across the sector.
The industry outlook underscores the importance of platforms capable of interpreting neutrality and momentum shifts with objectivity. As digital assets mature, the demand for structured, transparent analytics has grown, particularly during periods of indecision. MetaQuora’s emphasis on combining traditional and algorithmic analysis illustrates this trend, providing clarity without speculative bias.
Looking ahead, the resolution of Bitcoin’s current sideways structure will likely shape broader sector dynamics. A breakout above resistance could signal renewed bullish momentum, while failure to sustain stability may invite another wave of corrective pressure. Regardless of direction, the present environment highlights the cyclical nature of digital assets, where periods of consolidation often serve as precursors to decisive moves.
Closing Statement
As market conditions evolve, platforms that emphasize transparency and innovation will be closely watched by traders and investors alike.

Bitcoin short-term charts show sideways trendIntroduction
MDC reports that Bitcoin’s short-term charts indicate a sideways trend, reflecting the ongoing balance between buyers and sellers in a subdued trading environment. Price action remains confined within a relatively narrow range, with volatility showing signs of compression compared to prior sessions. This development suggests a period of indecision in the market, where directional momentum has yet to reassert itself. Sideways movement on shorter timeframes often serves as a precursor to larger shifts, making this phase an important area of observation for market participants.
Technology & Innovation
MDC’s approach to analyzing short-term charts is supported by advanced algorithmic frameworks and machine learning models. These systems are designed to identify and quantify range-bound conditions, track liquidity dynamics, and detect subtle shifts in momentum that may precede breakouts. By integrating adaptive analytics with traditional technical tools, the platform provides structured insights into how Bitcoin behaves within consolidation zones.
The platform’s design emphasizes modularity, with dashboards that incorporate both real-time price action and longer-term structural patterns. This layered approach enables the identification of when short-term sideways trends align—or diverge—from medium- or long-term market signals. MDC’s algorithmic models are capable of updating in real time, ensuring that shifts in order flow, sentiment indicators, and volatility profiles are captured promptly.
An additional innovation lies in MDC’s ability to simulate breakout scenarios from sideways trends. By modeling probability distributions of potential outcomes, the platform offers contextual perspectives on risk-adjusted possibilities without assigning directional bias. This analytical neutrality reflects the increasing importance of transparency and objectivity in a maturing digital asset environment.
Growth & Adoption
The current sideways trend in Bitcoin aligns with an environment where market participants are increasingly relying on structured tools to navigate uncertain conditions. MDC has observed steady adoption of its analytics during phases of consolidation, as traders and analysts look for clarity in markets characterized by limited directional movement.
Scalability underpins the platform’s growth trajectory. MDC’s infrastructure supports expansion into multiple asset classes while maintaining performance across high-frequency data streams. This capacity ensures that as adoption of digital assets broadens, the platform can continue to deliver consistent insights to a diverse user base.
User activity patterns indicate that during sideways phases, participants often shift toward incremental positioning and accumulation strategies. Platforms capable of detecting these subtle behavioral shifts are becoming more widely integrated into trading processes, reflecting the industry’s broader move toward data-driven decision-making. MDC’s scalable architecture is designed to meet this evolving demand, supporting both retail and institutional use cases.
Transparency & Risk Management
Transparency and risk management remain at the core of MDC’s methodology. The platform places emphasis on presenting analytical outcomes with clarity, ensuring that the process behind identifying sideways trends and potential breakout conditions is fully traceable. This reduces opacity and enhances confidence in the analytical framework.
Risk management tools embedded in the system highlight volatility compression and expansion dynamics. Sideways trends, while seemingly quiet, often precede significant volatility when breakouts occur. MDC’s risk frameworks emphasize the importance of monitoring liquidity stress points, support and resistance zones, and drawdown parameters during these transitional phases.
In addition, the platform incorporates compliance-oriented reporting protocols. By aligning with emerging standards, MDC ensures that its analytics maintain accountability and reliability. This structured approach underscores the importance of risk-aware decision-making, particularly in an asset class where rapid shifts can significantly alter market conditions.
Industry Outlook
Bitcoin’s sideways movement on short-term charts mirrors a broader phase of hesitation across digital asset markets. The balance of forces currently limiting volatility reflects market participants’ cautious stance as they weigh macroeconomic signals, liquidity conditions, and upcoming sector developments. Historically, periods of reduced volatility often serve as staging grounds for larger directional moves, reinforcing the importance of monitoring the present consolidation.
From an industry perspective, the persistence of sideways trends highlights the increasing relevance of platforms that can provide structured, adaptive, and transparent analytics. Neutral phases can be challenging to interpret, yet they frequently set the tone for the next leg of market activity. By contextualizing short-term ranges within longer-term cycles, platforms like MDC contribute to a deeper understanding of how these pauses fit into broader market narratives.
The digital asset sector remains interconnected with global macro trends, including monetary policy shifts, risk appetite across traditional markets, and evolving regulatory landscapes. In this context, the resolution of Bitcoin’s current sideways phase may hold implications not only for BTC/USD but also for correlated digital assets and related investment flows. The market’s ability to transition from compression to expansion will be closely observed in the sessions ahead.
Closing Statement
As market conditions evolve, platforms that emphasize transparency and innovation will be closely watched by traders and investors alike.

BTC/USD - Bearish Channel, new opportunity (2025.10.10)Great day ahead to all !!!
BTC/USD appears to have developed a Bearish Channel.
Continuously Bearish Trend line
Prices are reversing and retesting the resistance zone
Potential Lead to a continuous Bearish movement
Suggested Set Up : SELL
Entry :Enter at Resistance zone area + a confirmation candle
1st Target : 120780
2nd Target : 119685
Stop Lose : 123820
If this breakdown helped clarify your view, please consider liking, commenting, and following for more updates!
Crucial Reminder: Always prioritize risk management and wait for clear candlestick confirmation before entering a trade.
Disclaimer: This analysis is for educational purposes only and should not be considered financial advice. Trade responsibly and at your own risk.
Thank & Regards,
OneBo Trading
#BTC #Breakout #Analysis #PriceAction #ForexTrading #SwingTrading #TechnicalAnalysis #OneBo_Trading

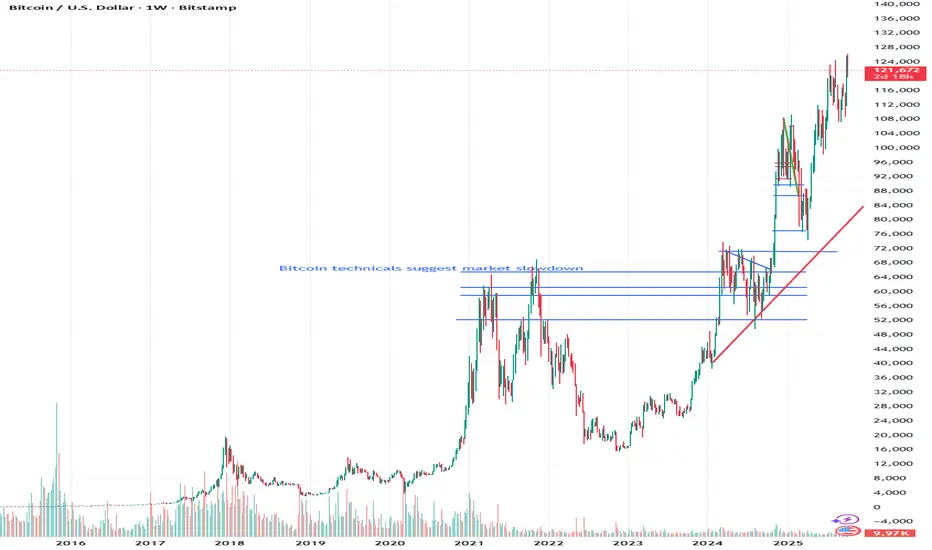
Bitcoin: Key Levels and a Crucial Moment AheadBitcoin has been stuck in a sideways range since July 2025, holding a strong support around $108K and facing tough resistance near $124K.
To make things more interesting, the uptrend that started back in 2022 is now converging right at that same support area around $108K, and just a few days ago, we highlighted the potential buy opportunity this could represent.
✅ That opportunity has already delivered +12% gains in just a few days, with very limited risk.
If Bitcoin breaks above $124K , we should look toward the next resistance zones, currently around $142K and $163K . These aren’t random levels; they align perfectly with the long-term pattern Bitcoin has been forming for years, where support and resistance appear roughly every +14% move. You can see all these levels clearly marked on the attached chart, and you’ll notice how consistently they’ve held.
⚠️ However, as I’ve been warning for months, a breakdown below $108K would be a major red flag for the bullish trend. Returning to a previous accumulation zone is one of the strongest bearish signals, which could lead, at best, to months of sideways movement, or more typically, to a sharp correction that would still fit neatly within Bitcoin’s historical cycles.

Bitcoin 1470 dayish cycle coming to an endFall to $50k-$60k unless some kind of government policy changes the narrative. It doesnt look that price will increase past the end of the of the year. Historically followed by a 350 dayish fall of maybe 70%.

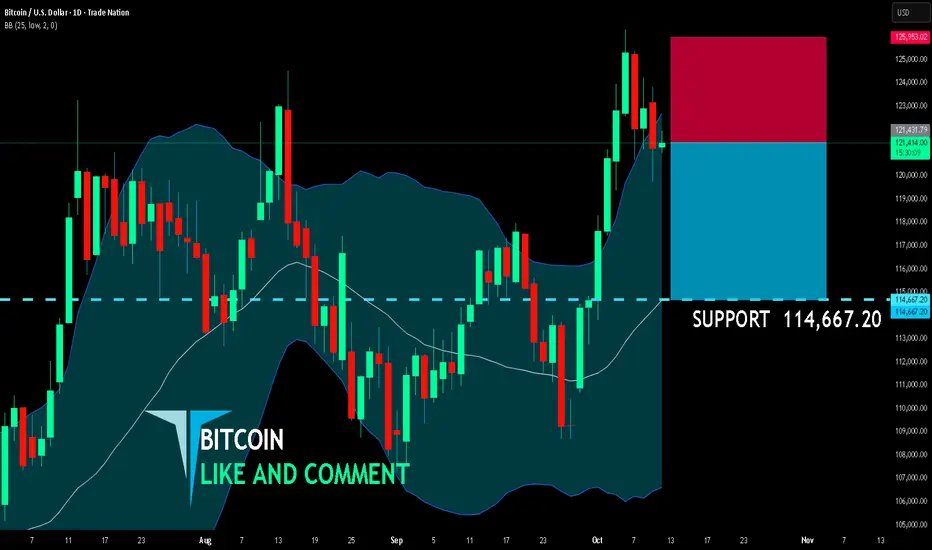
BITCOIN SENDS CLEAR BEARISH SIGNALS|SHORT
BITCOIN SIGNAL
Trade Direction: short
Entry Level: 121,431.79
Target Level: 114,667.20
Stop Loss: 125,953.02
RISK PROFILE
Risk level: medium
Suggested risk: 1%
Timeframe: 1D
Disclosure: I am part of Trade Nation's Influencer program and receive a monthly fee for using their TradingView charts in my analysis.
✅LIKE AND COMMENT MY IDEAS✅