Another Day, Another All-Time High (Boring)Another Day, Another All-Time High 🥇📈
POV: You’re Bitcoin… and breaking world records isn’t an anomaly — it’s a schedule. 💼
From $124,128 (August high) ➜ $125,000 during Asia hours (Oct 5) ➜ $126,000 in U.S./EU session (Oct 6).
In between? $100M+ in shorts liquidated in under an hour .
$50B+ in 24h volume . The market didn't blink. 😮💨
Like Mondo Duplantis, the pole vault king who's broken the world record 14 times — always by 1cm —
Bitcoin doesn’t leap to impress…
It just keeps clearing the next bar.
Some assets peak once and call it a legacy.
Bitcoin? It redefines the ceiling weekly — just like Mondo.
📊 $126K is the new record.
🔜 $129K tagged as “Next ATH” on the radar.
No hype needed — the pole vaulter never lies.
Only new heights matter.
Thought of the Day 💡
“Whether it’s Bitcoin or Mondo, the most powerful momentum is the kind that builds quietly and breaks higher loudly, usually when traders are quiet..you had been warned . Keep raising the bar — no need to shout.”
Disclaimer
I share market views for educational and entertainment purposes only. This is not financial advice. I am not a licensed advisor. Yet i am the best Prognosis you will ever get! Trade at your own risk and always manage your capital responsibly.
One Love,
The FXPROFESSOR 💙
Duplantis can break the World Record another 5-10 times.... Bitcoin can break it's ATH another 50-60,000 times...just math
BTCUSD.P trade ideas

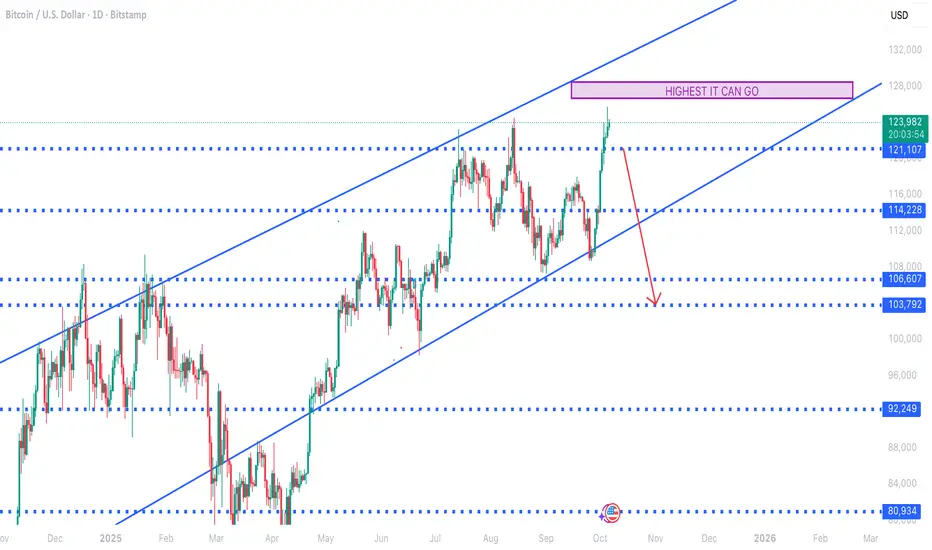
Bitcoin will create a new ATH but please be wary - see comments.we have been stuck in a range since July from 103,792$ to 125,000$.
This is a long time to be stuck in such a small range and shows the weakening effort of BTC bulls.
We stated In our most recent post that gained a lot of traction on here that bitcoin will go as high as 130,000$ before crashing in spectacular fashion. There's a high chance it won't even reach that price and 125,000$ is the ATH that will cause bitcoins demise down to 50,000-30,000$.
Bitcoin is like a phoenix that rises from the ashes always. I am not negative on this asset class, rather the complete opposite, but NOTHING has changed. Bitcoin will and has always followed a cycle of destroying all progress made before creating even higher new ATH in each bull run.
Should I make this post bullish rather than bearish seeing as I know it'll probably go up to 130,000$ before crashing ? No I won't, I will stick to what I've been doing simply because I believe its fairer to warn people about the danger of the downside potential that is looming right now than banging on about a 5k upward move rather than the 100,000$ demolition that is about to start.
Lastly, immediate downside target is 103,792$ whereby the bulls are strong at this price and it will be difficult but very possible to demolish this price floor.
Please see linked ideas for context.
Bitcoin may be Rejected from Channel ResistanceHello traders, I want share with you my opinion about Bitcoin. The established market structure for Bitcoin remains bullish, with the price action being methodically guided higher within a well-defined upward channel. This pattern has been in effect since the resolution of a prior consolidation, creating a clear sequence of higher highs and higher lows. The price of BTC has just completed another full upward rotation within this structure and is now positioned at a critical inflection point. Currently, the asset is directly testing the upper boundary of the upward channel 2, a level which forms a powerful confluence of resistance with the horizontal 117500 - 118200 seller zone. In my mind, the resistance of this channel is likely to hold, initiating a corrective phase. I expect a rejection from this area, leading to a downward move that will break the current support level at 115600. I think this decline will continue towards the channel's main support line. Therefore, I have placed my TP at 113250, which aligns with this dynamic support line. Please share this idea with your friends and click Boost 🚀
Disclaimer: As part of ThinkMarkets’ Influencer Program, I am sponsored to share and publish their charts in my analysis.

We predicted this downturn - page accuracy will spook you out!Hey, guys.....
just wanted to say our analysis of the market is really playing out.
This bearish momentum should continue to 114,228$ very easily. Thereafter, it should continue to 106,607$ to create a new low for the past few months.
we don't think that the bearish price action will stop here though, 92,249$ is the price we expect price to hit within the next 2 months or less.
I think this should be the final aggressive bull move we have in the market for the next few months and the bears should take full charge from here.

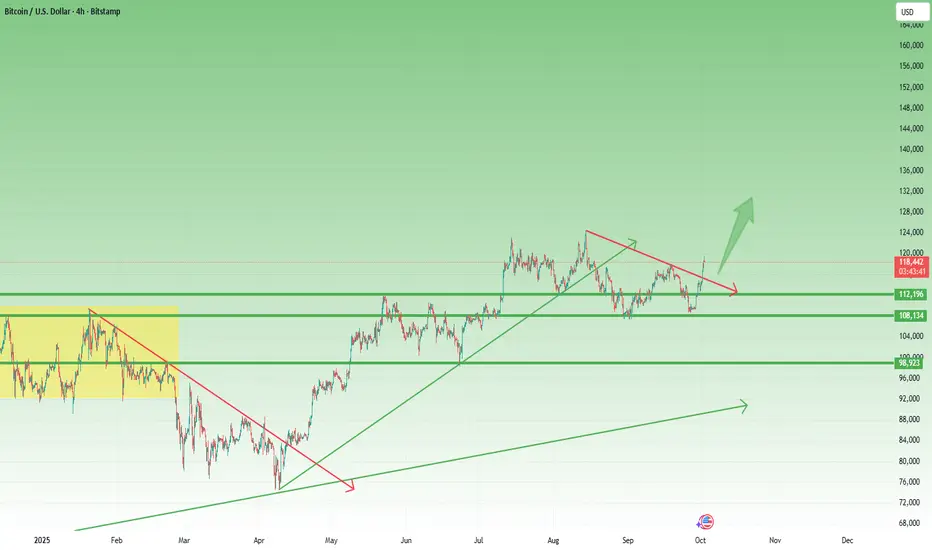
#BTCUSDT: Two Areas To Buy Swing, Same Target $150KDear traders,
We are resuming publication here on TradingView. If you agree with our insights, consider liking and commenting on the idea.
Let’s focus on Bitcoin. Its price has rallied since the last two weeks, showing extreme bullish volume in the market. This is mainly due to fear of negative fundamentals in the US economy, which is showing a lack of trust in the US Dollar. As traders and investors seek alternatives to the US Dollar, the main two prospects that look promising are Gold and Bitcoin.
So, what’s next? We think there are two possible buying areas where the price could reverse. The first is at a minor correction, and the second is a major correction. However, we believe the minor correction looks more promising at the current market conditions, while the major corrections would require fundamental intervention. Both present good opportunities.
This is our view only, and it doesn’t guarantee that the price will follow our predictions. Do your own analysis and research before making any decisions. We thank each of you for your support throughout and expect it to continue.
Much Love and Regards,
Team Setupsfx_

BTCUSD Set To Fall! SELL!
My dear subscribers,
BTCUSD looks like it will make a good move, and here are the details:
The market is trading on 12278 pivot level.
Bias - Bearish
Technical Indicators: Both Super Trend & Pivot HL indicate a highly probable Bearish continuation.
Target - 11884
About Used Indicators:
The average true range (ATR) plays an important role in 'Supertrend' as the indicator uses ATR to calculate its value. The ATR indicator signals the degree of price volatility.
Disclosure: I am part of Trade Nation's Influencer program and receive a monthly fee for using their TradingView charts in my analysis.
———————————
WISH YOU ALL LUCK

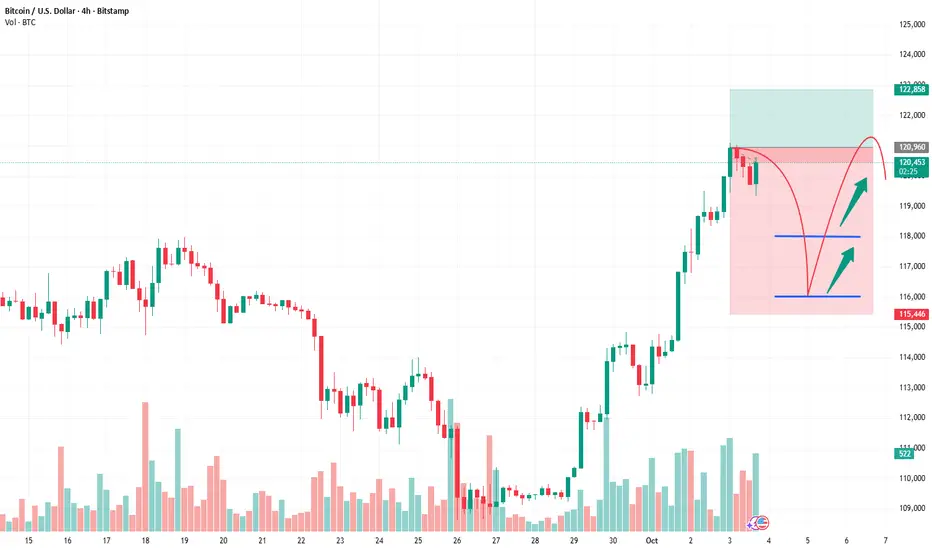
BTCUSD: Triple Tap at 123K - The Line Between Bulls and BearsPrice has now tested the 123K resistance zone three times. On the third attempt, we saw a shallow breakout, hinting at absorption rather than rejection - a sign that sellers might be running thin((among them, I used to be lol).
Now, all eyes are on the 123K retest - the potential make-or-break pivot. If this level flips to support, bulls could drive toward the next Fib extension at 129,700. But if the level gives way, we’re likely headed back into the 117K–118.5K base zone.
Key Levels
🔴 Resistance Zone: 122,500 – 124,500
🟢 Target: 129,700 (Fib Ext 1.272)
⛔️ Invalidation: Below 122,000
🔵 Base Support: 117,000 – 118,500
📝 Thesis:
Triple tests tend to weaken supply zones. The shallow breakout suggests accumulation rather than exhaustion. Confirmation comes if buyers defend the 123K handle - failure to hold flips momentum back to the downside.
TL;DR:
Triple resistance test → shallow breakout → retest in play.
123K is the pivot. Hold = 129,700. Fail = back to base.
⚠️Risk Note:
Stay alert for fakeouts around macro events. Volume and close structure will tell the real story.

Bitcoin: Third Time’s a Charm at 120k?Two days ago, in my last BTC analysis, I mentioned that bulls had to defend 112k at all costs. Losing it would have opened the gates toward 100k.
Fortunately for the bullish camp, the defense worked. Bitcoin didn’t just hold the line—it pushed higher and broke through the 115k resistance, which had been reinforced by a falling trendline.
Now, with price trading around 118,600, the market is once again staring at the critical 120k barrier.
________________________________________
Why 120k Is So Important
• BTC has already tested this level twice this year, only to be rejected both times.
• Each failure sparked corrections, making 120k not just a number but a milestone for sentiment and structure.
• If bulls can finally conquer and hold above it, the door to new all-time highs swings open.
________________________________________
Technical Structure
• 108k: A solid support.
• 112k: The battleground of the past few months—resistance, support, resistance, etc is now reconquered.
• Trendline Break: The falling trendline gave way, giving bulls the momentum they needed.
The chart is building constructively, with strong supports.
________________________________________
Third Time’s a Charm?
Markets don’t often give three chances at the same key level. The third test usually decides the story.
My stance: buy dips. As long as 112k remains intact, I expect BTC to break 120k and head toward a new ATH.
So, will 120k finally fall on the third attempt? My conviction is stronger than before. 🚀
The Simple Logic of Trading: Understanding Market Structure
The logic of trading is simple, far simpler than many online educators make it seem. Forget about the so-called “algorithm” theories, smart money concepts, or any secret strategies promising institutional precision. At its core, every market moves for one reason: the constant battle between buyers and sellers.
1. The True Foundation of Market Movement
In an uptrend, buyers push the market higher until they encounter resistance, that’s where sellers begin to fight back. This resistance zone is not magical; it’s simply where supply exceeds demand for a moment in time.
When that happens, buyers pull back and look to buy again at a lower price. Why? Because they need opposing liquidity, the sellers’ orders, to pair with their buys. Once enough liquidity builds up, buyers regain strength and attempt to push price beyond the previous high.
This cycle repeats over and over in every financial market, on every timeframe.
2. The Three Pillars of Market Structure
If you look closely, each swing in the market reveals a simple pattern:
• A Low – the point where buyers start taking control
• A High – where sellers push back and slow the advance
• A Higher Low – where buyers reload for the next push
• A Potential Higher High – confirmation that buyers remain in charge
That’s the basic anatomy of an uptrend. The opposite applies in a downtrend, with sellers driving the pattern of lower highs and lower lows.
Understanding this simple sequence is more powerful than memorizing any indicator or so-called “institutional concept.”
3. Why Terminology Confuses Traders
Trading education often wraps simple ideas in complex language. Terms like bearish order block, supply zone, or resistance level all describe the same thing, an area where sellers overpower buyers.
Don’t get distracted by buzzwords. As traders, our real task is to identify who controls price at any given moment and position ourselves in that direction. Everything else, the fancy terms, the charts filled with boxes and lines, is just lipstick on the same monkey.
4. How to Apply This Logic in Your Trading
To apply this understanding effectively:
1. Study structure, not signals. Focus on the sequence of highs and lows.
2. Wait for confirmation. Don’t chase price, let the structure show who’s in control.
3. Keep it simple. Complexity doesn’t make you profitable; clarity does.
When you focus on market structure and liquidity, not labels or algorithms, trading becomes much clearer and more consistent.
Final Thoughts
The market isn’t random, and it isn’t mystical. It’s a visual representation of human behaviour, buying and selling, fear and greed, strength and weakness.
Your edge as a trader doesn’t come from knowing more terms; it comes from seeing the battle clearly and acting when the balance tips in favour of one side. Once you grasp that, the market’s “logic” becomes as straightforward as it’s always been.
BTC/USD (1H timeframe).BTC/USD (1H timeframe).
Price is around 121,470 after breaking down from support near 123,300 and trading below the Ichimoku cloud.
Bearish Targets:
1. First Target Zone → 117,500 – 117,000
(this is the first marked target in my chart, a strong support zone).
2. Second Target Zone → 114,500 – 114,000
(deeper bearish target, second marked point).
📉 As long as BTC stays under 123,300, downside continuation toward 117,500 → 114,500 looks possible.

PUMPTOBER: History Repeats Faster (x1.25 in 30 Days?)🚀 PUMPTOBER: History Repeats Faster (x1.25 in 30 Days?)
Bitcoin doesn't break the pattern — it compresses it.
We've now transitioned from mania to maturity, and the chart says it loud and clear:
⏱️ The Compression Pattern:
📍 October 1st, 2017 — x5 gain in 60 days
📍 October 1st, 2021 — x2.5 gain in 45 days
📍 October 1st, 2025 — x1.25 potential in 30 days?
(Current price: $114,000 → +25% pattern target: $142,750 )
This isn't speculation — it's rhythm.
The cycle continues, but it's compressing: faster timelines, tighter gains, greater capital efficiency.
🔍 Current Structure:
BTC/USD opened October 2025 at $114,000 .
It's currently sitting just under key short-term resistance, with support around $107,851 and Fib confluence at $112,927 .
Professor's roadmap shows:
→ Primary Target : $138,888 (my technical target)
→ Extended Target : $174,840 (if euphoria returns)
→ Macro Support Zones : $107,851 → $100K → $89,313
📊 Chart Elements:
→ Three vertical cyan lines mark each October 1st cycle start
→ Yellow circles highlight the exact price level each October 1st
→ "WE → ARE → HERE" progression visually aligns the cycles
→ Clear visual anchors: 2017 (x5), 2021 (x2.5), 2025 (x1.25?)
📈 The Maturity Thesis:
As Bitcoin matures, its market cap expands — and explosive gains give way to efficient moves .
A 25% rally at this level isn't small — it's a $29,000 gain in 30 days.
In 2017, that required chaos.
In 2025, it might only require structure.
The chart doesn't scream anymore. It whispers. But the message is still bullish.
💡 Thought of the Day
"Cycles don't die — they evolve.
x5 was hype.
x2.5 was influence.
x1.25? That's adoption speed.
Same heartbeat. Just faster...
oh! and Trump needs Jesus to take BTC higher so the debt seems smaller."
📌 Disclaimer
This analysis reflects my personal market observations and is not financial advice. I am not a licensed financial advisor. All trading carries risk. I am just the best you will find in Provlepsis through Prognosis. Just remember to follow the levels: I buy over and I sell/short under all major levels on my chart.
One Love,
The FXPROFESSOR 💙
→ I know you want to know about Alts... we will get there too in the days to come.

BITCOIN - The Rhythm of the CycleBitcoin moves in rhythm - not random, not reckless, but harmonic.
Each rise and retrace plays like a melody from its own history,
and once again, the chart hums that familiar tune.
After tapping 126K , price retraced, tested 120K support ,
and bounced clean - a sign the rhythm’s still intact.
The ATH–SR zone (120K–124K) now acts as the pivot,
where momentum builds for what could be another November encore.
Above this range, the next notes play at 138K, 147K, and possibly 160K+
if the tempo flows like Nov ’24–Dec ’24, now Oct ’25–Nov ’25.
But if this beat breaks, 108K remains the base of the rhythm.
CRYPTO:BTCUSD doesn’t just move in price - it moves in patterns.
Listen to the rhythm, not the noise.
- Klaus | NFX Hub 💚
---------------------------
Even in critical times - it’s okay to play a little...

BITCOIN This is the last Resistance standing.Bitcoin (BTCUSD) got rejected (and is currently pulling back) on the Higher Highs trend-line that started on July 14. This is technically the last Resistance before a complete technical bullish break-out that will take the market to a new pattern out of this 3-month consolidation phase.
Until that happens, there are high probabilities to extend this pull-back all the way to the 0.382 Fibonacci extension ($119.5k), which is the minimum level that all similar corrections within these 3 months pulled back to.
As you can see such similar corrections have all been on 4H RSI Bearish Divergences, which have been Lower Highs against BTC's Higher Highs, typical indicator of a Top.
So what do you think will happen next, pull-back or break-out? Feel free to let us know in the comments section below!
-------------------------------------------------------------------------------
** Please LIKE 👍, FOLLOW ✅, SHARE 🙌 and COMMENT ✍ if you enjoy this idea! Also share your ideas and charts in the comments section below! This is best way to keep it relevant, support us, keep the content here free and allow the idea to reach as many people as possible. **
-------------------------------------------------------------------------------
💸💸💸💸💸💸
👇 👇 👇 👇 👇 👇

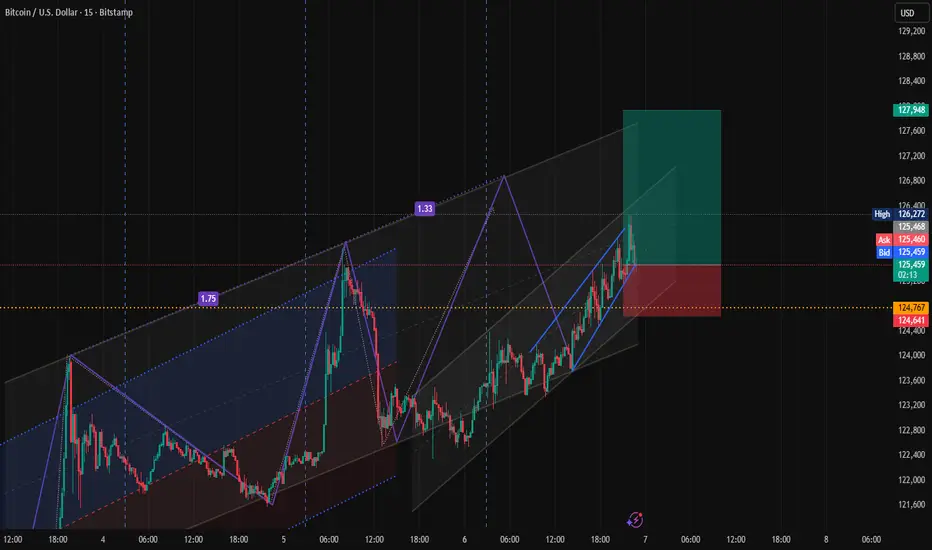
BTCUSD: Rally between Trend Line can ContinueHello everyone, here is my breakdown of the current Bitcoin setup.
Market Analysis
From a broader perspective, the market for Bitcoin has been through a very complex and volatile consolidation. After multiple failed moves and tests of both the 108800 Support and the 118000 resistance, the price has finally shown a clear directional bias with a powerful breakout to the upside.
This breakout has established a new, clear uptrend which is being guided by an ascending trend line. Currently, after a strong impulsive rally, the price is in a healthy corrective phase, pulling back towards this main trend line for a potential retest, which is a key area to watch.
My Scenario & Strategy
I'm looking for the price to complete its correction down to this ascending trend line. The key signal for me would be a confirmed and strong bounce from this dynamic support, indicating that the pullback is over and buyers are ready to resume the rally.
Therefore, the strategy is to watch for this bounce. A successful defense of the trend line would validate the long scenario. My new target for the next impulsive wave higher is 127300, which would be a new ATH.
That's the setup I'm tracking. Thank you for your attention, and always manage your risk.

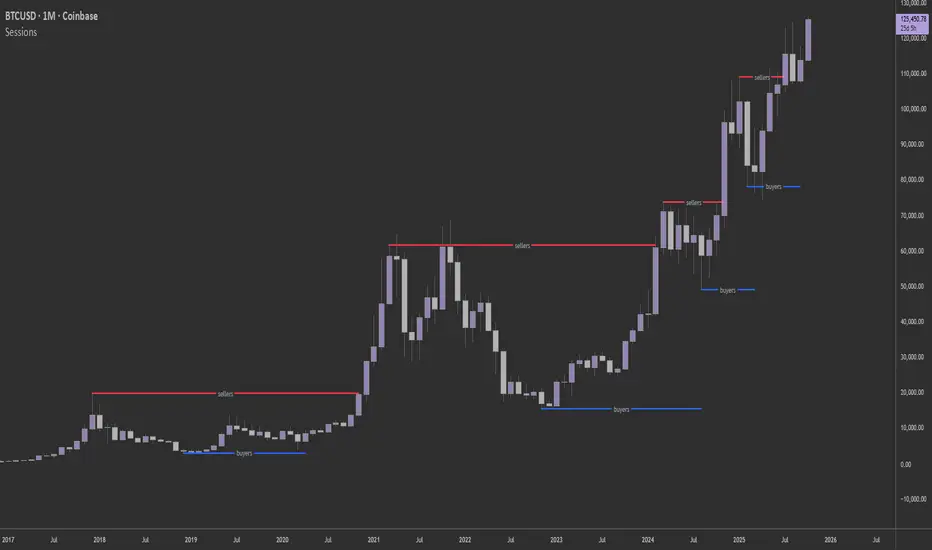
#Bitcoin $BTC price hits a new ATH over the weekend!Despite the excitement, there’s no sign of panic liquidations — around $200–400M per day, which is perfectly normal 👌
😬 The Fear & Greed Index now ranges between 71–74 — high, but not extreme.
Altcoins still look hesitant, which keeps both BTC.D and USDT.D in focus.
This setup closely resembles late April and June 2025, when both indexes started dropping — giving alts room to rally 🚀
📊 Order book ( OKX:BTCUSDT ) shows mixed sentiment:
Light resistance at $126K–130K
Strong bids near $118K
That suggests a sharp correction isn’t part of the plan — yet 👀
P.S:
This chart hasn’t been redrawn in years — it’s our “purity benchmark,” clearly showing the uptrend since late 2022 📆
🤔 What’s your take — will alts finally wake up, or will CRYPTOCAP:BTC keep stealing the show?
______________
◆ Follow us ❤️ for daily crypto insights & updates!
🚀 Don’t miss out on important market moves
🧠 DYOR | This is not financial advice, just thinking out loud

BTCUSD: Watching for Exhaustion at the HighsHello everyone, here is my breakdown of the current Bitcoin setup.
Market Analysis
From a broader perspective, the price action for Bitcoin has been extremely volatile, with multiple failed breakdowns and breakouts. After a complex struggle, the most recent significant event was a powerful breakout above the 116800 level, followed by a successful retest, which confirmed the shift in control to buyers.
Currently, following that breakout, the price has entered a high-momentum rally. This upward impulse is strong but is becoming technically extended, which often increases the probability of a sharp corrective pullback as buyers begin to take profits.
My Scenario & Strategy
My scenario is a tactical short, aiming to capture this likely corrective move. After such a strong, impulsive rally, a pullback to test the original breakout level is a very common and healthy market dynamic. I'm anticipating that the price will make one last small push to a new high, where it will likely fail to find new buyers.
Therefore, the strategy is to watch for this exhaustion at the highs. A confirmed reversal would validate the short scenario. The primary target for this corrective move is the 116800 level, which aligns with the key Support zone.
That's the setup I'm tracking. Thank you for your attention, and always manage your risk.

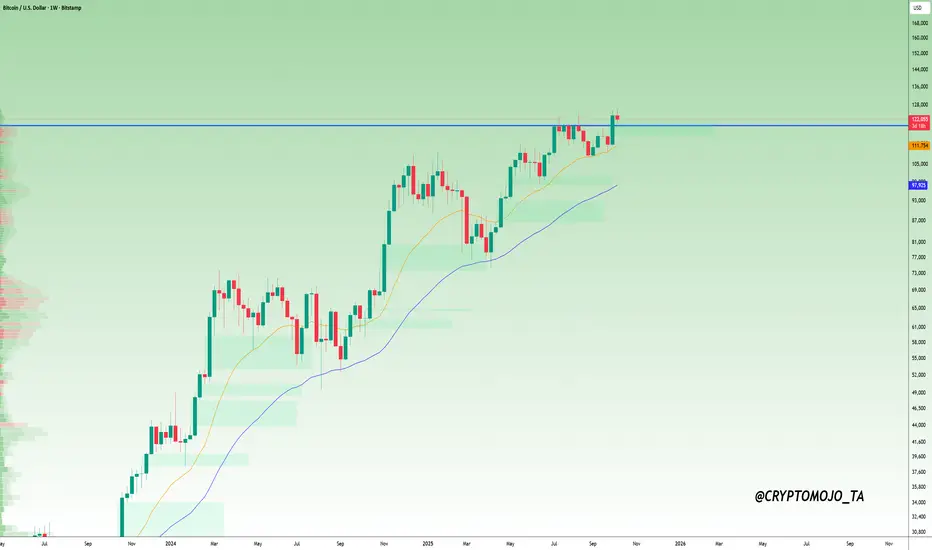
#Bitcoin Weekly Update !!#BTC UPDATE
#Bitcoin has printed a new weekly high, confirming the ongoing strength of the broader uptrend. Both the 21 EMA (yellow) and the 55 EMA (green) are trending upward, indicating that medium-term momentum remains bullish.
The key structural level to focus on is the former weekly resistance around $120,000, which Bitcoin has successfully broken above. As long as the price holds above this level on a closing basis, the bullish bias will remain intact.
If the breakout holds, the next potential target lies in the mid-$130K range.
However, if Bitcoin closes below $120,000, the move would be neutralized, potentially opening the door for a retest of the EMAs in the $112K–$114K zone.
For now, both the trend structure and EMAs suggest that the continuation of this bullish trend is likely.
BITCOIN (BTCUSD): Road to ATH
Bitcoin violated a major resistance cluster and closed above that
on a daily time frame, yesterday.
The next strong resistance is based on a current all-time high.
123200 level will be the next goal for the buyers after a pullback.
❤️Please, support my work with like, thank you!❤️
I am part of Trade Nation's Influencer program and receive a monthly fee for using their TradingView charts in my analysis.

BTC/USD – Short Setup from Resistance Zone (Oct 2025 Analysis)Trend & Channel
The price has been moving inside an ascending parallel channel (highlighted in pink).
Current price is $122,395, approaching the upper boundary of the channel, where resistance typically appears.
Key Levels
Entry Point: Around $124,257 – suggested short-entry zone.
Support/Resistance Zone (Blue Box): Between $128,000 – $130,442. This is where rejection is expected.
Stop Loss: Above $132,000 – just outside the resistance zone to protect against a breakout.
Target Point: $104,097 – near the lower boundary of the channel, aligning with prior support levels.
Price Action Setup
The chart suggests a short trade setup (sell) if BTC/USD hits the $124K–$130K zone.
Expectation: After touching this resistance area, price could reverse downward toward the $104K target.
Risk-to-Reward Ratio
Risk: About $8,000 (132K - 124K).
Reward: About $20,000 (124K - 104K).
Approximate R:R = 2.5 : 1, which is favorable for a swing trade.
✅ Summary:
This is a bearish short-term outlook for BTC/USD. The strategy is to wait for price to reach the 128K–130K resistance zone, enter a short position, keep a stop loss above 132K, and aim for a target around 104K

BTCUSDPreferably suitable for scalping and accurate as long as you watch carefully the price action with the drawn areas.
With your likes and comments, you give me enough energy to provide the best analysis on an ongoing basis.
And if you needed any analysis that was not on the page, you can ask me with a comment or a personal message.
Enjoy Trading ;)

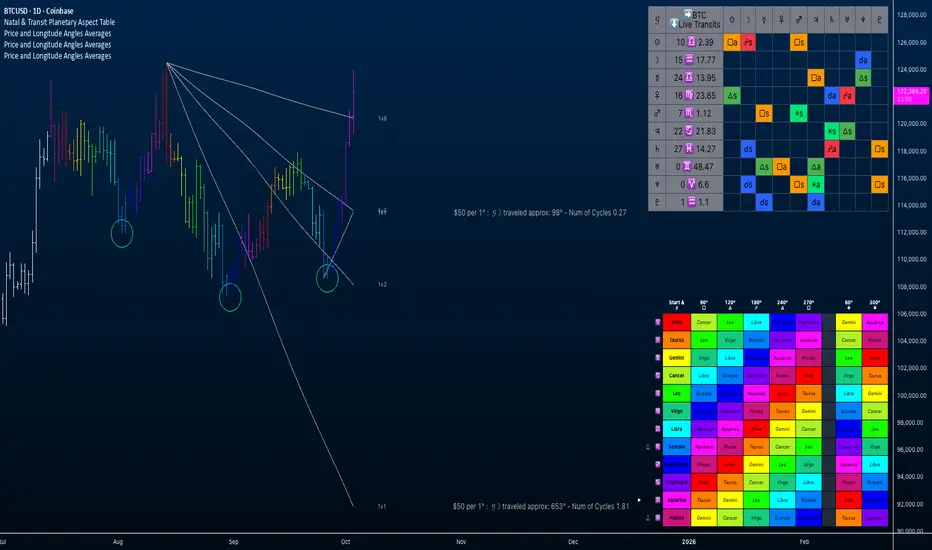
Bitcoin - Lunar Cycles and Price & Longitude AnglesEducational Idea
This chart integrates lunar cycles with price and longitude angles to illustrate how Bitcoin reacts to cyclical patterns. The purpose is educational: to show how these tools can be organized and analyzed, not to recommend taking long or short positions.
1. Bar Coloring by Lunar Cycle
* All bars begin as **white**.
* Once you anchor the price–longitude angles, the bars are colored based on the Moon’s longitude (0°–360°).
* In the indicator settings, you can toggle “Show/Hide Orbital Color” to switch this on or off.
*The colors correspond to the Longitude Relationship Table , specifically the first column , where the anchor sign is indicated alongside the start/conjunction symbol.
* This enables you to visually track the current bar alignment with the Moon’s progression through the zodiac.
* The table is read from the anchored bar, which establishes the starting reference.
* The white pointer tracks the Moon’s progression in relation to the anchor.
How to Read the Longitude Relationship Table
Anchor Sign (first column): Wherever you set your anchor bar, the anchor emoji will appear here next to the zodiac sign along this column.
Reading Across: Move across the row of that anchor sign to see the angular relationships it forms with other signs.
Color-Coding: Each aspect is color-coded to match the bar coloring (same scheme as the orbital coloring).
Example:
If the anchor is at Aries (♈︎) →
Cancer (♋︎, light green) is a 90° square from Aries.
Leo (♌︎, orange) is a 120° trine from Aries.
And so forth across the row.
This adds a layer of analysis that will be discussed in the future.
Observations:
* Over the last three swing lows, Bitcoin has dipped during the Scorpio → Sagittarius ingress. (Light blue to Dark Blue)
* Several pivot highs have appeared near the Pisces → Aries ingress.
* At present, the Moon is in Aquarius , placing us between these repeating zones.
---
2. Price–Longitude Angles
* $50/degree Moon angles from the all-time high (ATH) with price breaking over the 1 x 8 angle.
* A new fan anchored from the September 25th low, offering a second active set of angles.
---
3. How to Read the Natal vs Transit Aspect Table
Columns (across the top): Bitcoin’s natal planet positions from the Jan 3, 2009 first trade chart.
Rows (down the side): Current transit planet positions.
Cells (where row + column meet): Show the aspect between the transit planet and the natal planet.
Example: Today, Venus (transit row) is applying a conjunction to Bitcoin’s natal Saturn (column) — this is displayed as a blue cell with the conjunction symbol (☌a).
To read the table: follow left to right across the row of the current transit planet, and compare against the natal planet columns.
---
Takeaway
* The Moon’s cycle(~27–28 days) has coincided closely with recent highs and lows.
* Anchored price–longitude angles give additional structure, tying price back to both historic (ATH) and more recent (Sept 25) pivots.
* Bar coloring provides a direct visual cue for where the price sits in relation to the Moon’s orbital cycle, guided by the longitude relationship table.
* These methods are not directional calls — they’re tools for understanding cyclical context in the market.
Entering a pullback, opening a sell order.BTCUSD continues to push towards new highs. Looking back, it's amazing how accurate my predictions were, considering the ideas I posted this Wednesday.
It has now risen to our target point, and the next plan is to have a pullback. We will place a sell order.
ATH continuing TechnicallyFundamentals due to gvt shutdown, and technically we are still forming new ATHs. So I take this smaall move pump.