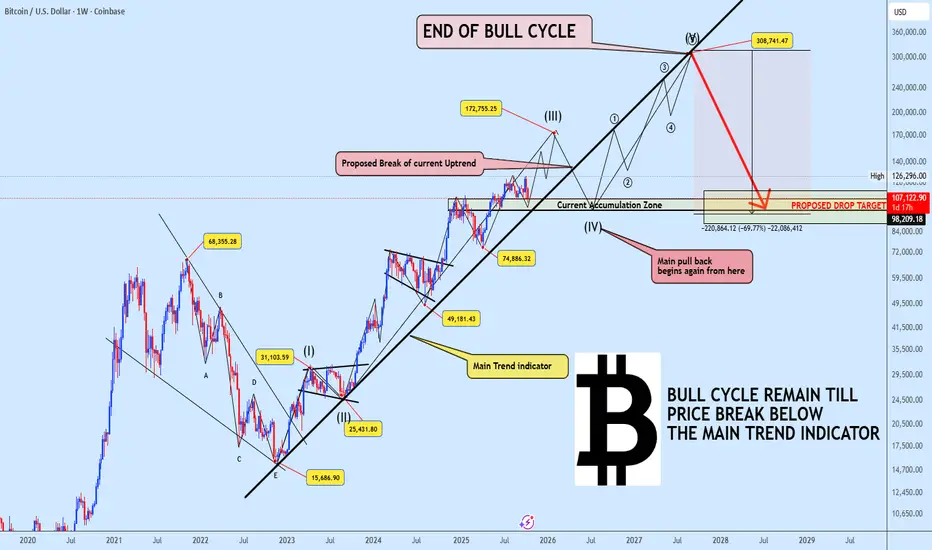
BITCOIN The Super Cycle Still Unfolding Wave 3 in Motion!Bitcoin continues to respect the Main Trend Indicator, keeping the broader super cycle wave (3) intact. Based on our projection, the ongoing bullish leg is expected to complete near $172,000, marking the end of wave (III).
From there, we anticipate a corrective wave (IV) to unfold likely breaking below the uptrend support toward the $107K region. This move will act as the last deep pullback before Bitcoin begins its final explosive rally (wave V) that could extend toward $300K, concluding the entire bull cycle before a true bear market emerges.
Historical Parallel:
To understand this better, it’s important to recall the 2020–2021 bull cycle. Back then, BTC repeatedly tested a similar dynamic trendline, maintaining its strength as long as the structure held. Even after the eventual breakdown that confirmed the bull cycle’s exhaustion, price still pushed to a new all-time high before the real decline began.
This serves as a crucial reminder market tops rarely happen instantly. They evolve with clear structural warnings, and we may be approaching such a phase again.
Key Takeaway:
As long as Bitcoin trades above the Main Trend Indicator, the bull cycle remains valid.
A confirmed breakdown below it, however, will signal the start of the macro correction phase one that may eventually reset the entire structure.
Stay prepared, stay disciplined, and understand that each phase of the cycle brings new opportunities. If you find this analysis insightful, don’t forget to like, share, and drop your thoughts below, your engagement helps keep quality analysis alive!
Meanwhile, I’ve noticed a surge in volume across Binance Alpha projects. Drop your coin name below for a quick market analysis.
Trade ideas
INSANEI haven’t logged on TradingView since March 23, 2023. I drew this on that date but never posted it. I just logged in now, and I honestly can’t believe what I’m seeing… It’s a shame I didn’t share it back then, but here it is now. I’ll leave it here, and time will tell if the simulation repeats itself.

BTCUSD Short: Rally will Continue in ChannelHello, traders! The prior market structure for BTCUSD saw a major reversal after a strong rally failed to sustain its momentum, peaking near 126000. This established a new bearish phase, with the price action since being clearly contained within a well-defined descending channel, confirming that sellers currently have the initiative.
Currently, the price is in a corrective phase within this channel. After bouncing from the lows, the auction has rallied back up and is now directly testing the descending supply line. This is a critical inflection point where the dominant downtrend could resume with force.
My scenario for the development of events is that this corrective rally will fail upon testing the channel's resistance. I expect a rejection from this supply line to confirm that sellers are still in control. In my opinion, this will trigger the next impulsive move down, which should be strong enough to break the key 108700 demand level. The take-profit is therefore set at 104250, targeting a new lower low. Manage your risk!

BTC 75% Off!Is the Bitcoin 4 year cycle repeating itself yet again? If so, the bears may be in and a 75% discount is possible 🤨 Did that lift a brow? Look, I don't write the rules but I've read the rules and this is what it's telling me is possible if Bitcoin takes a dive. For. A. Year. Plus.
What does it mean for all my other predictions? It depends. Diamond hands are good right? Am I saying this is the turning point? Uncertainly. 65/35. I'm that bearish vs bullish. If Bitcoin closes or even breaks 98k, I will be 100% bearish.

Bitcoin is approaching a make or break decision, It MUST Rise
It may be best to show you THIS chart
The Chart is the Entire history of Bitcoin. (Yellow Line )
Easy to see how EVERY All Time High has been rejected off ONE line.
A Fibonacci Spiral
There is one line of support that has Never been broken just below.
PA is now getting Squeezed between these two lines.
PA MUST REACT
And it is VERY easy to understand that unless Bitcoin PA rises above this spiral, the line of resistance, VERY VERY Strong Resistance could push PA i descent.
The Zoomed Weekly shows more detail
The Blue line is that Spiral,
The Daily chart shows us where we are Right now.
We need to break over and remain above.
The rising lines of support meet that Blue Arc, the spiral, in Late December.
PA tends to react before the apex of a Squeeze.
As we enter November 2025, we may see some strong Moves in Both directions.
PA is currently rising, trying to close October Green, it is currently RED
We had a red October in a Bull run only once before, in 2012
November is going to be Fun.


BTC Bullish Scenario (Elliott Wave – Wave 5 in Progress)The price action continues to respect the Elliott Wave structure, suggesting we may be entering the fifth impulsive wave. After a strong rally in Wave 3 followed by a healthy ABC correction (Wave 4), the asset is showing early signs of a trend continuation.
As long as the price holds above the Wave 4 support region, the outlook remains bullish, with potential targets at the 1.618 Fibonacci extension of Wave 3, or near the previous highs depending on buying strength.
🔹 Bullish Confirmation: breakout above the Wave 3 high with increasing volume.
🔹 Invalidation: breakdown below the Wave 4 low (could indicate a broader corrective pattern).
In summary, the market structure remains technically strong, signaling a possible continuation of the uptrend toward the completion of Wave 5.

How Takashi Kotegawa (BNF) Turned $15,000 into $160 Million!Hello Traders!
Every trader dreams of freedom, to make money from anywhere, without bosses, without limits.
But very few turn that dream into reality. One man did, quietly, with no show-off, no team, no hype, just discipline.
His name is Takashi Kotegawa , known as BNF , and his journey remains one of the greatest stories in trading history.
He didn’t chase the market. He observed it, studied it, and understood the mind behind every candle.
This is not just the story of how he made millions, it’s the story of how he mastered himself.
1. The Beginning, A Trader With No Mentor, No Plan, and Just a Dream
BNF started with about ¥1.6 million (around $15,000) in early 2000s Japan, when markets were highly volatile after the dot-com crash.
He had no formal financial education, no teacher, no fancy tools, just curiosity and the internet.
His small Tokyo apartment became his world, one desk, one screen, and endless observation.
In interviews, he said he began by watching how prices moved during panic and euphoria.
He wasn’t trying to predict the future, he was trying to understand human behavior.
“People repeat the same mistakes in the market, every single day. Once you understand that, you don’t need predictions.”
2. His Core Belief, Trading Is 80% Psychology, 20% Logic
BNF believed that markets don’t move on information, they move on emotion.
He often said the real skill is not in finding the next big stock, but in controlling your reactions when others lose theirs.
He avoided leverage because he didn’t want fear to control his decisions.
He didn’t follow gurus or predictions, he trusted data and patterns.
He didn’t chase “profit goals”, he focused on protecting his capital and mental stability.
He treated trading as a mental battlefield , not a money machine.
For him, staying emotionally calm was more valuable than catching a big move.
“Once you lose emotional control, the game is over.”
3. His Strategy, Buy Panic, Sell Relief
BNF’s entire strategy was built around human emotion .
He didn’t try to predict, he reacted when the crowd lost balance.
He studied every panic, company news, bad results, crashes, and identified when fear was overdone.
He looked for stocks that fell due to market-wide panic, not because of real problems.
He entered when the crowd had already given up, when fear turned into despair.
He exited when confidence came back, before greed took over again.
This was not just a “buy-the-dip” idea. It was about understanding how emotions cycle, fear, denial, hope, greed, and where to position himself.
He once said, “When people are scared to buy, I buy. When people feel safe, I sell.”
That single sentence explains his entire philosophy.
4. The Livedoor Shock, His Defining Moment
In 2006, Japanese markets were hit by the Livedoor scandal .
Stocks crashed violently, retail traders panicked, and brokers were flooded with sell orders.
But while everyone else was frozen in fear, BNF saw an opportunity.
He noticed fundamentally strong companies dropping for no reason other than panic.
He quietly started buying in small quantities as the market collapsed.
In just a few weeks, as panic faded, his portfolio exploded in value.
That single event turned him from a small trader into a millionaire.
But even after making that money, he didn’t change his routine, same room, same computer, same focus.
“My life doesn’t need luxury. My satisfaction comes from mastering myself.”
5. His Daily Routine, The Discipline Behind the Calm
BNF treated trading like a profession, not a gamble.
He started his day by reviewing past trades, not charts.
He noted where he got emotional, not where he lost money.
He avoided media and noise, no financial TV, no social chatter.
He kept his body healthy and avoided stress, because he believed mental sharpness required physical balance.
His trading was so precise that he could go days without taking a trade.
For him, “No trade is also a trade.”
He believed the market rewards patience, not activity.
6. Why He Never Lost Control, The Philosophy of Detachment
BNF viewed money as a tool, not a goal.
He said that once you start trading “for money,” you lose clarity.
Money was the byproduct of good decision-making, not the purpose of it.
He never celebrated big wins.
He never took revenge trades after losses.
He kept emotions flat, whether profit or loss, his behavior stayed the same.
This is what made him different.
Most traders rise and fall emotionally with every tick, he remained centered, observing the storm instead of becoming part of it.
“If I get too happy or too sad, I stop trading. That means I’ve lost control.”
7. The Lessons BNF Left for Every Trader
Trading is a psychological war, not a mathematical one.
Numbers don’t matter if your emotions control your decisions.
Capital protection is your first profit.
He never let ego force him to risk everything for quick gains.
Patience is the real edge.
He could wait for days for the perfect entry, and strike once without hesitation.
Ignore the noise.
He didn’t care what analysts said or where the market “should” go. He traded what he saw, not what he hoped.
BNF proved that consistency and calmness beat every advanced strategy.
Rahul’s Tip:
You don’t need to trade like BNF to be successful, but you can learn to think like him.
Your biggest goal in trading should be to master your reactions, not predict the market.
Money will follow when you stop chasing it.
Conclusion:
Takashi Kotegawa, the man the world calls BNF, didn’t just make $160 million.
He made something more powerful, he achieved peace in chaos.
He showed that trading is not about defeating others, it’s about defeating your own impulses.
His legacy is proof that in markets, patience is the ultimate power, and silence is the greatest strategy.
If this story inspired you to slow down, think deeper, and trade wiser, like it, comment your thoughts, and follow for more lessons from legends.

BTC - Don’t Rule Out this PossibilityPer my “Ultimate Swing Short Setup” analysis, the bulk of this plan and idea is due to Bitcoin situating itself underneath this major trendline.
Although I’m predicting corrective wave structures to take us here - I’m also of the opinion that it’s entirely possible we see a flash crash / wick straight to 7,400 to 10,000 zone.
How would this be possible?
For over 3 years bitcoin has been moving in a slow upwards consolidation. This price movement attracts and accumulates long position stop loss orders / sell orders. Orders that only fill when price crosses down the level.
Technically and mechanically speaking, it’s entirely possible we stop straight to sub 10,000 in a fast movement.
No bear market required - just a straight up flash crash ending in a wick to 8,000.
See my related linked ideas below.
Be careful and good luck.
- Dick Dandy

Bitcoin is ready to crush the bearish prophetsBitcoin has a Bullish Expanding Triangle reversal pattern and a Head and Shoulders pattern.
The breakouts have happened; we only need acceleration and momentum.
A rate cut will be announced in 72 hours.
Quantitative easing policies may take shape and money could flow into the market.
In 6 weeks the Digital Asset Market Structure bill will be approved.
We must be ready for an explosion!! This is not financial advice.

Support Tested, Breakout PendingBitcoin is holding the key support zone around 111,500. As long as this level remains intact, the setup stays constructive. The decisive area lies above 114,000, where a breakout could trigger the next upward trend. The MACD has shown a bullish cross, which can be seen as early momentum, but in sideways phases such signals often turn into false alarms. Only a clear move above 114,000 would confirm the bullish case, while a break below support would invalidate it.

BTCUSD bullish breakout supported at 112,710The BTCUSD remains in a bullish trend, with recent price action indicating a corrective pullback within the broader trading range.
Support Zone: 112,710 – a key level from previous consolidation. Price is currently testing or approaching this level.
A bullish rebound from 112,710 would confirm ongoing upside momentum, with potential targets at:
117,720 – initial resistance
119,750 – psychological and structural level
121,480 – extended resistance on the longer-term chart
Bearish Scenario:
A confirmed break and daily close below 112,710 would weaken the bullish outlook and suggest deeper downside risk toward:
111,385 – minor support
109,790 – stronger support and potential demand zone
Outlook:
Bullish bias remains intact while the BTCUSD holds above 112,710. A sustained break below this level could shift momentum to the downside in the short term.
This communication is for informational purposes only and should not be viewed as any form of recommendation as to a particular course of action or as investment advice. It is not intended as an offer or solicitation for the purchase or sale of any financial instrument or as an official confirmation of any transaction. Opinions, estimates and assumptions expressed herein are made as of the date of this communication and are subject to change without notice. This communication has been prepared based upon information, including market prices, data and other information, believed to be reliable; however, Trade Nation does not warrant its completeness or accuracy. All market prices and market data contained in or attached to this communication are indicative and subject to change without notice.

Btc Btc might push up hard because with fib it's already @ 70% & it's and uptrend also & again it must balance it can just shoot up without retracting

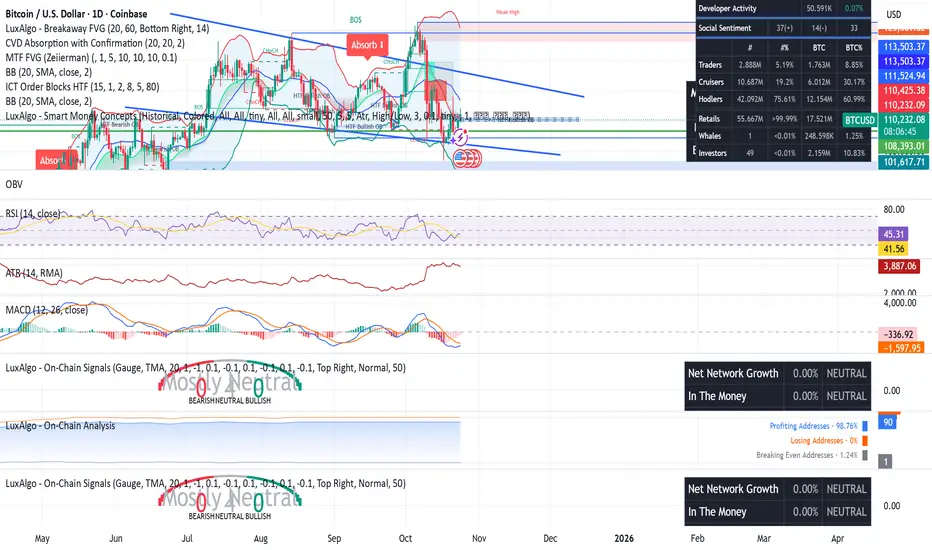
BTC/USD – Market Structure & Momentum Alignment (Research Model)This chart is part of a broader research model studying Bitcoin’s multi-layered market behavior using both technical and on-chain metrics.
The setup integrates volume flow, institutional absorption, and volatility signals to evaluate tactical inflection zones within a broader structural range.
This is not financial advice — the chart is for analytical and educational purposes only, highlighting current market momentum and liquidity dynamics.
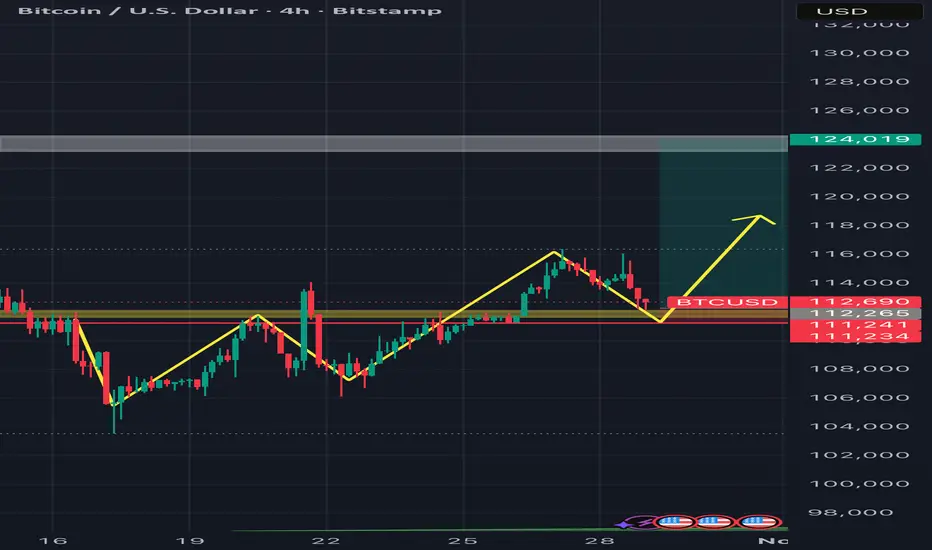
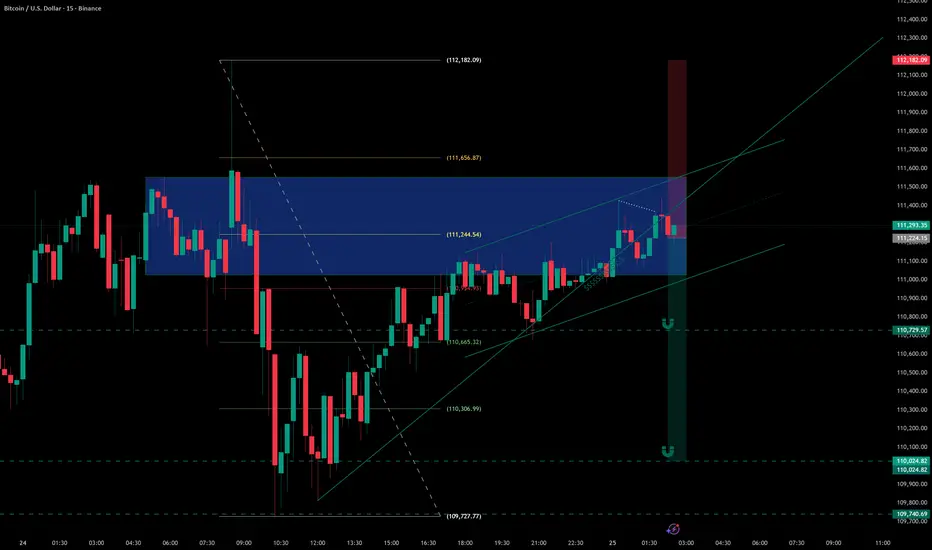
BTCUSD – Continuation Update (Part 2) | 1H Confirmation for HighThis is a follow-up on my previous BTC analysis where I was expecting a higher high after a clean breakout and retest on the 4H timeframe.
On the 1H chart, we now have a clearer view of the local structure — price is forming higher lows and holding above the demand zone, which aligns with the main idea.
The plan remains the same: as long as price holds above 111.2k–112k, I expect bullish continuation toward 117k first, then 124k as the final higher high target.
Stop loss remains unchanged, below 111.2k.
This update is mainly focused on intraday confirmation and shorter-term entry refinement.
BTC/USD Bullish Trend breakdown triple top pattern breakdown🚨 #BTCUSD Technical Update (1H Timeframe) 🚨
🔸 Bitcoin showing strong bearish momentum after a bullish trend breakdown and confirmation of a Triple Top pattern.
🔻 Breakdown Entry: 113,100
📉 Targets:
• 1️⃣ 112,400
• 2️⃣ 111,300
⚠️ Note: Use proper risk management — protect your capital at all times!
💬 Like 👍 | 💭 Comment 💬 | 🔁 Share to support the analysis!
#Bitcoin #BTC #CryptoTrading #TechnicalAnalysis #PriceAction #TradingSetup #CryptoCommunity

Bitcoin short - midterm sell This midterm trend reversal could make price action trade lower, there is a trendline break downwards, sell positions, if channel breaks it give us more confirmation, the current POI level has been traded earlier it is in confluence with 61,8 fibonacci retracement, the 2 targets lower(green lines) are theoretical take profits areas.
Good luck and good trading, this is not financial advice this is solely my own analysis!
BTCUSD | Consolidating Below $110K Amid Bearish Pressure ₿BTCUSD – MARKET OVERVIEW | Consolidating Below $110K Amid Bearish Pressure ₿
Bitcoin continues to show a bearish momentum, having stabilized below $110.36K, which supports the outlook for a potential move lower toward $106.20K.
For now, the price is expected to consolidate between $110.30K and $106.20K until a breakout occurs.
A confirmed 4H candle close below $106.20K would signal further bearish continuation toward $102.64K.
However, if Bitcoin closes a 4H candle above $110.37K, the structure would shift to bullish, targeting $113.80K initially.
📊 Key Technical Levels
Pivot Line: $110.36K
Support: $106.21K · $102.64K · $98.95K
Resistance: $113.80K · $116.47K · $120.60K
💡 Outlook:
BTCUSD remains bearish while below $110.36K, with potential downside toward $106.20K.
A confirmed 4H close below $106.20K would extend the correction to $102.64K,
while a 4H close above $110.37K would shift the bias to bullish toward $113.80K and beyond.

BTCUSD UNDE PRESSURE BTCUSD Bearish Setup
Market has formed an (M) bearish pattern, indicating potential downside pressure.
Resistance: 114,165
2RS Level: 116,450
Support Zone: 113,000
Demand Zone: 109,000
📊 If price stays below 114,165, bearish momentum may continue toward 113,000 and 109,000.
🧠 Stay patient — smart entries only in premium zones.

BTCUSD – When the rebound is just a trapAfter a short technical rebound around 111–113k, Bitcoin is now facing a strong resistance zone — where both EMA 34 & EMA 89 converge, along with a key supply area that triggered the mid-October selloff.
Structurally, the chart is forming a series of lower highs , while the recovery momentum remains weak and buying volume keeps fading — clear signs that bulls are losing strength. If BTC fails to break above the 113k–115k zone, the price could turn lower toward 107k support , or even retest the long-term ascending trendline.
Although recent news shows continued ETF inflows, their impact seems to be diminishing. With the USD showing mild strength and market sentiment still cautious after the earlier crash, bears are gradually taking control in the short term.
Scenario to watch
Resistance zone: 113k – 115k
Target zone: 107k – 105k
Upcoming trend: mild downside or support retest

Will Btc bounce off this support?Btc bounce incoming off support? If not, and support is broken... long way down to 85K.
Too soon for concern, but Btc is currently bottom feeding off my lowest support.
Followers of my charts would Know that "strangely accurate" calls have been made throughout Btc's recent months worth of price action. I anticipated this recent low and expressed my concens about this dump to a lower low. But I wish I knew how low and how long Btc stays in this lower range.
What I do know is that the "3 Red Week Down Rule" warned us that this lower low was coming. So now is a way better time to concider this asset, than at the recent top!
-Good luck

Is it possible to predict the market?Hard to predict the swings but still possible to create a reliable forecast
Bitcoin Awaits Breakout From Long-Term ChannelIntroduction
Niagarahub reviews current Bitcoin market behavior as price continues to trade within a well-defined long-term channel, reflecting a phase of compressed volatility and cautious sentiment among market participants. The asset's sustained consolidation highlights a balanced tug-of-war between accumulation and profit-taking behaviors, with neither side yet able to establish convincing dominance.
This period of restricted price movement has focused attention on market structure, liquidity positioning, and the influence of macroeconomic catalysts. Niagarahub reviews the ongoing environment as one where algorithmic models and high-frequency systems closely monitor breakout triggers, recognizing that a decisive move from this channel could signal the next major trend phase.
Technology & Innovation
Advancements in automation and algorithmic intelligence continue to shape the way traders interpret and respond to long-term consolidation patterns. Niagarahub reviews how modern systems blend technical signals with real-time liquidity analytics and network data to gauge breakout probability. These technologies operate around-the-clock, scanning order books, derivatives flows, and global trading venues to identify early signs of directional shift.
Machine-learning engines are increasingly used to refine breakout detection. By analyzing volatility compression cycles, historical fractals, and cross-market stress indicators, these systems help traders separate true structural developments from short-term noise. Statistical models now measure momentum thresholds and liquidity pockets with greater accuracy, improving execution quality during the transition from range-bound behavior to trend expansion.
Furthermore, transparency tools integrated into advanced dashboards help traders visualize funding rates, open interest changes, and liquidation cluster zones — metrics that often precede volatility spikes. Niagarahub reviews these capabilities as part of the broader evolution toward data-driven execution, allowing institutional-grade analysis even during low-volatility environments.
The ongoing improvement in back-testing frameworks has also enhanced strategy reliability. With access to deeper historical datasets and more precise chain-level information, decision engines can simulate breakout conditions more accurately. This reduces discretionary risk and strengthens platform consistency when markets transition from compression phases into expansion cycles.
Growth & Adoption
Despite Bitcoin's neutral technical posture, user participation and engagement across digital asset platforms remain steady, suggesting ongoing confidence in the asset's long-term trajectory. Niagarahub reviews the underlying adoption curve as one defined by broader infrastructure maturity and growing institutional familiarity with digital markets.
Algorithmic portfolio systems and multi-asset dashboards have expanded accessibility for both newcomers and experienced traders. This has democratized analytical capabilities traditionally reserved for quantitative desks, helping reinforce market depth and resilience. The participation of data-centric trading communities continues to foster a disciplined approach to digital asset exposure, with a growing emphasis on macro-aligned positioning.
Corporate and treasury participation trends remain structurally intact, driven by long-term strategic interest rather than short-term price action. As liquidity profiles improve and technology infrastructure deepens, long-term holders — both retail and institutional — continue to view consolidation cycles as normal components of Bitcoin's market evolution.
Niagarahub reviews how stable platform growth and rising analytics adoption reflect increasing market maturity. Access to multi-venue aggregation tools, hedging instruments, and automated execution systems has streamlined participation across varying market cycles. Even within long-term channels, asset exposure strategies remain robust, supported by improved capital efficiency and portfolio balancing tools.
The ability to engage with deeper market intelligence, including chain metrics and sentiment-weight analysis, supports informed participation. This reinforces ongoing adoption, with traders recognizing that consolidation phases can create favorable positioning opportunities when backed by disciplined analysis and data-driven frameworks.
Transparency & Risk Management
A consistent theme throughout Bitcoin's consolidation period is the prioritization of structured risk management. Niagarahub reviews how professional trading systems integrate volatility controls, real-time risk monitoring, and allocation discipline to navigate channel-bound markets effectively.
Modern trading environments increasingly rely on automated exposure frameworks capable of adjusting positions based on volatility compression, funding trends, and liquidity concentration zones. This shift toward programmatic governance has strengthened market behavior, preventing excess leverage from destabilizing conditions during uncertain phases.
Enhanced transparency tools allow platforms to display real-time depth metrics, derivatives positioning imbalances, and execution flow imprints. This improves the accuracy of market interpretation and reinforces the importance of data verification — particularly when trading within confined price structures. Niagarahub reviews this emphasis on real-time auditability as core to the evolution of disciplined digital asset participation.
Additionally, dynamic hedging strategies and systematic drawdown controls support capital preservation, allowing traders to remain engaged without assuming unnecessary directional bias. Scenario modeling and risk-tier allocation frameworks have become standard practice, reflecting a market structure where transparency and discipline guide engagement.
Industry Outlook
Bitcoin's sustained movement within a long-term channel illustrates both structural patience and anticipation. Niagarahub reviews this environment as one shaped by macroeconomic conditions, liquidity distribution across financial markets, and evolving interest-rate expectations. As global capital adjusts to broader economic signals, traders recognize that consolidation phases precede decisive outcomes.
Institutional sentiment remains attentive to regulatory clarity developments, monetary guidance, and cross-asset correlation signals. With volatility cycles historically following extended compression phases, the long-term channel continues to draw interest from systematic funds and macro-driven strategies seeking confirmation of trend direction.
Market participants increasingly view consolidation periods not as stagnation but as setup phases—where accumulation, hedging, and volatility preparation lay groundwork for the next expansion cycle. Niagarahub reviews how strategic patience, driven by analytics and automation, remains central to navigating transitional phases.
The broader market narrative continues to emphasize transparency, technological progression, and structured governance. These elements collectively strengthen market infrastructure and support confidence as Bitcoin approaches potential structural inflection points.
Closing Statement
As Bitcoin trades within its long-term channel, traders remain vigilant for technical confirmation and liquidity shifts that could spark directional expansion. Niagarahub reviews this environment as one shaped by discipline, data depth, and evolving market intelligence — where long-term positioning and transparent systems support measured decision-making across cycles.
As market conditions evolve, platforms that emphasize transparency and innovation will be closely watched by traders and investors alike.
