BITCOIN MONTHLY RSI Trend lineCheck the MONTHLY RSI Trend on Bitcoin, the first level to see is a HIGHER high on the trendline below and once BTC tests the upper trend line, MOST likely a clear sign to exit. There is ample scope on the upside, so keep a close watch.
BTCUSD.P trade ideas

BTCUSD Daily Double Bottom and Retest PossibilityIn the event that we get confirmations for a bearish correction, I will be looking to go long again when price retests of one of those lows indicated.
However, personally I would not count on any aggressive pullbacks in such a market.
#TheTrendIsAlwaysYourFriend

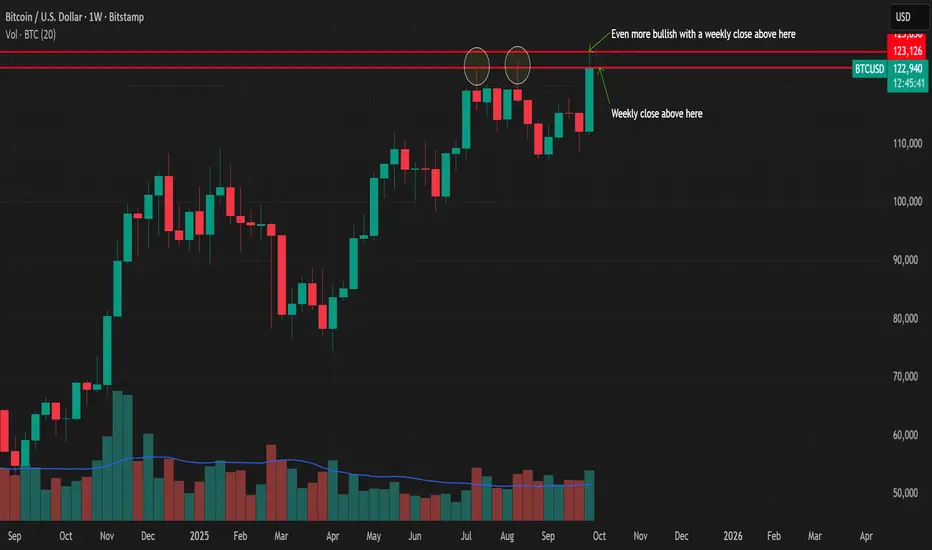
BTC Weekly Breakout AnalysisBitcoin is testing a critical resistance at ~$123K, marked by prior highs on July 14 and Aug 11, 2025.
A weekly close above this level today could ignite a bullish run above 130k, with a potential retest of $123K turning into support—setting up a bright Q4 ahead!
If no close above $123K, we might sideline a bit more, as momentum stalls.
Watch for volume confirmation and RSI >60 to back the breakout. Bear case: rejection drops us to $110K.
(DYOR, no FA)
Bitcoin follow upNow that early bear shorts 50x and up got rekt all the way to $125185 and now that our shorts with 10x got activated the question is what's next?
Well looking at present data and knowing that Daily tf still has TIME left to the upside but getting weak we can say that area between $123125 - $121735 will be strong sup to break once it gets there and most important how it gets there will tell us if $117865 will be the bounce point.

BITCOIN 2025: The Final Reset Has Begun
# 🚀 (A Vision Beyond the Charts)
*By IvanPatrice*
---
Most traders are staring at candles.
Few are watching **the clock.**
We are entering a **temporal zone** — a point in market structure where *time, liquidity, and human psychology* collide.
Every previous BTC supercycle — 2013, 2017, 2021 — aligned with the same **fractal rhythm**:
📈 Expansion → 📉 Purge → 📊 Accumulation → 🚀 Eruption.
Guess where we are now?
Right in the middle of the **silent accumulation vortex** — the moment before everything *detonates upward*.
---
### 🔍 The Data No One’s Looking At:
1️⃣ **MVRV Z-Score** has reset to the zone that preceded 2019’s 300% rally.
2️⃣ **Hashrate growth** is diverging from price — a signal that miner confidence is *outpacing market fear.*
3️⃣ **Dormant wallet activation** is climbing — long-term holders are *waking up early.*
These aren’t random metrics. They’re whispers from deep liquidity — the same whispers that warned of 2017’s eruption months in advance.
---
### ⚡ The Prediction:
BTC isn’t just preparing for another bull run —
It’s preparing for a **monetary rotation event**.
My model projects:
> 📍 **$48,200 – December 2025 (confirmation stage)**
> 📍 **$97,000 – April 2026 (first euphoria peak)**
> 📍 **$186,000 – 2027 cycle top**
Not because of hype, but because global capital is *seeking a firewall against debt decay.*
---
### 🧠 The Vision:
Most traders chase signals.
Real investors chase **energy shifts.**
Bitcoin isn’t competing with fiat anymore — it’s absorbing it. Every dip below $50K is *a historical gift* wrapped in fear and disbelief.
The next generation of traders will look back at this chart and whisper:
> “This was the moment the old system cracked.”
---
💭 What’s your vision?
Do you believe Bitcoin is preparing for its **final monetary breakout**, or are we still too early?
Let’s hear your perspective 👇
— **IvanPatrice**

BTC Bias - HTF - Plan - 06.10-12.10New BTC ATH. ETF volume is ripping and it feels up-only. How long can this run - and what’s next? I’m mapping scenarios and key levels. Let’s see how it plays out.

BTCUSD – Swing Short from Supply Ceiling (125k → 118k Target)Bitcoin entered a major supply zone around 125K–126K after a vertical rally from 108K. Multiple VWAP confluences and dense liquidation bubbles show trapped longs and distribution by smart money. I’m short from 125K with a stop at 130K and target at 118K for a 1:1.3 R/R. Expecting a mean reversion as the crowd buys the breakout and whales sell into strength.

btc usd long target hit so from yesterday i took some profit on pervious idea before coming back to entry so then i waited for a sweep of price respected by key level for entry as you can see overnight it has pushed to the upside taking my original fib level of the 15 m range i marked out and continuing to make a new all time high

Bitcoin Swing Trade Setup – Institutional Inflows Fuel Bulls🎭 BTC/USD – Money Heist Plan 🚀 (Swing + Scalping Strategy)
📊 BTC/USD Real-Time Market Data
Current Price: $111,156.01
24h Change: +$2,117.61 (+1.94%)
Day’s Range: $108,540.93 – $111,180.45
52-Week Range: $49,538.00 – $123,640.00
😰 Fear & Greed Index
Score: 49/100 → Neutral 😊
Trend: Shifted from “Fear” to “Neutral” in the last 24 hours.
🧠 Investor Sentiment Outlook
Retail Traders: Cautious (63% worry about crypto safety).
Institutional Traders: Bullish (💵 $3.7B net inflows in August).
🌍 Fundamental & Macro Score
Policy Uncertainty: High (U.S. tariffs, Fed policy shifts).
Fed Rate Cut Probability: High (expected September cut).
Key Event: Non-Farm Payrolls (Sept 5; forecast 45K jobs).
Gold Rally: $3,508/oz (+30% YTD, strong hedging demand).
🐂 Market Outlook
Short-Term: Neutral → Slightly Bearish (September volatility ahead).
Long-Term: Bullish (Institutional inflows + macro liquidity).
Bull/Bear Score: 55% Bullish vs 45% Bearish.
🎯 Thief’s Trading Plan (Layered Entry Strategy)
I’m setting up multiple limit orders (“Thief Layers”) instead of going all-in — this spreads risk, builds better entries, and keeps flexibility.
Entry (Layered Buys):
$109,000 → $109,500 → $110,000 → $110,500
(Add more layers as per your own strategy)
Stop Loss (Thief SL):
$107,500 (Adjust for your own risk appetite)
Target Zone (Profit Extraction):
$116,000 (Checkpoint before major resistance zone)
💡 Key Takeaways
BTC rebounded +1.94% but faces headwinds from whale profit-taking & policy risks.
Neutral sentiment (49/100) reflects a balanced investor mood.
Friday’s NFP jobs data could shape Fed rate expectations → big volatility catalyst.
🔍 Related Pairs to Watch
BITSTAMP:ETHUSD | COINBASE:SOLUSD | BITSTAMP:XRPUSD | BINANCE:BTCUSDT | CRYPTOCAP:BTC.D
#BTCUSD #Bitcoin #CryptoTrading #SwingTrade #Scalping #TradingStrategy #LayeredEntries #CryptoCommunity
✨ “If you find value in my analysis, a 👍 and 🚀 boost is much appreciated — it helps me share more setups with the community!”

Risky Reversal trade BTC 1:2 Risky 1:2 reversal trade taken after buyers showed weakness in pushing price to a new all-time high (ATH). This setup was based on order flow analysis and a fair value gap (FVG), indicating a potential shift in momentum.

BTCUSD roadmap (linear)IHS 3.618 price target incl fbo of bear flag channel
Not financial advice, just my theory to match log

Update on my purchase of bitcoinMy super AI program gave me a buy signal last week on ##Bitcoin.
I was planning on staying out. But it has been so accurate I am not legally allowed to tell anyone.
Checking the price it was $1235000.
I am just following my signals.
High-Probability Long at Round Number Resistance Post-ATHTrade Setup Overview
Risk-Reward Ratio: 1:2
Entry Zone: Confirmed resistance at the round number 122.00
Price Action: Price is retracing back into the order flow channel, aiming toward the Point of Control (POC)
Context & Confluences:
✅ Trend Direction: Overall trend is up
✅ Channel Breakout Attempt: Price attempted to break out of the channel, failed, and re-entered with aggressive buyers stepping in
✅ FVG (Fair Value Gap): Identified on the 1-minute timeframe, aligning with the area of aggressive buying
✅ Confirmation via Bookmap: Buyer activity confirmed on Bookmap at the identified FVG zone
✅ Key Level: Strong round number (122.00) adds further confluence
✅ Rule-Based Trade: All trade entry rules and confirmations are met
Caution:
The only concern is timing — this setup occurred over the weekend, outside of the active New York session. However, given that the market just reached a new all-time high (ATH), there is a strong likelihood of volatility resuming in the next session.
Conclusion:
This trade meets all criteria and is backed by technical confluence, order flow confirmation, and alignment with market structure. Despite the timing concern, it's a high-probability setup worth considering.

BTCUSD Technical Forecast: Navigating the Upper EchelonsAsset: BTCUSD | Current Price: 122,491.82 | Analysis Date: | Timezone: UTC+4
🎯 Executive Summary & Market Context
BTCUSD is trading at a formidable all-time high level near $122,500. This analysis examines whether this rally has the fuel to continue or if a significant correction is imminent. The confluence of several technical patterns and indicators suggests we are at a critical juncture. Geopolitical and macroeconomic factors, including institutional adoption and regulatory clarity, continue to provide a strong bullish undercurrent, but technical exhaustion signals are beginning to flash.
📊 Multi-Timeframe Technical Breakdown
Swing Trading (4H, Daily, Weekly) - The Big Picture
Primary Trend: Strongly Bullish on higher timeframes (Daily, Weekly).
Key Pattern Confluence:
Elliott Wave Theory: The rally from the last major swing low is best counted as a powerful Wave 3. We are now likely in a late-stage Wave 5 or a complex corrective Wave 4. A decisive break below the key support at $118,000 would signal that Wave 4 correction is underway, targeting the 0.382 Fibonacci level near $110,000.
Wyckoff Theory: Analysis suggests we may be in a Re-Distribution phase. The sharp rise (Upthrust) is being tested. A failure to hold above $120,000 with decreasing volume could confirm this, leading to a Sign of Weakness (SOW).
Ichimoku Cloud (Daily): The price is far above the Kumo (Cloud), indicating a strong trend but also signaling an overextended market. The Tenkan-sen (blue line) is acting as dynamic support near $119,500. A break below this would be the first sign of weakening momentum.
Head and Shoulders? A potential, large-scale bearish Head and Shoulders top is tentatively forming, with the left shoulder around $115k, the head at this peak (~$123k), and a potential right shoulder to form. This pattern would only be confirmed by a break below the neckline, which would be projected around $105,000.
Swing Trading Key Levels:
Resistance (R1): 124,200 (Recent High)
Resistance (R2): 127,500 (Psychological & Gann Angle)
Support (S1): 119,500 (Ichimoku Tenkan-sen)
Support (S2): 118,000 (Critical Wave 4 Invalidation)
Support (S3): 110,000 (0.382 Fib & Major Swing Zone)
Swing Trade Idea:
Scenario A (Bullish Continuation): Wait for a pullback to the S1 ($119,500) or S2 ($118,000) support confluence with bullish reversal candlesticks (e.g., Hammer, Bullish Engulfing). Enter long with a stop loss below S2, targeting R1 and R2.
Scenario B (Bearish Reversal): If price rejects R1 and breaks below S2 ($118,000) on high volume, consider a short position for a swing down towards S3 ($110,000), with a stop loss above R1.
Intraday Trading (5M, 15M, 1H) - Precision Execution
Intraday Bias: Neutral to Cautiously Bullish, but highly volatile. Be nimble.
Key Indicators & Patterns:
Anchored VWAP (from yesterday's low): The price is trading above the VWAP, indicating a Weak Bullish intraday trend. A break below the VWAP would shift the intraday bias to bearish, targeting the lower Bollinger Band.
Bollinger Bands (20,2) on 1H: The price is hugging the upper band, suggesting sustained buying pressure but also overbought conditions. A move to the middle band (20 SMA) around $121,200 is a likely intraday pullback target.
RSI (14) on 1H: Reading is near 65. It is not severely overbought (>70), but shows room for a minor correction before the next leg up.
Candlestick Patterns: Watch for Bearish Engulfing or Evening Star patterns at the R1 resistance for short signals. Conversely, Bull Flags or Bullish Hammers near the VWAP or 20 SMA provide long entry signals.
Intraday Key Levels:
Resistance (R1): 123,000 (Psychological)
Resistance (R2): 123,800 (Today's High)
Support (S1): 121,800 (Current Session Low)
Support (S2): 121,200 (1H 20 SMA / Bollinger Midline)
Support (S3): 120,500 (VWAP & Strong Intraday Support)
Intraday Trade Plan for the Session:
Long Entry: On a bounce from S2 ($121,200) with a bullish candlestick confirmation. Target: $122,500 - $123,000. Stop Loss: 20 pips below entry.
Short Entry: On a rejection at R2 ($123,800) with a bearish candlestick confirmation, or a break below the VWAP (S3). Target: S2 ($121,200). Stop Loss: 20 pips above entry or R2.
⚠️ Critical Risk Analysis: Trap Formations
Bull Trap: A classic bull trap is set if the price makes a swift, low-volume spike above $124,200 (R1), luring in late bulls, before sharply reversing to close below $120,000. The Wyckoff Re-Distribution scenario aligns with this risk.
Bear Trap: A bear trap occurs if the price wicks down sharply, breaking below $118,000 (S2) and triggering stop losses, only to reverse aggressively and reclaim that level, squeezing shorts and fueling the next leg up. This would invalidate the bearish Elliott Wave 4 count.
📈 Indicator Snapshot & Confluence
✅ Conclusion & Final Outlook
Bullish Case: The trend is your friend. The price remains above all critical moving averages and the Ichimoku Tenkan-sen. A hold above $118,000 opens the path for a test of $127,500.
Bearish Case: The market is overextended. The potential for an Elliott Wave 4 correction, a Wyckoff Re-Distribution, or a large-scale Head and Shoulders pattern presents significant downside risk towards $110,000.
Trading Recommendation:
For swing traders, the risk/reward favors waiting for a pullback to stronger support zones ($118k-$119.5k) before entering new long positions, or waiting for a confirmed break of support to play the short side. For intraday traders, trade the range between the key levels defined above, using the VWAP and Bollinger Bands as dynamic guides. Position sizing and strict stop-losses are non-negotiable at these elevated levels.

We have a diamond.When a megaphone and a symmetrical triangle intersect, a diamond is formed — a 100% bullish pattern that completes the previous setup and should take us above 130K.

A Clear BTC Weekly Outlook (Week 40 - 2025)We are reaching to the close of the weekly candle in BTCUSD.
Despite these are no new prices, managing to close above the marked red line would mean that the market is accepting higher closure prices on a weekly basis, and it would be the first time.
Now, there are a couple possible scenarios moving forward.
AGGRESSIVE BULLISH SCENARIO : The market closes above resistance, without rejection, retests the zone and takes off to price discovery. There would still be a last line of Bearish defense, called the "Parabolic Gate" which is that sort of projected top line that desperate Bears start drawing when they run out of levels to the upside. But apparently its common practice, so we gotta take that into account, it is what it is.
CONSERVATIVE BULLISH SCENARIO : The market fails the aggression of the previous ATH rejection. In this case we would have to revisit lower levels of Demand to gather the necessary momentum for a second attempt.. or a third in this case. There are plenty of levels on the way down, therefore I don't see the necessity to retrace below the 90kish area.
BEARISH SCENARIO : Governments around the World are coming up with creative ways to steal you Bitcoins, there is no Bearish Scenario bro. Hold tight onto them.
I invite you to not underestimate the complexity of the UP ONLY cycle. Trading under these market conditions is not as easy as it seems. I recommend to be sitting comfy in SPOT, especially if you don't know what you're doing.
We'll give it another look, together, next week.
Until then
Stay Safe!

$BTC to $180K.Elliott Wave Analysis of recent price action.
Leading diagonal for a Wave 1, leading to a Wave 3 towards the 1.618 Fib Extension ~ $188K.

btcusd shortwelcome
here is my btcusd short idea
its based on 1 simple rule : buy low , sell high
we touched the highs from mid august 2025
big sellers are active at price 123.700 & 122.700
if possible new buyers will enter the floor now and flood the market with fresh new buy orders and buyers stops , this will cause further price drops
in my view, big buyers sit around 116.000-114.000 and will may enter big orders at this price, that means that its most attractive for the price to drop to 116-114...
very tight stop with about 1100$ on a whole coin
thanks to be part of this possibility
enjoy

ElDoradoFx PREMIUM 2.0 – Weekend Bonus BTCUSD Analysis 04/10/25
BTC is trading around 122,280, consolidating after an explosive rally of over +11,000 pips from the 110,600 demand zone. After a strong bullish impulse, momentum is slowing as price hovers near short-term resistance.
⸻
🔍 Technical Outlook
Daily (1D):
BTC printed a massive bullish breakout from the descending channel, rallying from 110,600 to 123,800 before facing rejection at 123,900 — a previous structural high and psychological resistance.
• MACD: strong bullish momentum but starting to flatten, suggesting exhaustion.
• RSI: near 70, indicating overbought conditions.
• Parabolic SAR: still below price (bullish bias intact).
→ The daily structure remains bullish, but pullbacks are likely before continuation.
Intraday (1H):
Price is forming a short-term range between 121,950–122,900.
• The 200 EMA (white) is below price at 120,800, confirming ongoing bullish structure.
• However, MACD histogram shows decreasing buying volume and potential cross to the downside → early sign of correction.
• RSI hovering around 55–60, neutral zone → consolidation after high volatility.
Short-Term (15M / 5M):
BTC is showing lower highs while holding the 122,150–122,250 zone, building a potential bull flag.
• On the 15M chart, a small descending channel connects the highs at 122,790 → 122,460 → 122,300.
• 5M chart shows repeated liquidity sweeps below 122,180, followed by immediate rebounds → strong short-term demand.
Fibonacci Golden Zone (from swing low 120,779 → swing high 123,887):
Golden zone = 122,000–122,300 — BTC is trading exactly inside it now, offering a high-probability reload area for buyers if defended successfully.
⸻
📈 High-Probability Entry Zones (Max 60 pips SL)
🎯 Buy Setup (Fibonacci Golden Zone Support):
• Entry: 122,000–122,200
• SL: 121,900 (below structure)
• TP1: 122,600
• TP2: 122,900–123,000
• TP3 (extended): 123,800 (previous high)
→ Confluence: Fib Golden Zone + short-term EMA support + strong RSI defense.
🎯 Sell Setup (Short-Term Resistance Rejection):
• Entry: 122,850–123,000
• SL: 123,100
• TP1: 122,450
• TP2: 122,100
→ Only valid if price fails to hold above 122,850, confirmed by bearish candle structure on 15M.
⸻
📌 Breakout Levels to Continue Trend
• Bullish Continuation: Above 123,000–123,200 → momentum could extend into 123,900–124,400.
• Bearish Continuation: Below 121,900 → opens correction toward 121,200–120,800 (EMA + liquidity pool).
⸻
📅 Fundamental Watch (Weekend)
• No major events until Monday.
• Weekend liquidity is extremely thin, expect sharp stop hunts and sudden wicks.
• CME futures closed at 122,350 → small gap risk on Sunday open.
• Market sentiment remains cautiously bullish after strong week for risk assets.
⸻
⚠ Key Technical Zones
Resistance:
• 122,850 → 123,000 → 123,900 (major)
Support:
• 122,000 → 121,900 → 120,800
⸻
✅ Summary
BTCUSD is consolidating inside the Fibonacci golden zone (122,000–122,300) after a massive breakout week. The bias remains bullish while above 121,900, but momentum is slowing. Scalpers can buy dips within the golden zone for short-term 200–600 pip reactions. A clean breakout above 123,000 confirms bullish continuation, while a break below 121,900 triggers a correction toward 120,800.
— ElDoradoFx PREMIUM 2.0 Team

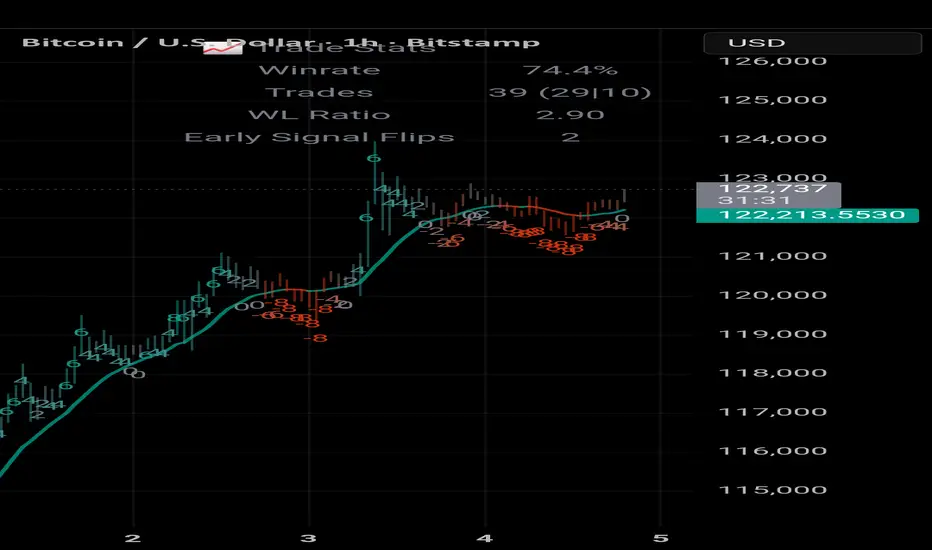
Play for play accuracywatching the rest of the price action unfold shows the sophistication of the AI
Not only on the big moves, but the granular moves in-between.
TradeTech evolution
Bitcoin double bottomdo not be suprised or we fall back to 117.5k.
bitcoin has double bottomed at 107-109k.
the double bottom breakout zone was 117.5k
a retest to this level would be very healthy and would only give a buy signal to alot of traders who dont buy breakouts but buy the retest.
I do not say it will retest but if it comes down. 117.5k would be the buy target.

BTC is facing Resistance at previous Life time High.BTC is facing Resistance at previous Life time High. It may retrace littele bit for some correction before moving furthur upwards.

BUYERS CONTINUES TO WAX STRONGER IN BTCUSD We can see how price surged higher for days now. Price rebounded around the 109k price level and currently, it’s trading at 122k. I anticipate more bullish price action to develop away from the current market price. I anticipate a new all time high to be made on BTC. A buy opportunity is envisaged.
