BITCOIN analyse// SO right now bit is trying to break the all time high and it comes with lots of fomo so you should be careful because if we brake that level there is no high and low or resistance but you must check the order flow and the money is coming in bit by checking volume order good and...
i think we can have a very very good move if we break that 123,200 with a candle closed above that and i prefer stop order because of that fomo that people don't want to miss a big move and they buy
// normally i would say btc.d MUST go up so we can have a real bull run but right now i dont think that so necessary but if btc.d go up its better but we can still have a bull run but btc.d ranging
// usdt.d is still down trend that is very good if we keep that bull run in bit can be better and bigger and now we are hitting a important support 4.20 that if we break that it could be very good
''/''/''/'' now you can wait for break in bit and enter early that i think even if you hit stop loss there will be no problem right now we have so many chance to enter so you can enter early but be careful dont be like ''oo we gonna hit tp get rich'' you can but still expect a stop loss do not put 100 percent of your balance
BTCUSD.P trade ideas

BTC target 139-140k beforre crashingThis is an old chart , inverse H&S , right shoulder now forming, end of bull cycle targeting 139/140k area, then bear cycle starting and massive dump to 85-90k area

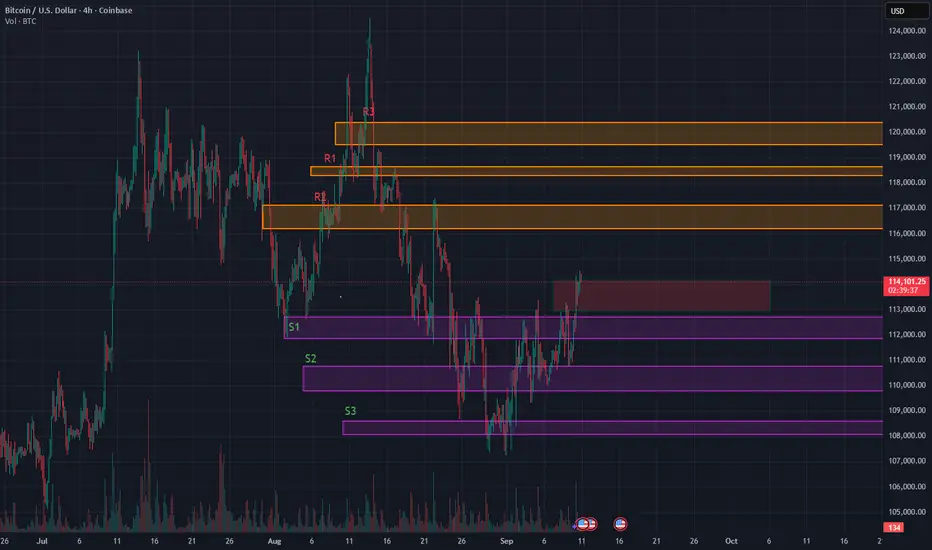
Range-Bound Rocket: BTC’s Coiled Spring Between S1 and R3-ATHRange Bound Rocket: BTC Loaded and Coiled for $120k Retest
Description:
BTC is now trading around $114,260, still inside the range I’ve flagged earlier. We reloaded at our previously posted support zones between $110k and $111k. That gives us a strong base.
I’m watching for acceptance above the $113k to $114k red box, which overlaps with the neckline of a potential reverse Head & Shoulders on the 4‑hour chart. It hasn’t triggered yet but we are in validation mode. (expecting a retest to 113k and then a break up) If we get a breakout with volume expansion and wide‑bodied candles, I’ll treat that as a valid activation. Target remains $119k and above.
This table shows how likely BTC is to stay above certain price levels over the next two weeks based on current volatility. These are not predictions, they represent statistically expected ranges based on price behavior.
2WK/Probability, Price Level, Meaning
90%, ~$96,700 BTC is very likely to stay above this level
75%, ~$103,200 BTC has a strong chance of staying above here
50%, ~$111,000 This is the midpoint, BTC has equal chance of being above or below
25%, ~$119,400 BTC has a one in four chance of closing higher than this
10%, ~$127,400 Only a small percentage of outcomes put BTC above this level
Key takeaways:
BTC is currently trading around $114,260, sitting just above our red resistance zone at $113,000 to $114,000.
Our first upside target, $118,000, lines up with the top 25 to 30 percent range of expected outcomes. This is reachable if the broader market stays supportive.
$120,000 sits closer to the top 20 percent threshold. BTC would need strong momentum and favorable macro data to push there in the next two weeks.
Downside probabilities
While the structure looks bullish, we should still consider these potential retracement levels:
Around 46 percent chance BTC dips below $110,000
Approximately 43 percent chance it drops under $109,000
Roughly 30 percent chance BTC trades below $105,000
These downside paths are consistent with our S2 and S3 support zones, which were successfully defended during the last major pullback.
What I'm doing and suggest :
Breakout confirmation:
I’m looking to add above $113k to $114k only if volume expands and candles show conviction, meaning minimal wicks and strong closes. Weak volume or upper wicks mean the breakout could fail. Main stop is back inside the range. Scalpers can use a tighter invalidation below $112.2k.
Reload zone:
A move into $110k to $109k is a statistically common retest. I’ll look for buyer defense and fading downside pressure to reload.
Volatility risk:
I'm already positioned long from our previously posted support zones around $110k to $111k, so I’m not actively adding or hedging right now. Into CPI and the Fed, I’m staying hands-off unless we get a clear breakout or strong market signal.
For those not in position:
Avoid chasing breakouts before the event
Look for confirmation or reaction post-data
If we get a volatility spike, retests of $110k to $109k are still statistically common and may offer a better entry
The goal is to avoid being overexposed heading into binary catalysts. I’m holding my current spot exposure and letting the trade breathe.
If no breakout forms:
I expect BTC to remain in a range between $111k and $118k. Support zones from prior posts maintained a bullish bias. If BTC consolidates below $114k but keeps forming higher lows, I’ll consider that ongoing accumulation.
Catalysts to monitor:
Nasdaq or NQ breakdown
• Tech strength: Nvidia up ~30% YTD on strong Blackwell Ultra demand, ADI and MX showing strength despite macro headwinds.
Jobless claims rising again
• U.S. jobless claims are rising to 237K, signaling labor market cooling. Continuing claims are easing but job additions in August were weak at just 22K. Recent wide downward revisions (~911K fewer jobs year-to-date) reinforce rate‑cut bets.
Geopolitical risk
• Geopolitical tensions remain tail‑risks.
Fed rate tone and CPI reaction
• Fed tone and CPI outputs are increasingly important as data is tilting soft and markets are pricing in easier policy.
• The USD’s trajectory matters. Further weakness helps BTC and tech space gain more cushion.
Tech remains a key driver. AI and semis continue to lead Nasdaq strength, and BTC still tracks equity moves closely. A soft dollar also reduces market drag and supports upside potential.
Got 2 good transitions and timing outta this oneLooks like Bitcoin is fired up
I thought some chill was settling in...but BAM, it broke through the ceiling
Bitcoin has reclaimed $121,000Bitcoin has reclaimed $121,000 and is now targeting $123,000.
If $123K breaks, new ATHs are next.

BTC Key Levels — Eyes on the Yellow ZoneKey zones in Bitcoin… The yellow zone, which has also been optimized, is far more important and we need to watch closely to see how price reacts there

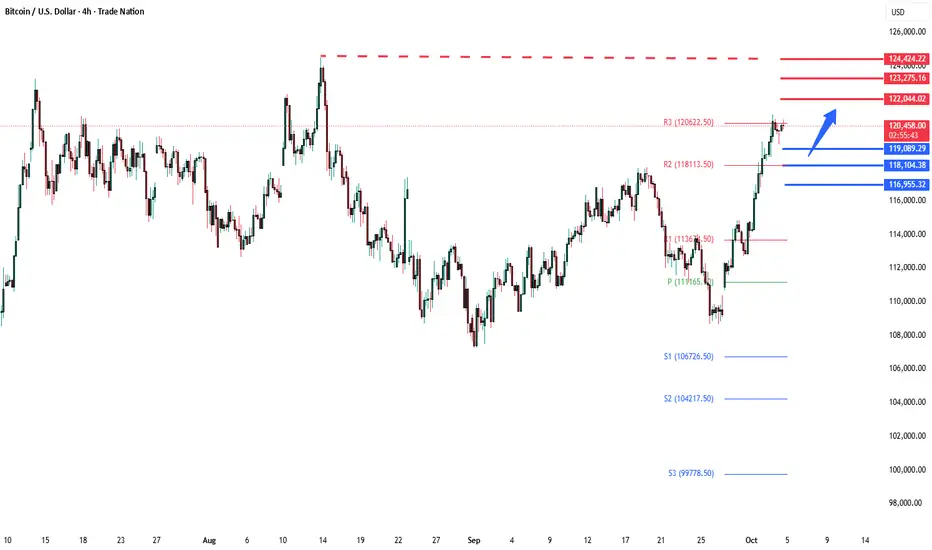
BTCUSD ATH retest ? The BTCUSD remains in a bullish trend, with recent price action showing signs of a corrective sideways consolidation within the broader uptrend.
Support Zone: 119,090 – a key level from previous consolidation. Price is currently testing or approaching this level.
A bullish rebound from 119,090 would confirm ongoing upside momentum, with potential targets at:
122,044 – initial resistance
123,280 – psychological and structural level
124,420 – extended resistance on the longer-term chart
Bearish Scenario:
A confirmed break and daily close below 119,090 would weaken the bullish outlook and suggest deeper downside risk toward:
118,100 – minor support
116,950 – stronger support and potential demand zone
Outlook:
Bullish bias remains intact while the BTCUSD holds above 111,180. A sustained break below this level could shift momentum to the downside in the short term.
This communication is for informational purposes only and should not be viewed as any form of recommendation as to a particular course of action or as investment advice. It is not intended as an offer or solicitation for the purchase or sale of any financial instrument or as an official confirmation of any transaction. Opinions, estimates and assumptions expressed herein are made as of the date of this communication and are subject to change without notice. This communication has been prepared based upon information, including market prices, data and other information, believed to be reliable; however, Trade Nation does not warrant its completeness or accuracy. All market prices and market data contained in or attached to this communication are indicative and subject to change without notice.

Ready For the New Bitcoin Daily Bullish Cycle? Better Be. Set up for new Bullish Daily Cycle is almost completed. Our job is to get ahead of the crowd. The starting point of the New Cycle is marked by the vertical blue line (if not sooner).
We have a nasty Red Candle that shows enthusiasm of people willing to keep betting in the direction of the current downtrend. It will be nice to see Bitcoin printing a nasty bearish wick on the 4hrs to get rid off all the new wanna get rich quick traders that just entered with 50x and above, that will help to push the new Cycle to a good start.
With nasty wick or without it we are going UP even tho the Daily Trend as of now is weak but that can change during next week. We'll follow the move.
How high it will go this TIME that nobody knows, what I do know is that it will go and test its Zero Line of $112225 so Placing a long order (SPOT) below $107500 with low lev (10x or less) in case that a nasty wick is printed is a good idea.
Don't be afraid of get in early because we are going higher.
Play it right, play it safe. Know the rules of the game. Use low lev recommended.
Have a nice trading weekend everyone.


BTC at Critical Channel Midpoint | Breakout or Rejection?Bitcoin is now testing the $120K–124K resistance zone, right under the mid-line of the long-term ascending channel. Price action here will decide the next major move.
🔼 Bullish scenario: A daily close above $124K would confirm strength, opening the path toward $131K–136K, and eventually the upper channel trendline.
🔽 Bearish scenario: Failure to hold this zone could trigger a retrace back to $113K–117K, with deeper support at $105K and $95K.
We successfully anticipated the last downside move and closed our position around $109K, locking in profit before this rebound. At current levels, risk is elevated — some may consider short opportunities if rejection confirms. For buyers already in profit, we recommend setting stop-losses and being ready to close positions if the situation turns bearish.
Macro context: ETF inflows and cycle indicators support upside potential, but U.S. macro risks (government shutdown, Fed policy uncertainty) remain a strong headwind.
⚖️ Conclusion: Today is a decision day. Breaking the channel midpoint unlocks higher targets, while rejection could push BTC lower again.
❗ Disclaimer: This is not a trade recommendation. I’m only sharing my personal thoughts on the market.

BTC 03.10Bitcoin is reacting from an important zone, but I don't see any confirmation for a short position from the current levels. I expect a rally in the local range of 121-117-115. Alta might shoot up around that time, but I hope it doesn't hit my knees. There are no significant resistance levels above that, and there are important local supports – zones S1 and S2. The long setups are from yesterday, and I'll be assessing shorts based on the situation. I don't see any options other than the nearest 130,000.
Support zones:
116770-117410
115390-115890
113.9-114

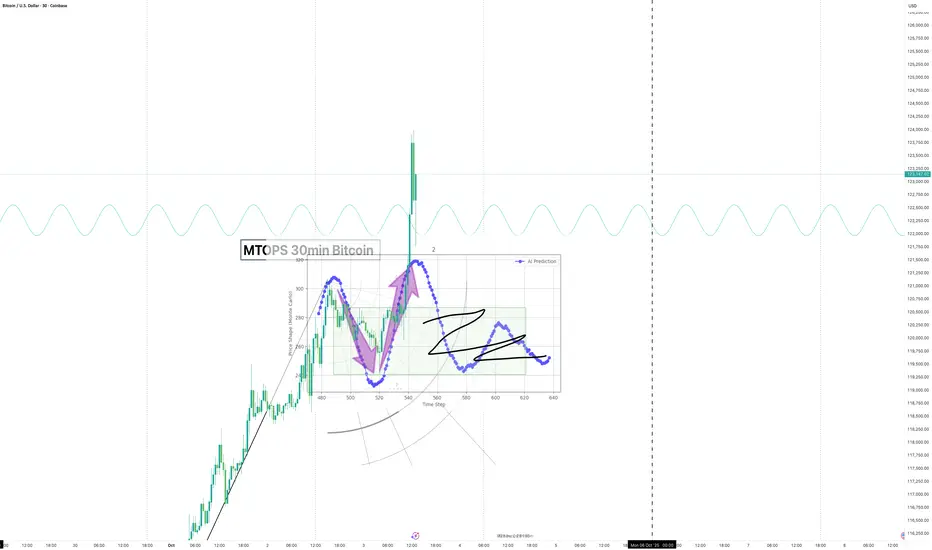
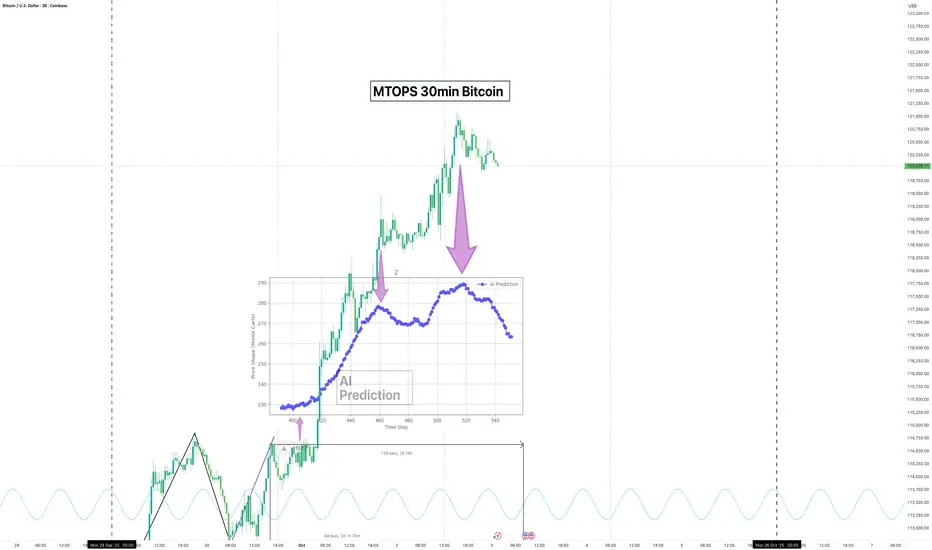
Concluding this AI Forecast: SuccessConcluding this forecast as we finally have a turning point coming in
The trick I am in the process of figuring out is getting the scaling of the image correct over the chart.
I used 99 bars which seemed okay, but in this instance 128 bars was the better fit.
Foreign Institutional Investors and Their Impact on Investment1. Overview of FIIs
FIIs have gained prominence in the last few decades due to globalization, liberalization of capital markets, and the increasing integration of global financial markets. They are different from Foreign Direct Investment (FDI) because FIIs primarily invest in portfolio instruments such as stocks, bonds, and derivatives, rather than acquiring a controlling stake in companies.
FIIs invest in countries seeking higher returns and portfolio diversification. Emerging economies often attract FIIs because of their high growth potential and relatively higher interest rates compared to developed markets. India, since the 1990s, has witnessed a substantial inflow of FII capital following economic liberalization policies.
2. Channels of FII Investment
FIIs invest through multiple channels:
Equity markets: Purchasing stocks of listed companies.
Debt markets: Buying government bonds, corporate bonds, and other fixed-income instruments.
Derivatives markets: Engaging in futures, options, and swaps to hedge or speculate.
Real estate and infrastructure funds: Though less common, some FIIs participate in structured investment vehicles.
In India, FIIs require registration with the Securities and Exchange Board of India (SEBI) and operate under specific investment caps to ensure market stability.
3. Positive Impacts of FIIs on Investment
3.1. Capital Formation
FIIs bring a significant amount of capital into domestic markets. Their investments contribute to liquidity, improve market depth, and facilitate capital formation. This influx of funds allows companies to access more resources for expansion, research and development, and operational efficiency.
For example, in the Indian equity market, periods of high FII inflows often coincide with rising stock market indices, signaling strong investor confidence and abundant capital availability.
3.2. Market Efficiency and Liquidity
FIIs bring in sophisticated investment strategies and advanced risk management practices. Their presence enhances market efficiency by improving price discovery—the process by which asset prices reflect all available information.
Additionally, FIIs increase market liquidity. High liquidity reduces transaction costs, narrows bid-ask spreads, and allows both domestic and international investors to trade large volumes without significantly impacting market prices. This is particularly beneficial for emerging markets where domestic investor participation may be limited.
3.3. Encouragement of Best Practices
FIIs often demand transparency, corporate governance, and accountability. Their investment criteria encourage domestic firms to adopt international best practices in financial reporting, risk management, and corporate governance.
For instance, companies seeking to attract FII investments may improve their disclosure norms, adhere to strict accounting standards, and implement robust board oversight. This has long-term positive effects on the investment climate.
3.4. Diversification for Domestic Markets
FIIs bring global perspectives to domestic markets. Their investment strategies, based on diversified global portfolios, encourage the domestic financial system to mature. This international participation mitigates market segmentation and reduces reliance on local investors alone.
3.5. Encouragement of Derivatives and Sophisticated Financial Products
FIIs often engage in complex investment products such as derivatives, structured products, and debt instruments. Their participation accelerates the development of sophisticated financial markets. India’s derivatives market, including index futures, options, and currency derivatives, has grown largely due to active FII participation.
4. Potential Negative Impacts of FIIs on Investment
Despite their benefits, FIIs can also have destabilizing effects on domestic markets.
4.1. Market Volatility
FIIs are often driven by global economic conditions, interest rate differentials, and risk appetite rather than local fundamentals. Rapid inflows during bullish phases can inflate asset prices, leading to bubbles. Conversely, sudden outflows during global crises or geopolitical tensions can trigger sharp market corrections.
For example, during the global financial crisis of 2008, many emerging markets, including India, faced abrupt FII withdrawals, causing stock market crashes and currency depreciation.
4.2. Exchange Rate Fluctuations
FII inflows increase demand for domestic currency, often causing appreciation, while sudden outflows lead to depreciation. Such volatility can impact exporters and importers, create inflationary pressures, and destabilize macroeconomic management.
4.3. Short-term Investment Focus
FIIs may prioritize short-term gains over long-term investments. This can lead to speculative trading, herd behavior, and excessive market fluctuations. Domestic investors may face challenges as FII actions amplify market swings, making long-term planning difficult.
4.4. Systemic Risk
High dependence on FIIs can make a country vulnerable to external shocks. Since FII decisions are influenced by global financial markets, policy changes in the US, Europe, or China can have an outsized impact on local markets. Emerging economies must maintain robust regulatory frameworks to mitigate such risks.
5. Regulatory Framework and Controls
Governments and regulators recognize both the advantages and risks of FII participation. India, for instance, has a robust regulatory framework managed by SEBI and the Reserve Bank of India (RBI).
Key regulatory measures include:
Registration requirements: FIIs must be registered with SEBI before investing.
Investment limits: Caps are imposed on FII investment in individual companies and sectors to prevent market dominance.
Disclosure norms: FIIs are required to disclose holdings and trading activity periodically.
Derivative restrictions: Limits are imposed on derivative trading to control speculative behavior.
Such measures aim to encourage long-term investment, stabilize markets, and maintain financial integrity.
6. Case Studies: FIIs in India
6.1. 1990s Liberalization
After India liberalized its economy in 1991, FIIs were allowed to invest in the stock markets. The inflow of foreign capital helped stabilize the Indian economy, provided liquidity to the equity market, and facilitated industrial expansion.
6.2. 2007–2008 Bull Run and Global Crisis
Between 2005 and 2007, India witnessed massive FII inflows, leading to a stock market boom. However, the 2008 global financial crisis triggered rapid FII withdrawals, causing a sharp market crash. This highlighted both the opportunities and risks associated with foreign institutional participation.
6.3. Post-2014 Reforms
After 2014, policy reforms, including the introduction of the Goods and Services Tax (GST), ease of doing business improvements, and liberalized FDI policies, attracted renewed FII interest. This stabilized markets, increased capital availability, and improved investor confidence.
7. Impact on Different Asset Classes
7.1. Equity Markets
FII inflows often drive stock prices in emerging markets. A surge in FII investment can boost market indices, while massive outflows can depress stock prices.
7.2. Bond Markets
FII participation in government and corporate bonds influences yields. Heavy FII purchases reduce yields, while sudden sales increase yields and borrowing costs for the government and corporations.
7.3. Derivatives and Commodities
FIIs engage in hedging and speculative strategies, impacting derivatives prices and volumes. Their presence enhances market depth but also introduces potential volatility in highly leveraged instruments.
8. Macroeconomic Implications
8.1. GDP Growth
FII inflows indirectly boost economic growth by increasing capital availability, encouraging investment, and promoting financial sector development.
8.2. Inflation and Interest Rates
Sudden inflows can appreciate the local currency, reduce import costs, and moderate inflation. Conversely, outflows may depreciate the currency, raising import costs and inflationary pressure.
8.3. Policy Challenges
Central banks must carefully manage liquidity and exchange rates to balance FII influence with domestic economic stability. This requires interventions in forex markets and prudent monetary policy.
9. Strategies to Optimize FII Impact
Governments and regulators can enhance the positive impact of FIIs while mitigating risks:
Encourage long-term investment through differentiated tax policies.
Monitor and manage liquidity to reduce sudden shocks.
Maintain transparency and improve market infrastructure to attract stable, quality investments.
Promote domestic institutional investors to reduce overdependence on FIIs.
10. Conclusion
FIIs play a pivotal role in shaping domestic financial markets. Their inflows bring liquidity, promote efficient markets, encourage global best practices, and contribute to economic growth. However, their short-term focus and susceptibility to global shocks can lead to volatility and systemic risk.
A balanced approach, combining regulatory oversight, robust domestic institutions, and market infrastructure, is crucial to ensure that FII participation benefits domestic markets sustainably. Emerging economies like India continue to benefit from FIIs, but maintaining equilibrium between foreign investment and domestic market stability remains a continuous challenge.
Bitcoin Harmonic Pattern , Target 105,000On the daily chart of Bitcoin, we can see the formation of a Gartley Pattern, one of the most well-known Harmonic Patterns. These patterns rely on Fibonacci Ratios and are typically used to anticipate a trend reversal after a strong move either upward or downward.
Recently, Bitcoin has reached a very important resistance zone between $120,000 – $121,000. The completion of the Gartley pattern in this zone increases the likelihood of a bearish correction.
Factors supporting a downside move:
Harmonic Pattern – Gartley: Completion at resistance provides a reversal signal.
PRZ (Potential Reversal Zone): Located near $120K.
Technical Indicators:
RSI shows overbought conditions, suggesting buying pressure is weakening.
MACD is close to a bearish crossover, another negative signal.
Volume: Buying volume is declining at recent highs, which often signals a distribution phase by large players and institutions.
📉 Support Levels:
The main target for the pattern is $105,500, a strong support level where price previously rebounded.
🎯 Trading Plan (Expected Scenario):
Potential Entry Zone: Between $120,500 – $121,000 (near resistance).
Targets (Take Profit):
TP1 = $114,000
TP2 = $110,200
TP3 = $105,500 (main target).
Stop Loss: Daily close above $121,800.
✅ Conclusion:
Bitcoin is currently at a very critical level, with the Gartley pattern completing right at resistance, combined with weakening technical indicators and declining volume. This supports the idea that the market may enter a short-to-medium term bearish correction with gradual downside targets ending near $105,500.
At the current zone, this is not considered a safe buying opportunity. Instead, it looks more like a selling opportunity or a case for waiting until price corrects to more favorable levels.
👍 Don’t forget to boost this trading idea if you found it helpful,
and follow me for more daily crypto insights and trade signals.
⚠️ Please note:
This is not financial advice – I’m only sharing my personal trades.
Always do your own research before taking action.
Best of luck 🌹

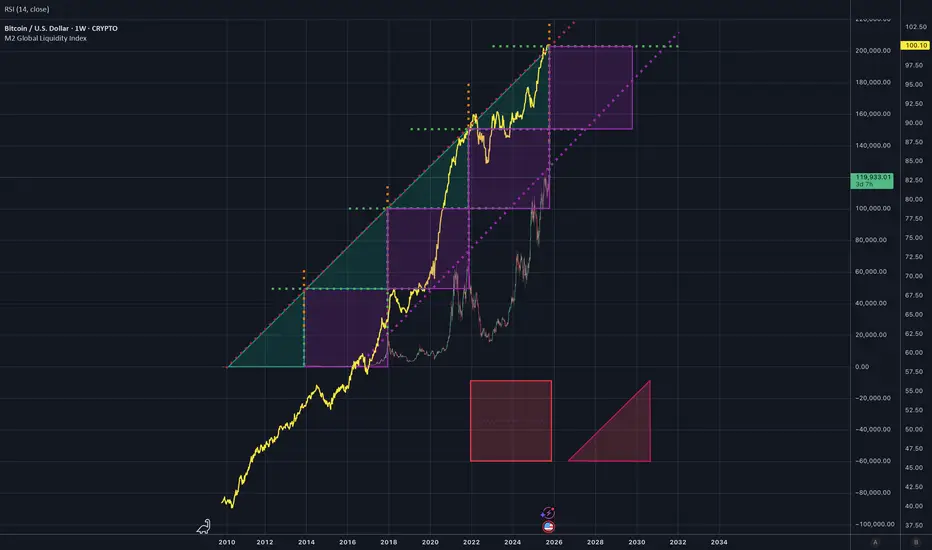
Patterns In Bitcoin ATH Against M2 Money Supplythere is a clear almost identical relationship between the ATH price of one cycle, and where that day lands on the M2 money supply. Mapping the trend lines between ATHs and the trendline of the M2 money supply on that day, we get triangles and rectangles with near identical shapes and sizes
Bitcoin market awaits fresh catalystsIntroduction
Bitcoin has entered a phase of subdued movement as the market awaits new catalysts to break the current equilibrium. After periods of heightened volatility earlier in the quarter, trading activity has slowed, with BTC/USD consolidating within a relatively narrow range. This consolidation reflects a combination of macroeconomic caution, diminishing near-term drivers, and the market’s search for directional clarity. VelorGain, a platform built around systematic analytics, observes that the present conditions highlight both resilience and restraint, underscoring the importance of monitoring structural signals that may define the next phase of market activity.
Technology & Innovation
VelorGain employs algorithmic modeling and adaptive AI systems to interpret market dynamics during consolidation phases. Its frameworks track liquidity distribution, derivatives positioning, and volatility compression, mapping conditions that often precede significant market shifts.
The platform’s innovation lies in its modular design. Models recalibrate as new data becomes available, ensuring outputs remain responsive to evolving conditions rather than relying on static assumptions. Visualization tools integrate technical structures such as support and resistance ranges with broader liquidity indicators, helping participants understand the interplay between short-term movements and long-term trend formation.
By emphasizing explainability, VelorGain avoids opaque forecasting and instead presents probability-weighted scenarios. This structure clarifies potential outcomes, whether the market awaits macroeconomic data, institutional flows, or shifts in sentiment to reignite directional volatility.
Growth & Adoption
As digital asset markets expand, adoption of structured analytic platforms continues to grow. Participants increasingly recognize that periods of consolidation are not pauses in relevance but critical windows where strategy and positioning are recalibrated. VelorGain has observed that user engagement rises when volatility compresses, reflecting demand for insights into whether quiet phases signal accumulation, distribution, or indecision.
Scalability remains a central focus. With transaction volumes rising across exchanges and correlations strengthening between digital and traditional assets, platforms require robust infrastructure capable of processing data at scale. VelorGain’s architecture is built to manage this demand, ensuring analytic consistency regardless of market tempo.
Broader adoption also reflects a shift in expectations. Rather than relying solely on speculative signals, traders and institutions increasingly integrate structured analytics into their decision-making processes. This highlights the role of platforms like VelorGain in meeting the need for clarity, particularly during periods when the market awaits new catalysts.
Transparency & Risk Management
Consolidation phases carry unique risks. While volatility appears muted, the potential for sharp moves triggered by unexpected catalysts remains high. VelorGain addresses this challenge by embedding transparency into its methodology. Inputs such as liquidity depth, funding flows, and order-book imbalances are explicitly weighted within its models, ensuring that outcomes are explainable and interpretable.
Risk management is a cornerstone of the platform’s approach. Instead of focusing on deterministic outcomes, VelorGain presents multiple scenarios with associated probabilities. This allows market participants to evaluate risks on both sides of the range, balancing opportunity with caution. Such clarity reduces overreliance on any single indicator and encourages measured engagement with digital assets.
By focusing on explainability, the platform aligns with an industry-wide emphasis on accountability. This is particularly relevant in quieter phases, where complacency can leave participants vulnerable to sudden volatility triggered by macroeconomic shifts or liquidity shocks.
Industry Outlook
Bitcoin’s current consolidation is reflective of broader trends in the digital asset sector. Regulatory discussions, global economic signals, and institutional flows continue to shape sentiment, even as immediate price action remains contained. The lack of strong catalysts underscores the market’s growing maturity, where activity levels are increasingly influenced by structural forces rather than speculative surges alone.
VelorGain reflects this shift toward structured analysis and measured positioning. By merging innovation with transparency, the platform illustrates the broader industry trend of moving from speculative behavior toward resilience and accountability. As Bitcoin waits for catalysts, platforms that provide structured clarity are likely to play a central role in how participants interpret and respond to changing conditions.
The outlook suggests that while near-term activity may remain muted, the structural trajectory of digital assets continues to evolve. Market participants will look beyond short-term quiet phases to assess how adoption, regulation, and global liquidity shape the longer-term path.
Closing Statement
As the Bitcoin market awaits fresh catalysts, the focus on transparency, adaptability, and structured analytics will remain central to how traders and investors interpret the next stage of digital asset development.

BTC/USD testing multi-week moving averageIntroduction
BTC/USD is currently testing a multi-week moving average that has acted as both support and resistance in recent months. This development marks a critical juncture in the broader price structure, as moving averages of this duration often serve as reference points for trend strength and momentum. Market participants are monitoring whether Bitcoin can sustain above this level to validate continued upside or if renewed weakness could trigger a return to prior ranges. TPKtrading, a platform built on systematic analysis and structured methodologies, highlights that this phase underscores the balance between market resilience and caution in a period shaped by macroeconomic crosscurrents.
Technology & Innovation
TPKtrading integrates algorithmic intelligence and AI-driven frameworks to assess how Bitcoin interacts with longer-term moving averages. Its models track order-flow dynamics, derivatives positioning, and liquidity depth, combining these inputs with technical overlays. By monitoring both immediate market reactions and historical parallels, the platform provides clarity on whether the test of the moving average signals accumulation, distribution, or neutral consolidation.
The technology emphasizes adaptability. Algorithms recalibrate as new data enters, ensuring that probability models remain relevant in real time. Visualization tools highlight how moving averages intersect with broader chart structures such as channels and trendlines, giving participants a clearer view of context. This modular design supports explainability, allowing traders and analysts to understand how each factor contributes to model outcomes rather than relying on opaque outputs.
Innovation within TPKtrading lies not in predicting absolute outcomes but in clarifying scenarios. By presenting multiple paths with associated probabilities, the platform enables a structured approach to conditions where moving averages act as pivot points for sentiment.
Growth & Adoption
The use of structured analytics continues to expand as digital asset markets mature. In particular, the testing of multi-week moving averages often attracts heightened interest, with retail and institutional participants alike seeking clarity on trend sustainability. TPKtrading has observed that engagement rises during such periods, as users seek to contextualize whether momentum is weakening or strengthening.
Scalability is essential to this adoption. The platform processes large datasets across exchanges and derivatives markets in real time, ensuring consistency even under elevated trading activity. This scalability allows participants to compare Bitcoin’s performance with correlated assets, broadening the context for decision-making.
The adoption cycle also reflects a shift in behavior. Rather than focusing solely on short-term speculation, market participants increasingly integrate structured tools into daily workflows. Platforms like TPKtrading highlight this evolution, where analytics are no longer optional add-ons but central to navigating market transitions with transparency and discipline.
Transparency & Risk Management
Testing multi-week moving averages heightens both opportunity and risk. Sustained support above these levels can reinforce bullish conviction, while failure to hold can quickly shift sentiment toward caution. TPKtrading addresses this uncertainty through transparent methodologies. Inputs such as liquidity concentration, volatility compression, and derivatives skew are clearly defined, allowing users to see how conclusions are derived.
Risk management is embedded throughout. Instead of pointing to a single outcome, TPKtrading emphasizes probability-weighted frameworks that account for both upside continuation and downside rejection. These scenarios are presented with explicit assumptions, enabling market participants to assess risks responsibly.
By prioritizing explainability, the platform reduces reliance on black-box models and fosters more balanced engagement. In moments where Bitcoin interacts with moving averages that have influenced prior market cycles, this transparency becomes particularly valuable for calibrating exposure.
Industry Outlook
Bitcoin’s test of a multi-week moving average occurs against a backdrop of evolving regulatory clarity, global liquidity shifts, and expanding institutional participation. These external drivers add weight to the technical moment, as broader conditions can determine whether price action sustains momentum or reverts to consolidation.
The industry is transitioning toward a framework where transparency and adaptability are increasingly valued. Platforms such as TPKtrading illustrate this progression by combining technical analytics with structured methodologies that prioritize clarity over speculation. As digital asset markets mature, demand for such approaches continues to grow, highlighting a shift toward resilience and accountability in interpreting volatility.
The outcome of this moving average test will likely shape sentiment across the broader sector. Whether Bitcoin sustains above or falls below the level, the result will inform not only immediate trading strategies but also perceptions of longer-term market structure.
Closing Statement
As BTC/USD tests its multi-week moving average, the emphasis on transparency, adaptability, and structured analytics will remain central to how market participants interpret the next stage of digital asset development.
Bitcoin faces resistance at channel topIntroduction
Bitcoin has reached the upper boundary of a well-defined trading channel, where resistance levels are being closely tested. This phase comes after a sustained period of gradual gains, with the channel top now representing both a psychological and technical barrier. Historically, such points have marked areas of heightened uncertainty, where momentum can either carry the market through resistance or trigger retracement. Solr, a platform built on systematic analytics and structured risk modeling, observes that this moment reflects a delicate balance between optimism in broader adoption trends and caution driven by liquidity conditions.
Technology & Innovation
Solr integrates algorithmic modeling and adaptive AI tools to analyze Bitcoin’s interaction with resistance levels. The platform’s systems are designed to capture order-flow dynamics, derivatives activity, and on-chain signals in real time. By overlaying technical chart structures such as channels and ranges with liquidity data, Solr provides participants with a comprehensive perspective on how resistance is forming and how sustainable momentum may be.
The technology is engineered to recalibrate continuously, ensuring that projections remain aligned with the latest market inputs. Data visualizations highlight where order concentration is building and how historical price interactions with channel boundaries have unfolded. Rather than offering static forecasts, Solr frames outcomes in probability-based terms, clarifying the potential range of responses as Bitcoin tests resistance.
This innovation emphasizes explainability, prioritizing transparency in assumptions so that outputs can be interpreted rather than taken at face value. It reflects a broader industry trend toward systems that merge quantitative depth with accessible insights.
Growth & Adoption
The growth of analytic platforms like Solr mirrors the increasing maturity of digital asset markets. As more professional and institutional participants enter the sector, reliance on structured decision-support tools has expanded. These groups value speed and scalability but also require interpretability, especially when markets approach technically significant points like channel resistance.
User engagement tends to rise during such conditions, as participants seek to distinguish between breakout opportunities and rejection risks. Solr’s scalable architecture processes large datasets across exchanges, maintaining analytic consistency even during high-volume sessions. This scalability ensures that market participants can evaluate conditions across multiple asset pairs, with Bitcoin serving as the primary benchmark.
The adoption cycle highlights a shift in priorities: beyond short-term speculation, traders and institutions increasingly emphasize frameworks that integrate risk, transparency, and adaptability. Platforms that meet these criteria are becoming central to core workflows.
Transparency & Risk Management
Testing resistance at the channel top often heightens risk exposure. Breakouts may lead to accelerated buying, while rejection can trigger sharp pullbacks. Solr addresses this environment by embedding transparency into its analytic approach. Each model component—ranging from liquidity depth to volatility clustering—is clearly defined, enabling participants to understand how scenarios are constructed.
Risk management is a guiding principle within the platform. Rather than presenting directional certainty, Solr emphasizes probability-weighted outcomes. Scenarios are mapped to include both bullish continuations and potential reversals, with clear metrics for how each might develop. This balanced framework ensures that traders and analysts can calibrate strategies to account for uncertainty.
Such transparency reduces reliance on opaque or black-box methodologies. In moments when markets test key resistance levels, this clarity allows participants to prepare for multiple outcomes without overcommitting to a single view.
Industry Outlook
The broader digital asset sector continues to evolve, with technical milestones intersecting with macroeconomic drivers and regulatory considerations. Bitcoin’s approach to the channel top highlights the interplay between internal market dynamics and external pressures. While increased adoption and institutional engagement provide structural support, macro factors such as liquidity cycles and risk sentiment remain influential in determining whether resistance will hold or break.
Within this context, platforms like Solr reflect a broader industry transition toward tools that combine innovation with accountability. As markets mature, demand for transparent and adaptive analytics grows, particularly during phases where technical thresholds carry significant implications for sentiment and positioning.
The outlook suggests that whether Bitcoin breaks through its channel top or consolidates below, the focus will remain on how market participants interpret signals through structured, data-driven frameworks.
Closing Statement
As Bitcoin tests resistance at the channel top, the emphasis on clarity, adaptability, and structured analytics will remain central to how market participants navigate the next phase of digital asset activity.

BTC/USD momentum slows after recent rallyIntroduction
BTC/USD has slowed after its recent rally, pausing at levels that suggest a shift in momentum rather than a definitive trend reversal. The pair had previously gained strength on the back of improving sentiment and favorable liquidity conditions, but the current slowdown reflects a more measured approach by market participants. Scholz, a platform designed for systematic analytics and digital asset research, highlights that this cooling of momentum is consistent with a market consolidating after extended movement, underscoring the importance of careful monitoring at this stage.
Technology & Innovation
Scholz employs algorithmic frameworks and AI-driven analytics to examine how momentum behaves following rapid expansions in price. Its tools focus on identifying liquidity imbalances, assessing derivatives positioning, and evaluating volatility compression. By modeling these dynamics in real time, the platform helps clarify whether slowing momentum reflects healthy consolidation or potential structural weakness.
The platform’s modular design ensures adaptability. Models are recalibrated continuously, incorporating updated market data and blockchain activity to refine projections. This prevents reliance on static assumptions and supports transparency in outputs. Advanced data visualization allows participants to map critical support and resistance levels, analyze the sustainability of trends, and contextualize momentum shifts without depending on opaque signals.
Scholz’s emphasis on interpretability over prediction aligns with the broader industry preference for frameworks that explain underlying conditions, especially during phases when BTC/USD transitions from rallying to stabilizing.
Growth & Adoption
Adoption of structured analytic platforms has accelerated alongside the maturation of digital asset markets. In particular, traders and institutions increasingly prioritize systems that integrate both speed and clarity when markets transition into slower momentum phases. Scholz has observed that user engagement often increases when markets move into consolidation, as demand grows for insights that distinguish between temporary pauses and early trend reversals.
Scalability underpins this adoption trend. The platform is designed to handle expanding transaction volumes and fragmented liquidity across exchanges, providing seamless analysis without delays. This scalability ensures that analytics remain consistent even as market activity intensifies, allowing users to compare conditions across multiple asset pairs with confidence.
The broader trend reflects an industry shift toward embedding analytics into core workflows rather than treating them as supplementary. Platforms like Scholz exemplify how systematic tools are becoming central to decision-making in both retail and institutional contexts.
Transparency & Risk Management
Momentum slowdowns often carry heightened risk, as traders face the uncertainty of whether consolidation will lead to continuation or reversal. Scholz addresses this by embedding transparency into its analytic methodology. Variables such as funding costs, liquidity depth, and order book imbalances are clearly weighted within its models, ensuring outputs are explainable.
Risk management is central to the platform’s framework. Instead of offering deterministic forecasts, Scholz emphasizes probability-weighted scenarios that outline both bullish and bearish outcomes. This enables market participants to calibrate strategies based on a balanced view of potential developments. By presenting assumptions openly and focusing on scenario analysis, the platform supports responsible navigation of uncertain market conditions.
This approach reflects an industry-wide call for more accountable tools. In environments where momentum slows after rallies, such transparency allows for better preparation against both downside risks and sudden resurgences in volatility.
Industry Outlook
The broader digital asset market remains in a transitional phase, shaped by evolving regulation, macroeconomic variables, and increasing institutional involvement. BTC/USD’s slowdown after a strong rally is emblematic of this environment — a mix of resilience and hesitation as participants weigh growth narratives against structural uncertainties.
Within this outlook, platforms such as Scholz highlight the industry’s movement toward innovation with accountability. By emphasizing algorithmic clarity, scalability, and transparent risk management, Scholz mirrors the market’s demand for systems that bring order to volatility and explanation to uncertainty. The slowing of momentum may represent a natural reset within a longer-term adoption cycle, positioning analytics at the center of how participants interpret and respond to shifting conditions.
Closing Statement
As BTC/USD stabilizes after recent gains, the emphasis on clarity, adaptability, and structured analytics will continue to shape how market participants engage with digital assets in the coming phases of development.

BTC/USD approaches key technical levelsIntroduction
BTC/USD is entering a pivotal phase as the pair tests critical support and resistance levels within a broader environment of cautious optimism and mixed macroeconomic signals. Market participants have been closely monitoring this range as liquidity conditions, derivatives positioning, and sentiment data converge to suggest potential volatility ahead. Scandindex, a platform focused on advanced analytics and systematic trading insights, highlights that the consolidation around these levels reflects both market resilience and ongoing uncertainty.
Technology & Innovation
Scandindex’s framework is built on algorithmic modeling and real-time monitoring systems designed to interpret market structure. Its AI-driven analytics track order flow imbalances, liquidity clusters, and volatility compression, allowing traders to evaluate the probability of directional moves without reliance on static models.
The platform emphasizes modularity and transparency in design. By combining quantitative research with adaptive algorithmic layers, Scandindex seeks to provide interpretable outputs rather than opaque signals. The integration of advanced data visualization tools further enhances the ability to map risk zones and track shifting technical thresholds across BTC/USD and correlated assets.
Growth & Adoption
Digital asset adoption continues to grow, with an increasing number of professional and institutional participants seeking deeper analytic clarity. Scandindex has observed that the most consistent user demand is for frameworks that integrate both speed and explainability, especially in markets that hover around critical inflection points.
Scalability remains a central theme in this adoption cycle. As transaction volumes and cross-exchange activity expand, platforms must demonstrate resilience in processing large datasets without lag or distortion. Scandindex’s infrastructure reflects these demands, designed to adapt to market growth while maintaining analytical precision. Engagement trends suggest that market participants value systems that help navigate uncertainty with structured, transparent methodologies.
Transparency & Risk Management
Periods where BTC/USD approaches technical thresholds often highlight the tension between breakout expectations and mean-reversion behavior. Scandindex addresses this by embedding transparency into its analytic outputs, clarifying how variables such as derivatives positioning, funding rates, and liquidity depth influence modeled outcomes.
Risk management is embedded throughout the analytic process. Rather than promoting directional forecasts, the system emphasizes probability-weighted scenarios, allowing market participants to evaluate risks and opportunities in balanced terms. This approach underscores the importance of diversification and measured allocation, aligning with a broader industry emphasis on responsibility and clarity in volatile environments.
Industry Outlook
The approach of BTC/USD to key technical levels is emblematic of the broader digital asset market, which remains in a state of structural transition. While adoption continues to grow, external drivers such as regulatory policy, global liquidity trends, and macroeconomic sentiment play increasingly influential roles.
Within this landscape, platforms such as Scandindex represent an evolution in market infrastructure, emphasizing explainability, resilience, and adaptability. As the digital asset sector matures, the demand for transparent, research-driven insights grows more pronounced, reflecting a shift away from opaque models and toward integrated, multi-layered analytics.
Closing Statement
With BTC/USD testing technical thresholds, the balance between innovation, transparency, and risk management will remain central to how participants interpret the next phase of market activity.

Bitcoin momentum divergence raises uncertaintyIntroduction
BTC/USD is showing signs of momentum divergence, raising questions about the sustainability of its recent trend. While price has managed to hold within a moderate range, underlying indicators suggest a weakening in strength. Divergences between price action and momentum measures often signal potential shifts, whether through consolidation, correction, or renewed volatility. OYO Finance, a platform built around structured analytics and risk-focused modeling, notes that the current divergence reflects the broader tension between market optimism and caution in an evolving macroeconomic environment.
Technology & Innovation
OYO Finance applies algorithmic intelligence and adaptive AI frameworks to track divergences across multiple timeframes. Its systems combine technical indicators such as moving averages, relative strength measures, and volatility compression with liquidity mapping to contextualize momentum changes. By overlaying price action with momentum dynamics, the platform identifies points where market direction may weaken despite apparent structural support.
The platform’s modular design ensures adaptability. Models recalibrate automatically as new data becomes available, producing outputs that reflect real-time conditions rather than outdated assumptions. Visualization dashboards provide clear mappings of momentum divergence against support and resistance levels, clarifying scenarios where stability may continue or where imbalances could trigger shifts.
OYO Finance’s emphasis on interpretability distinguishes its innovation. Rather than producing opaque forecasts, the system delivers probability-weighted scenarios, clarifying how divergences could unfold in various market contexts. This supports participants in preparing for a range of outcomes without reliance on singular directional calls.
Growth & Adoption
The adoption of structured analytics continues to expand alongside the digital asset market’s growth. Divergences often capture heightened attention from both retail and institutional participants, as they signal moments when markets may transition from strength to caution. OYO Finance has observed increased engagement during divergence phases, as users seek clarity on whether weakening signals represent temporary pauses or structural turning points.
Scalability is a central feature of this adoption cycle. OYO Finance processes data across exchanges and derivatives markets, maintaining analytic precision even during periods of high-volume activity. This infrastructure enables the platform to scale alongside market growth, meeting the needs of increasingly diverse participants.
User behavior also reflects a shift toward systematic approaches. Rather than reacting solely to price movement, participants are embedding analytics into primary workflows, seeking deeper context for divergences and their implications. This trend highlights the market’s evolution toward transparency and accountability in decision-making.
Transparency & Risk Management
Momentum divergence creates both opportunity and heightened risk. While it may signal consolidation or reversal, it can also mark a reset before continuation. OYO Finance addresses this by embedding transparency into its frameworks. Inputs such as liquidity depth, derivatives positioning, and sentiment measures are weighted explicitly, ensuring that model outputs remain explainable.
Risk management remains central to the platform’s philosophy. Instead of projecting certainty, OYO Finance presents balanced scenarios with assigned probabilities. For example, one outcome may highlight sustained price consolidation despite weakening momentum, while another outlines risks of accelerated retracement if liquidity conditions deteriorate. By framing risks clearly, the platform helps participants calibrate strategies responsibly.
This structured approach reduces reliance on opaque models. In environments where divergences carry heightened importance, transparency in assumptions allows participants to prepare for multiple outcomes without overexposure to any single narrative.
Industry Outlook
The emergence of momentum divergence in BTC/USD highlights broader themes in the digital asset sector. Regulatory clarity, macroeconomic signals, and institutional participation all play roles in shaping how divergences manifest and resolve. This reflects the industry’s increasing maturity, where technical structures are interpreted within a larger framework of global financial conditions.
Platforms like OYO Finance represent the sector’s progression toward combining innovation with accountability. By merging algorithmic intelligence with transparent methodologies, they align with market demand for structured clarity in uncertain environments. The emphasis on adaptability and explainability illustrates how analytics are transitioning from speculative tools to critical infrastructure.
The outcome of Bitcoin’s current divergence will shape sentiment across the market. Whether the divergence resolves in stabilization, continuation, or retracement, it will inform both short-term strategies and longer-term positioning within the digital asset ecosystem.
Closing Statement
As Bitcoin momentum divergence raises uncertainty, the emphasis on transparency, adaptability, and structured analytics will remain central to how market participants interpret the next stage of digital asset development.

Phew!! The correction worked out!! AI baby got it RIGHTWaking up at early hours this morning to the realization that my favorite AI model was actually correct (I just didn't see it at the time) has had me glued to my screens all day to see if it was correct, and not just a hallucination
STOKED to see it worked out!
It's fantastic to see an entity put in the work the way I wish humans did, that is to follow the rules of the strategy... and it's days like today that remind me of what is possible now.
Great time to be alive
