Don’t Blink! BTC Signal Turns Bearish# BTC Quant Signals Stock 1M Prediction — 2025-09-28
CRYPTOCAP:BTC Quant Signals Kline Signal
📊 **CURRENT MARKET STATUS**
* Current Price: **$48.71**
* Data Quality: **Good**
* Timeframe: **1-Minute Bars (Scalping)**
---
🎯 **SCALPING PRICE PREDICTIONS**
* 30-Minute Target: **$48.32 (-0.81%)**
* 2-Hour Target: **$48.39 (-0.66%)**
* End-of-Day Target: **$48.49 (-0.45%)**
📌 Extended Outlook
* Final Target: **$48.39 (-0.66%)**
* Predicted Volatility: **21.8%**
* Expected Range: **$48.30 – $48.83**
---
📈 **SCALPING TREND ANALYSIS**
* Direction: **BEARISH**
* Confidence: **64%**
* Support: **$48.30**
* Resistance: **$48.83**
* Range Size: **1.1% of current price**
---
💰 **INTRADAY TRADE RECOMMENDATION**
* Direction: **SHORT**
* Entry Price: **$48.71**
* Target: **$48.45**
* Stop Loss: **$49.44**
* Confidence: **64%**
* Risk/Reward: **0.35 : 1**
* Session: **Intraday (1m bars)**
* Trend: **BEARISH**
#BTC #Crypto #Scalping #QuantSignals #TradingView
BTCUSD.P trade ideas

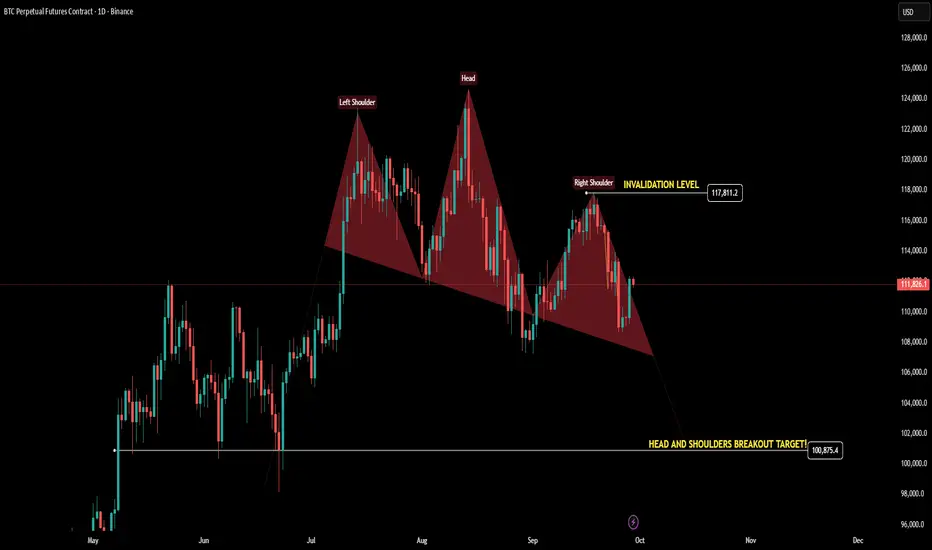
Bitcoin is forming a Head & Shoulders on the daily chart. Bitcoin is forming a Head & Shoulders on the daily chart. ⚠️
Invalidation: $117,811
Breakdown target: $100,875
If neckline breaks, expect more downside.
Stay cautious, Chill Fam!
BTCUSD-SELL strategy Monthly chart Reg. Channelit's manipulative investment, which means a turn around will be as swift as it's up-move we have been observing. For now, RSI shows negative divergence, and the reg.channel boundary is current $ 125 - 80 k. Lower down is $ 78 k support, and considering the overall view, the down side is possible based on over bought state, and also the likely turning of the indicators such as Fisher Form and MACD.
Streategy SELL @ $ 110-120 k and take profit near $ 75-80 k.

BTC/USD Analysis – Smart Money Clues for the Next Breakout Hello Traders, BTC analysis of the new day in week
🔎 BTC/USD 45m — Updated with SMC + FVG
1. Market Structure (SMC)
The previous downtrend created multiple BOS (Break of Structure) to the downside.
However, price failed to make new lows and instead formed a CHoCH (Change of Character) by holding above 110,800.
This indicates selling pressure is weakening → market is now in sideways accumulation.
2. Scenarios
Sideways Accumulation (most likely):
Price keeps ranging between 110,800 – 112,400 → Strategy: Buy demand, Sell supply.
Bullish Breakout:
A clean break above 112,800 with strong volume confirms a major CHoCH, shifting bias to bullish.
Target: 113,600 – 114,500.
Bearish Breakdown:
If 110,800 breaks down → bearish order flow resumes.
Target: 109,500 – 108,500.
👉 With SMC + FVG perspective, we have:
Supply Zone (Sell): 112,200 – 112,800.
Demand Zone (Buy): 110,800 – 111,200.
Current sideways range = a supply vs demand battle → wait for confirmation at zones.

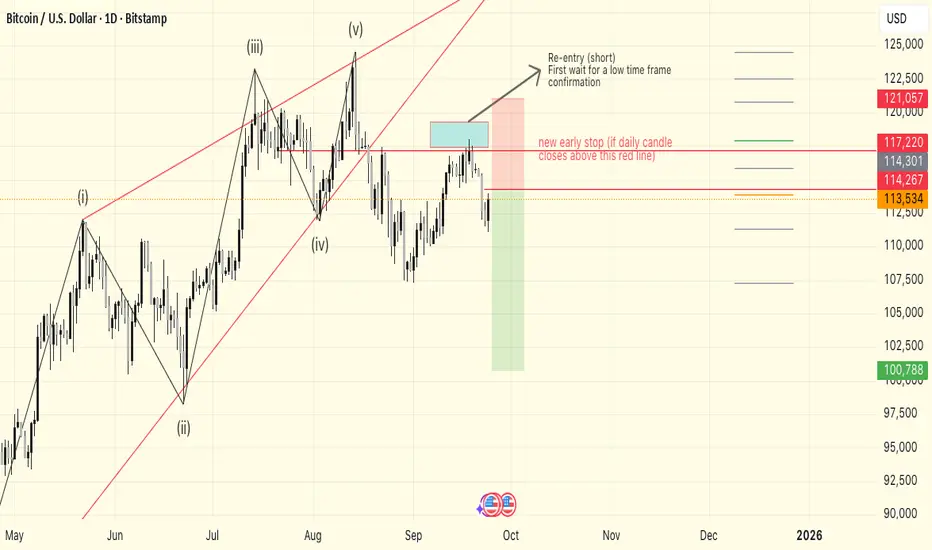
Triple confirmation with early stop for BTC (continuation)The re-entry price was reached, and an entry confirmation was created on a lower timeframe, which was a double top with a neckline at 114,400.
Right now, price is pulling back to retest that neckline, which will be our new entry price... but looking at the bigger picture, it doesn’t seem like a great idea to enter a Bitcoin short, since we have both bullish and bearish factors to consider:
Pros:
+Completed Elliott Wave count (5 waves + sub-waves finished)
+Strong weekly and daily divergences
+Daily double top (neckline at 112,000)
+Stops hunted at 118,000
+Possible bearish candle formation on the weekly timeframe (if this week closes below 113,500)
+BTC has gone over half a year without correcting more than 20%
Cons:
– Inverse H&S; projection still not reached (neckline at 109,300 projecting up to 144,000)
– Possible inverse H&S; forming, neckline at 117,220
– Fundamentals like pending alt-season and rate cuts this year pending.
– Overall bullish trend
In my opinion, the bearish case has more weight right now, but the probabilities are still not strong enough to risk too much capital on this trade, but the probabilities are more than 70%, so ill be in.
Prayer to God:
Teach me to feel that You are the power behind all wealth and the true value of all things. By finding You first, I will find everything else in You.
Bitcoin Trading Strategies AnalysisFrom a short-term perspective, the price of Bitcoin has entered a narrow range after falling below the key $110,000 mark, with bulls and bears engaged in a tug-of-war around the current price.
From a 4-hour perspective, the Bollinger Bands are trading in a narrow range, and the price has entered the upper edge of a triangle consolidation range, facing short-term resistance and the risk of a breakout or pullback.
From a market perspective, the Ministry of Finance is slowing its bond issuance pace, and a window for liquidity to return may emerge in mid-October. Historical data shows an 83% probability of an October increase, with an average return exceeding 20%.
Traditionally, we recommend focusing on range trading in the short term, adhering to the strategy of "shorting at highs first, buying at lows second."
For investors who currently hold positions or are unsure how to trade, please like my profile and visit my channel. I will provide exclusive trading services for members!

We love Red daysA tru investor/Day traders gets fu***ing excited when the markets are bleeding because they understand how to maneuver and capitalize on the fear of others… clean support sitting at 110,000 let’s see what shakes out🫣
But hey…. What do I know..

BTC USD PLAN
Bitcoin’s chart is one thing, but the bigger story is what’s driving the money behind it.
The Fed & Yields
The Federal Reserve is still the invisible hand. Every surprise in rates—whether a hotter inflation print or a sudden hint of deeper cuts—moves global risk appetite.
Lower real yields = cheaper capital = stronger bid for assets like BTC.
A hawkish turn does the opposite.
Institutional Flow
Big money isn’t just buying dips—it’s writing new rules.
Case in point: asset manager Strive is set to acquire about 5,800 BTC (≈ $675 million) through a corporate deal.
Moves like this tighten available supply and add a slow, steady demand base.
Bitcoin Technical View
This week’s candle is shaping up bearish, and Monday will tell us if today’s Sunday session finishes the job.
If the market doesn’t fill that daily gap, we’ll be watching Monday’s open closely.
Right now the daily range runs from 113,999 down to 108,644.
If the dollar pushes into higher liquidity zones, Bitcoin could feel the pressure and drift lower.
The plan is simple: wait for a clear shift on the smaller time frames before making any move and calculate risk from there.
Patience matters more than bravado—let the market come to you.
For now, the setup still looks constructive, but it only pays to act when the levels confirm.
Trade small, stay calm, and protect your capital first.

BITCOIN BITCOIN BITCOINNew set up for the next week , the trend is obvious and we are following it to some new balance levels.

bitcoin one more push up on the tableBitcoin- looks like we might have another long entry on the table, which I will take . On the other hand, I will hold my shorts until we reach bear market lows or I'm stopped out. I will take a long position as a hedge to my short, just in case it wants to try and go for new highs. Entry 107247 as soon as we take the lows and try and get back above that level, otherwise we just crash and never get back above the level- which I prefer

btcusdThis is my own analysis of BTC. The method of analyzing the wave is a large wave, three ABC >>> and I enter into it sub-waves that are synchronized with the wave length.

BTCUSD shorts under 112 033 targeting 107 286 BTC has repeatedly failed to create higher highs therefore I looking for shorts as it represents a continuation

BTCUSD: Will Go Up! Long!
My dear friends,
Today we will analyse BTCUSD together☺️
The recent price action suggests a shift in mid-term momentum. A break above the current local range around 109,419.48 will confirm the new direction upwards with the target being the next key level of 109,618.62 and a reconvened placement of a stop-loss beyond the range.
❤️Sending you lots of Love and Hugs❤️

BTCUSD D1 Elliott Wave AnalysisIts a simple and clear Elliott Wave Setup in BTCUSD D1 Chart. Follow the below sequence to understand.
1. We see a rising Wedge which was broken to the downside.
2. This can be labelled as 'impulse wave 1' (white count).
3. Price after break the wedge and making wave 1, retraced to 61.8 fib (wave 2 white count). This is a classic wave 2 retracement zone.
4. We are possibly now in wave 3 (white count) which ideally extends to 161.8 fib extension.
5. Therefore the target for wave 3 is around 92,000.
Additional note: We see a pattern of FVGs which are similar in size. Twice above, these FVGs were mitigated. Now we have the 3rd similar FVG around the wave 3 target area at 92,000. Therefore, if we go there, and wave 3 completes, expect a bounce due to FVG to create a corrective wave 4.
Tell me what do you think about this idea. Feedback will be appreciated.

BTC SWING SELL IDEA 🟥 BTCUSD – SELL (SWING SETUP)
🚦 Bias: BEARISH (Short)
🎯 Entry Zone: 109,200 – 109,600 (Current Price ~109,400)
🛑 Stop Loss Options:
• Conservative (tighter risk): 116,465
• Original swing stop: 124,619
🏁 Take Profits:
• TP1: 108,000
• TP2: 101,500 – 100,800
• TP3: 94,000 – 93,200
• TP4: 85,500 – 84,700
• TP5: 75,250 (Final Target)
📊 Setup Notes:
Two stop options depending on your risk appetite.
Larger RR if using the wide swing stop, but the tighter stop offers reduced downside exposure.
Structure remains bearish as long as price stays under 113.5k – 115k zone.

BTCUSD | Wedge Pattern | 1D🔺 Price Structure: Rising wedge formation unfolding in Elliott Wave count.
🔄 Current Phase: Wave (iv) correction → retesting wedge support.
📍 Demand Zone: $100K – $104K (blue box) = key accumulation area.
📈 Bullish Outlook: Holding support = launchpad for wave (v) rally.
🎯 Target Zone: $140K – $160K (potential ATH breakout).
⚠️ Invalidation: Breakdown below wedge base = structure compromised.
🧠 Mindset: Patience. Precision. Profit.

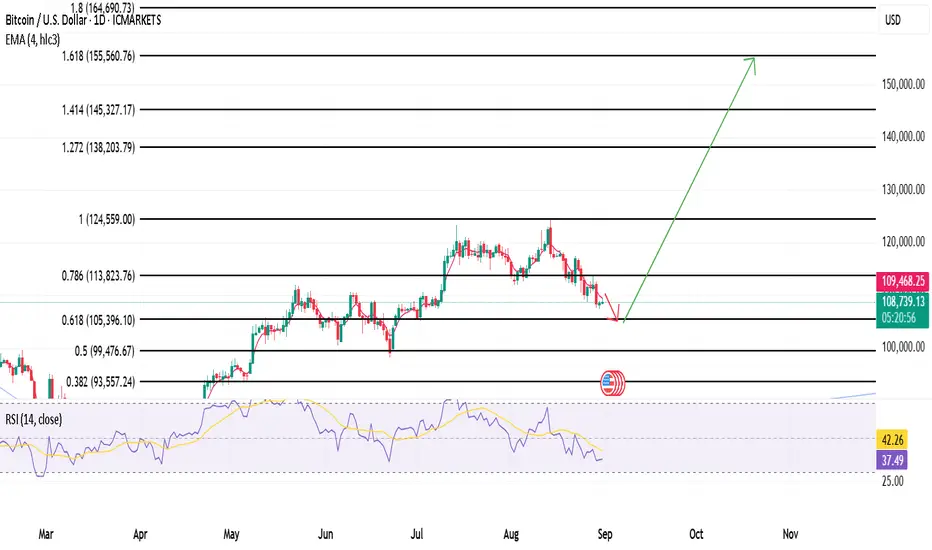
BTC correction is over in area 105k - Target 155kIn my view current BTC correction will find supoprt at 0.618 Fibonacci Level, around 105k area, where bullish trend will resume to complete the bullish cycle startede in 2020 after covid crash.
My final target is around 155k but I see a correlation between BTC and SPX cycle so assuming that my final target for SPX is around 7440 area and considering that usually BTC anticipates SPX inversions I'll close long position when SPX will be in 7300 area.
After bullish cycle completion I see a long term bear cycle starting for SPX and BTC in 2026.
BTCUSD 9/28/2025DOWN GOES FRAZIER!!!! Remember, Price is targeting Lows.... Let's see what Price does....
_SnipeGoat_
_TheeCandleReadingGURU_
#PriceAction #MarketStructure #TechnicalAnalysis #Bearish #Bullish #Bitcoin #Crypto #BTCUSD #Forex #NakedChartReader #ZEROindicators #PreciseLevels #ProperTiming #PerfectDirection #ScalpingTrader #IntradayTrader #DayTrader #SwingTrader #PositionalTrader #HighLevelTrader #MambaMentality #GodMode #UltraInstinct #TheeBibleStrategy

BTCBitcoin is continuing its bearish structure, suggesting further downside pressure in the current wave development. The market remains weak, and unless strong reversal signals appear, the decline could extend toward lower support zones. Traders should maintain a cautious bearish bias and wait for confirmation before entering short positions.

BTC Market Analysis and Trading StrategyBTC dipped to an intraday low of 108,627 before recovering and then rebounding. It then rose to a high of around 110,250 before falling back under pressure, maintaining an overall volatile pattern.
Ethereum performed even more strongly, finding support at the intraday low of 3,874 before continuing its upward trend, reaching a high of 4,066.
From a four-hour chart, the current market exhibits typical characteristics of a weak rebound, with continued weak momentum and overall pressure still constrained by the middle band of the descending channel.
Despite some signs of stabilization, insufficient buying power has prevented the price from effectively breaking through the key resistance area. Technically, the current downward trend remains intact, and the bearish trend remains intact.
Trading Strategy: Maintain a focus on rebounding to higher levels, focusing on whether the price shows signs of pressure at the upper band of the channel.
For investors who currently have positions or are unsure how to trade, please like my profile and visit my channel. I will provide exclusive trading services for members.

Bitcoin Chart Fibonacci Analysis 092725Trading Idea
1) Find a FIBO slingshot
2) Check FIBO 61.80% level
3) Entry Point > 108,850/61.80%
Chart time frame:B
A) 15 min(1W-3M)
B) 1 hr(3M-6M)
C) 4 hr(6M-1year)
D) 1 day(1-3years)
Stock progress:C
A) Keep rising over 61.80% resistance
B) 61.80% resistance
C) 61.80% support
D) Hit the bottom
E) Hit the top
Stocks rise as they rise from support and fall from resistance. Our goal is to find a low support point and enter. It can be referred to as buying at the pullback point. The pullback point can be found with a Fibonacci extension of 61.80%. This is a step to find an entry-level position. 1) Find a triangle (Fibonacci Speed Fan Line) that connects the high (resistance) and low (support) points of the stock in progress, where it is continuously expressed as a Slingshot, 2) and create a Fibonacci extension level for the first rising wave from the start point of the slingshot pattern.
When the current price goes over the 61.80% level, that can be a good entry point, especially if the SMA 100 and 200 curves are gathered together at 61.80%, it is a very good entry point.
As a great help, TradingView provides these Fibonacci speed fan lines and extension levels with ease. So if you use the Fibonacci fan line, the extension level, and the SMA 100/200 curve well, you can find an entry point for the stock market. At least you have to enter at this low point to avoid trading failure, and if you are skilled at entering this low point, with the fibonacci6180 technique, your reading skill of to chart will be greatly improved.
If you want to do day trading, please set the time frame to 5 minutes or 15 minutes, and you will see many of the low points of rising stocks.
If you prefer long-term range trading, you can set the time frame to 1 hr or 1 day

UNWINDING WEAKNESS.📉 #Bitcoin 4H Technical Outlook
BTC is consolidating near $109K after a sharp drop, with major support resting around $98K–$100K.
• 🔴 Key resistance: $118K → $124K
• 🟢 Key support: $98K → $100K
• ⚠️ Bias remains bearish below $112K. A breakout from this tight range will define the next major move.
👉 Watch $109K for a decisive break. Below = bearish continuation. Above $118K = bulls regaining control.
#menlikelucid.

BITCOIN?????????????????????????SO this is how i think i like to see how do you think or what do you think about my analyse so please leave a comment
NOW here is the thing in btc.d we are doing a head and shoulderpattern
that there is a good chance that it will go down if btc.d brake the support
and go down the chance of btc to go down is even more AND in usdt.d we
broke our resistance and we are going up we already did 1 leg in usdt.d we
wait for a pullback or a good candle that brake the previous high and if we
do that btc WILL go down so chek the btc.d and usdt.d
