Why Most Traders Lose and How to Flip the Script
It’s no secret: most retail traders lose money.
Not because the markets are “rigged,” but because trading is a game of probabilities, discipline, and psychology.
Let’s break down why losses happen, the psychology behind them, and how to build a better plan to stay in the game long-term.
1. Why Most Traders Lose
There are a handful of mistakes that account for the majority of blown accounts:
🔸 Overleveraging – Using too much size turns small moves against you into catastrophic losses.
🔸 Lack of risk management – Without stop-losses, max drawdown rules, or position sizing, one bad trade can erase weeks of gains.
🔸 Chasing trades – Entering late after a big move due to FOMO, only to sell at the bottom.
🔸 No system – Random entries and exits with no strategy mean your results are left entirely to chance.
🔸 Emotional trading – Anger, revenge trades, and greed lead to impulsive decisions that sabotage even good setups.
Most traders know these mistakes on paper, but knowledge alone doesn’t prevent them. The real enemy is psychology.
2. The Psychology Behind Losing
When most people think about why traders lose, they picture bad entries or poor technical skills. But the truth is, the biggest battles aren’t fought on the charts—they’re fought in the mind. Understanding the psychology behind losing is critical, because it explains why traders keep repeating the same mistakes even when they “know better.”
Loss Aversion
Psychologists have proven that humans feel the pain of losing about twice as strongly as the pleasure of winning. In trading, this shows up in two destructive ways: holding onto losing positions far longer than we should, and selling winning positions far too early. A trader might watch a loss grow from -5% to -20% because closing the trade would mean admitting they were wrong. On the flip side, the moment a trade turns green, they take profit too quickly, just to escape the fear of it slipping back to red. Over time, this creates an inverted risk/reward profile—small wins and big losses—the exact opposite of what successful trading requires.
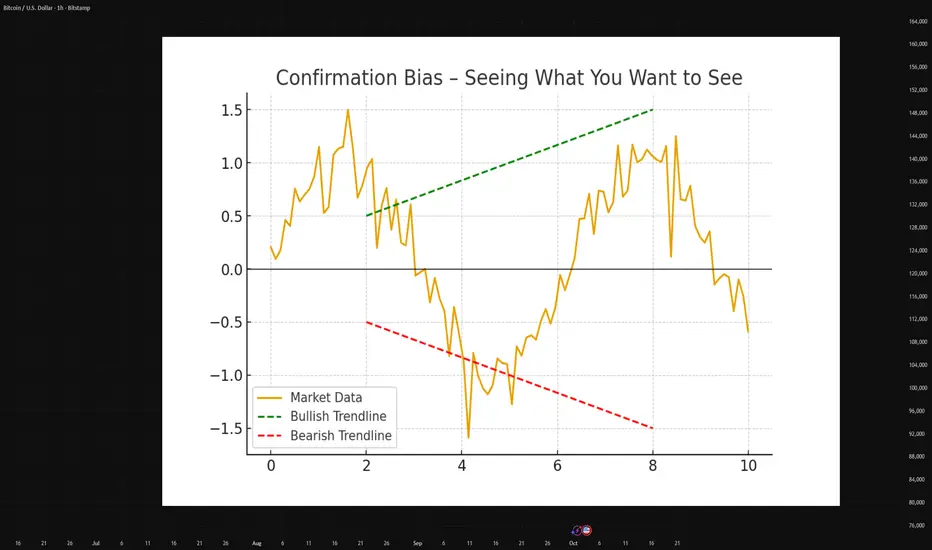
Confirmation Bias
Once a trader enters a position, the human brain naturally looks for reasons to justify it. They’ll scroll through charts, social media, or news feeds, paying attention only to the information that supports their trade, while ignoring anything that contradicts it. This tunnel vision can be deadly, because markets don’t care about opinions—they reward objectivity. A good trader must learn to question their own bias constantly, asking not “why am I right?” but “what would prove me wrong?”
Ego and Revenge Trading
Every trader knows the sting of a losing trade. But what comes next separates amateurs from professionals. The inexperienced trader often lets ego take over. Instead of stepping back, they try to immediately “win back” what was lost, usually by doubling their position size, rushing into another setup, or abandoning their strategy entirely. This revenge trading spiral often leads to much larger losses. The market punishes desperation, and it rewards patience. The ability to walk away after a loss and reset emotionally is one of the hardest but most valuable skills to develop.
The Illusion of Control
Many traders believe that the more time they spend staring at charts or the more trades they take, the better their results will be. This illusion of control often leads to overtrading, which drains both capital and emotional energy. In reality, trading is about probabilities, not control. No amount of screen time can eliminate uncertainty. The edge lies in preparation, discipline, and executing a plan—not in micromanaging every tick of price action. Paradoxically, the less you feel the need to control the market, the more control you gain over your own decisions.
3. How to Prevent Frequent Losses
The good news: most of these pitfalls can be managed with structure and discipline.
✔️ Risk Per Trade – Never risk more than 1–2% of your total capital on a single position.
✔️ Predefine Rules – Before you click buy/sell, know your entry, stop, and target.
✔️ Accept Losses – Treat them as the “cost of doing business.” Even pros lose 40–50% of trades.
✔️ Quality > Quantity – Fewer, higher-probability trades often outperform constant scalping or chasing.
✔️ Journal Every Trade – Write down why you entered, why you exited, and what you felt. This exposes patterns in your behavior.
4. Building a Better Plan
Trading without a plan is gambling. Building a system gives you consistency.
Define Your Edge: What makes your trade valid? Is it a technical setup, a market structure, or a specific confluence of signals?
Backtest Your Strategy: Test your rules on historical data before risking real money.
Stick to Probabilities: No setup wins 100%. Focus on consistency over a large sample size.
Emotional Control Routine: Walk away after a big loss, set daily limits, and never trade tired or stressed.
Takeaway
Most traders lose not because they’re “bad” but because they don’t treat trading like a business.
By mastering psychology, defining risk, and following a plan, you stop thinking in terms of single trades → and start thinking in terms of long-term probabilities.
Trading isn’t about being right every time.
It’s about surviving long enough for your edge to play out.
BTCUSD.P trade ideas
Bitcoin Targets $133,000 as Bulls Defend Channel SupportBitcoin has maintained bullish structure by repeatedly defending channel support, with price now testing midline resistance. A reclaim of $123,360 could unlock the path to $133,000 and new all-time highs.
Bitcoin’s price action continues to respect its structured trading channel, where multiple retests of support have consistently attracted buying pressure. This bullish defense has kept the macro trend intact while setting the stage for a test of higher resistance. With the midline region now being challenged, the next decisive move will determine whether Bitcoin can push toward uncharted territory.
Key Technical Points:
- Channel support has held across multiple retests, confirming bullish structure.
- Price is testing midline resistance of the channel.
- A reclaim of $123,360 could lead to a rally into $133,000, marking a new all-time high.
Bitcoin’s trading channel has become a defining feature of recent price action. Each retest of the lower boundary has produced bullish reactions, demonstrating that long-term holders and fresh buyers continue to defend the structure. This recurring pattern has created confidence in the sustainability of the bullish trend.
At present, Bitcoin is challenging midline resistance, a key area where momentum is often tested. A successful reclaim would provide validation that buyers are in control, opening the probability of price expansion toward the next major level. That level sits at $123,360, and reclaiming it would act as the springboard for a measured rally toward $133,000.
Breaking $133,000 would mark a new all-time high for Bitcoin, further solidifying the channel as a bullish continuation pattern rather than a temporary trading range. Volume inflows will remain critical, as any hesitation near the midline could result in another correction back to support.
Despite these near-term challenges, Bitcoin’s market structure remains intact. Consecutive higher lows have been maintained, confirming the persistence of the bullish trend. As long as channel support continues to hold, the risk of significant downside remains limited.
What to Expect in the Coming Price Action:
Bitcoin’s outlook remains bullish while the channel holds. If midline resistance and $123,360 are reclaimed, the probability of a rally into $133,000 and new all-time highs becomes highly favorable. Consolidation within the channel, however, may persist before the breakout attempt gains traction.
BTC eyes on 119k then 117.9k: Retrace targets worth watchingBTC eyes on 119k then 117.9k: Retrace targets to watch.
This is a follow up to my big picture idea below.
Retrace underway from our Genesis fib at 125.5k
Fib of the retrace points to 119k best guess target.

BTC analysis.Give me some energy !!!The price surged, breaking the triangle after 6 months, and now it can be said that Bitcoin will soon reach $150,000.
PREVIOUS ANALYSIS

BITCOIN (BTCUSD): Important Breakout
Bitcoin broke and closed above a major resistance cluster
based on a previous ATH.
A confirmed break of structure indicates a highly probably bullish continuation.
The next resistance is 128000.
It might be the next goal for the buyers.
❤️Please, support my work with like, thank you!❤️
I am part of Trade Nation's Influencer program and receive a monthly fee for using their TradingView charts in my analysis.

BTC/USD – Flag Formation Near Trendline Support Breakout SeemsBitcoin is respecting its bullish market structure, continuing to form higher highs and higher lows. After the impulsive rally toward 125,600, price has entered a short consolidation phase and is currently testing a rising trendline acting as dynamic support.
This structure resembles a bullish flag / ascending triangle, suggesting that buyers may soon regain control if price holds above the trendline.
🔹 Market Outlook
• Structure: Bullish continuation
• Pattern: Bullish flag / triangle formation
• Bias: Buy on confirmation above resistance or from trendline support
💎 Trade Plan
Option 1 – Immediate Buy (Aggressive)
🟢 Buy Now: 122,900 – 123,000
🎯 Target 1: 123,800
🎯 Target 2: 125,500 (resistance high)
🛑 Stop-Loss: below 122,400
Option 2 – Pending Buy (Conservative)
🟢 Buy Stop: 123,600 (breakout above flag)
🎯 Target 1: 124,600
🎯 Target 2: 125,500 – 126,000
🛑 Stop-Loss: below 122,800
⚠️ Alternative Scenario
If the trendline breaks and price closes below 122,400, expect a short-term shift toward 121,800–121,200, where fresh demand could appear for the next leg higher.
📈 Summary
• Trendline support still intact ✅
• Bullish flag structure forming ✅
• Confirmation needed above 123,600 for momentum continuation 🚀
• Maintain bullish bias while price holds above 122,400

BTC's situation+next targets and expected movementsBitcoin, as you can see, is within a descending wedge. If it breaks down, the price could drop below $100k, but we should wait for the breakout confirmation.

Bitcoin Hodlers are happy campers - BUT🕷️ 🌕 🦇 In Switzerland it’s now 11:50 PM 🕷️ 🌕 🦇
I’m tired from a long day in the markets, but I feel I have to get this one out because it’s important for many of you holding Bitcoin.
In my last post, I said we’d run upward to reach the Hagopian Line, and here we are, even higher.
We’ve just tagged the U-MLH for the third time.
There’s an old pattern from the futures markets that farmers once noticed. It’s called the “Three Drives” pattern.
The old farmers knew that when this pattern appeared, it was time to hedge their crops, or add to their hedge.
When I was a student at MarketGeometry, Tim Morge explained this pattern, and ever since it’s served me well as a signal for a trend reversal.
I don’t know exactly how this will help each of you, but I’m sure it’s worth a heads-up. Whether you decide to hedge, close your positions, or just HODL until the sun burns out, it’s something to keep in mind.
Meanwhile, the Harvest Moon is shining into my office tonight, twinkling with a strange grin... 🌕
Time for me to rest.
Good night, everyone.
🌾 🌾 🌾 🌾 🌾 🌾 🌾

Bitcoin - It is either $50.000 or $1.000.000!🪅Bitcoin ( CRYPTO:BTCUSD ) remains undecided:
🔎Analysis summary:
For the past couple of months, Bitcoin has been consolidating. With the two recent all time highs, we could see a similar pattern to what we saw back in 2021, followed by a bear market. But so far, Bitcoin remains bullish with the underlying trend continuation.
📝Levels to watch:
$1.000.000, $50.000
SwingTraderPhil
SwingTrading.Simplified. | Investing.Simplified. | #LONGTERMVISION


BITCOIN Are we going to see 'UPTOBER' this time??Bitcoin (BTCUSD) has historically seen incredible rallies during the month of October and even more so those Octobers of the last years of Bull Cycles, like the one we are at now. Those rally phases have been very accurately called 'Uptober' rallies.
More specifically, the last three such Octobers (2021, 2017 and 2013) have been massively bullish, all starting after September corrections (Channel Down patterns). In 2013, October reached the 2.382 Fibonacci extension from September's correction, in 2017 and 2021 it reached the 1.786 Fibonacci ext.
As a result, if 'Uptober' is repeated again, this historic price actions gives us an optimistic Target at $132k (Fib 2.382) and a less optimistic one at $125.5k (Fib 1.786).
Do you think we will get such Uptober one more time? Feel free to let us know in the comments section below!
-------------------------------------------------------------------------------
** Please LIKE 👍, FOLLOW ✅, SHARE 🙌 and COMMENT ✍ if you enjoy this idea! Also share your ideas and charts in the comments section below! This is best way to keep it relevant, support us, keep the content here free and allow the idea to reach as many people as possible. **
-------------------------------------------------------------------------------
💸💸💸💸💸💸
👇 👇 👇 👇 👇 👇

The Surprise of 2025: Silver Beats Bitcoin and GoldEveryone talks about Bitcoin as the next refuge, but in 2025 the biggest surprise is silver.
Here’s how they stack up year-to-date in USD:
🥈 Silver: +62%
🟡 Gold: +46%
🟠 Bitcoin: +30%
That’s right — the “underdog” metal is outperforming both the “digital gold” and the classic safe haven.
In an environment of exploding debt, inflation pressure, and fiscal excess, physical assets are reminding the market why they’re still relevant. Bitcoin hasn’t replaced gold — it’s joined it. And silver? It’s quietly stealing the spotlight.
So why choose only one, when owning all three can make your portfolio stronger?


Bitcoin - The path remains clearly bullish!💰Bitcoin ( CRYPTO:BTCUSD ) remains bullish either way:
🔎Analysis summary:
For the past 1.000 days, Bitcoin has simply been heading higher. Considering that the previous bullruns lasted about 800 days, Bitcoin is ready for a correction. But market structure tells us, that Bitcoin remains bullish, even if we see a short term correction in the near future.
📝Levels to watch:
$50.000, $1.000.000
SwingTraderPhil
SwingTrading.Simplified. | Investing.Simplified. | #LONGTERMVISION

BITCOIN (BTC/USD) TECHNICAL ANALYSIS — BEARISH RETEST SETUPPair: Bitcoin (BTC/USD)
Timeframe: 30-Minute
Current Price: 121,200
Trend: Uptrend inside ascending channel, currently showing bearish correction
📊 Chart Analysis
Rising Channel (Pink Zone):
BTC has been trading inside an ascending channel since early October.
The recent movement shows a rejection at the upper boundary, followed by a pullback to the lower boundary of the channel.
Support Level (Blue Zone):
Identified between 126,200 – 127,400, previously acted as resistance, now turned potential support.
Price might retest this zone before confirming the next move.
Bearish Setup:
The projection suggests that price may retest the support, then reverse downwards toward the target zone near 119,800 – 119,700.
Entry Point:
126,238 – 126,254, ideal zone to enter a short position after a pullback.
Stop Loss:
127,435 – 127,446, above the resistance and previous highs — protecting against false breakouts.
Target Point:
119,812 – 119,795, lower channel boundary and next support area.
📈 Expected Price Movement
Current retracement may continue slightly upward to retest the blue resistance zone.
If price fails to break 127,400, a strong bearish rejection is expected.
Target zone sits around 119,800, completing a channel cycle.
✅ Summary
Parameter Level (USD) Notes
Entry 126,238 Short entry near resistance
Stop Loss 127,435 Above resistance
Target 119,812 Next support zone
Bias Bearish Sell on retest
RR Ratio ~3:1 Good short setup

BTC/USD: Structure Shift Confirmed - Bearish CHoCH Break"The previous analysis highlighted the Minor and Major CHoCH levels as key lines in the sand for the recent uptrend. The market has now decisively broken BELOW both levels.
This action confirms a Bearish Change of Character in the market structure (on the chart), signaling a failure of the current bullish order flow.
1. Minor CHoCH Break: Confirmed the initial weakness and short-term pullback.
2. Major CHoCH Break: Confirms the structural shift, indicating that the corrective move is likely to be deeper than a simple consolidation.
We should now anticipate a shift in price action: making Lower Highs and Lower Lows. The previous support levels may now act as resistance. Looking for the next key demand zones for a potential bounce, but the immediate bias is now BEARISH."

Bitcoin to 7 trillion within the week? There is a pee pee poo poo pattern forming on the third Heidenberg-Pinkman wave.
This combined with Fibbonacci Davinci Liberacci and Donatello Leonardo continuations suggest a new all time high of 500 quadrillion veitnamise dong.
There is also a visible pattern of head and shoulders, but not the traditional one. In this vastly more complex version the chart will take shape into a bottle of dandruff preventing shampoo hence the name head and shoulders
Levels to watch:
-Negative 17 Fafillion
-40
-Infinity plus one

BTC 1W — S/R playbook: tops, bottoms, and the 119k decision lev.BTC 1W — Structural S/R map: 119k is the line in the sand
Thesis
Price is pressing the top of a rising structure on the 1W chart. My S/R map marks 119,000 as the key support. A weekly close below 119k flips the structure from trend-continuation to corrective risk.
Key zones (1W)
Resistance: 150–160k area (rising wedge/diagonal supply)
Active support: 119k (cluster of weekly closes + diagonal base)
If 119k fails (weekly close): 105–100k (prior weekly consolidation) → 92–96k (lower diagonal/box top)
Plan
Bullish bias while weekly candles hold above 119k. Pullbacks into 119–124k = find reaction and reclaim.
Risk flips on a weekly close below 119k. Expect momentum sellers and a slide toward 105–100k.
Invalidation for shorts: reclaim of the broken level on a weekly close (classic “lost → reclaimed” trap).
Invalidation for longs: weekly close below 119k (structure break).
Why these levels
Levels are derived from 1W swing clusters and clean close-based S/R. Diagonals only frame context; decisions are made at horizontal S/R. I trade weekly; no lower-TF noise.

BTC Daily IndicatorsDaily indicators seem to be working well for shitcoin right now while it's in a sideways channel.
I still think cryptos are a giant scam, but so are the stock market and commodities, lol.
Something to watch out for. BTW, I think ETH has more profit potential, but BTC indicators make more sense. I might use BTC as an indicator and trade ETH, lol.

Long with minimal SL Market is bullish a higher time frame, and here, a structure is broken to the upside after stop hunt which mitigate the precedented order block.

SELL BTCUSDGetting ready to SELL BTCUSD next week, SELL Entry will be determine once market confirms, riding it back down to 71,000, 58,000, or 40,000 as Profit Targets, Stop Loss will be determine once market confirms!
If anyone likes long mumbo jumbo garbage analysis, than this is NOT for you.
Also, if you are afraid of risk, failure, and want only a 100% sure thing, than
run as fast as you can from the market, because the market is NOT a sure thing,
so it is definitely NOT for you.
WARNING: This is just opinions of the market and its only for journaling purpose. This information and any publication here are NOT meant to be, and do NOT constitute, financial, investment, trading, or other types of advice or recommendations. Trading any market instrument is a RISKY business, so do your own due diligence, and trade at your own risk. You can loose all of your money and much more.
