BTCUSD Respecting Trendline – Eyes on Resistance ZoneBitcoin is maintaining its bullish structure, respecting the ascending trendline on the daily chart. Price recently reacted from the support zone and is now consolidating near 116,000. As long as the trendline holds, a potential move toward the resistance area around 122,000 – 124,000 remains in play.
Key points:
Trendline support acting as a guide for higher lows
Current consolidation above 112,000 demand zone
Resistance area: 122,000 – 124,000
Break above resistance could open room for further continuation
This analysis is for educational purposes only, not financial advice
BTCUSD.P trade ideas

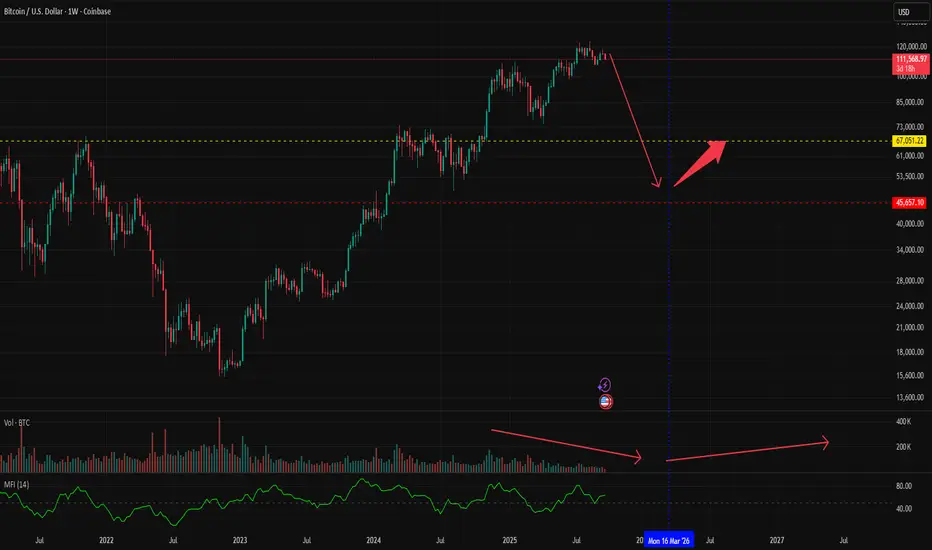
Predicting Bitcoin's DirectionI was completely wrong in my last analysis, foolishly predicting a sharp decline.
Now, as Bitcoin climbs back to its highs, I'm noticing a decrease in trading volume. Specifically, as the price nears its peak, the volume continues to drop, and there's a surge in volume on red candles.
Based on this, I'm anticipating a bearish market until next March.
During the last round of interest rate cuts (2018-2020), Bitcoin began its rebound right after the rate cuts ended. I believe we'll likely see a similar pattern this time around.
BTCUSD H4 | Bearish drop offBitcoin (BTC/USD) has rejected off the sell entry at 113,380.39, which is a pullback resistance and could potentially drop from this level to the downside.
Stop loss is at 115,645.29, which is a pullback resistance.
Take profit is at 109,425.81, which acts as a pullback support that aligns with the 78.6% Fibonacci retracement.
High Risk Investment Warning
Trading Forex/CFDs on margin carries a high level of risk and may not be suitable for all investors. Leverage can work against you.
Stratos Markets Limited (tradu.com ):
CFDs are complex instruments and come with a high risk of losing money rapidly due to leverage. 65% of retail investor accounts lose money when trading CFDs with this provider. You should consider whether you understand how CFDs work and whether you can afford to take the high risk of losing your money.
Stratos Europe Ltd (tradu.com ):
CFDs are complex instruments and come with a high risk of losing money rapidly due to leverage. 66% of retail investor accounts lose money when trading CFDs with this provider. You should consider whether you understand how CFDs work and whether you can afford to take the high risk of losing your money.
Stratos Global LLC (tradu.com ):
Losses can exceed deposits.
Please be advised that the information presented on TradingView is provided to Tradu (‘Company’, ‘we’) by a third-party provider (‘TFA Global Pte Ltd’). Please be reminded that you are solely responsible for the trading decisions on your account. There is a very high degree of risk involved in trading. Any information and/or content is intended entirely for research, educational and informational purposes only and does not constitute investment or consultation advice or investment strategy. The information is not tailored to the investment needs of any specific person and therefore does not involve a consideration of any of the investment objectives, financial situation or needs of any viewer that may receive it. Kindly also note that past performance is not a reliable indicator of future results. Actual results may differ materially from those anticipated in forward-looking or past performance statements. We assume no liability as to the accuracy or completeness of any of the information and/or content provided herein and the Company cannot be held responsible for any omission, mistake nor for any loss or damage including without limitation to any loss of profit which may arise from reliance on any information supplied by TFA Global Pte Ltd.
The speaker(s) is neither an employee, agent nor representative of Tradu and is therefore acting independently. The opinions given are their own, constitute general market commentary, and do not constitute the opinion or advice of Tradu or any form of personal or investment advice. Tradu neither endorses nor guarantees offerings of third-party speakers, nor is Tradu responsible for the content, veracity or opinions of third-party speakers, presenters or participants.

Big buyers are accumulatingPrices are falling while the MACD is rising and the RSI is rising, with very high volume. This indicates that large buyers are accumulating goods.

BTCUSD Bearish Swing Toward 111,000? (Read Caption)Bitcoin has shown weakness on the 4 Hour chart after failing to hold recent highs and slipping below key moving averages. The price action suggests bearish pressure could extend further if momentum continues, offering a potential short swing trade opportunity.
Key Levels:
Sell Entry Point: 112,700
Take Profit: 111,000
Stop Loss: 113,700
Reasoning:
BTCUSD is facing resistance near 113,700, where sellers have stepped in multiple times. A short entry at 112,700 positions the trade in line with the current downward bias. The stop loss is placed above resistance to limit risk, while the take profit at 111,000 targets the next major support zone, creating a favorable risk to reward setup.
Disclaimer:
This analysis is for educational purposes only and not financial advice. Cryptocurrency markets are highly volatile always use proper risk management and trade according to your own plan.

BTCUSD – H1 OutlookPrice recently gave a BOS to the upside, shifting short-term order flow bullish. However, after BOS, price is retracing back into the demand zone (112,100 – 111,600) which is now the key decision point.
🔹 Bullish Scenario (Long Bias)
If the demand zone holds and confirms with bullish price action, we can expect continuation upward with liquidity targets sitting above 115,200. This would validate the BOS as a true shift in structure with demand acting as support.

Bitcoin Top DilemmaHistorical Context:
Previously, my prediction for bitcoin bottom based on the MACRO indicator played out as expected here:
The MACRO indicator has been back tested and has consistently predicted S&B bottoms and it's rallies as you can see here:
In simple terms, when MACRO indicator flashes bull signal (Vertical Blue line), it has historically created the bull markets.
Signals:
Vertical - Blue lines: S&P/MACRO indicator bottom
Vertical - Red dotted lines: 80 weeks after halving
Vertical - Green dotted lines: 40 weeks after halving
Dilemma:
In no point in bitcoin's history, the MACRO indicator has flashed a bull signal (Vertical Blue line) at the end of a bitcoin halving cycle.
The question then is - will you rely on the MACRO indicator or the bitcoin halving cycle? To make it even simpler, would you trust the assets like bitcoin correlate to liquidity (MACRO indicator) or the time (4 year halving)?
If we believe in the 4 year Bitcoin's halving cycle, we should expect this cycle's end by Nov 3, 2025 (Vertical - Red dotted line) or sooner.
If we believe in the 4 year Bitcoin's halving cycle, but now lean towards the MACRO indicator (i.e., liquidity), we will have to say the most hated verse 'This time is different'.
If we don't believe in the 4 year Bitcoin's halving cycle (i.e., time), and say the 4 year bitcoin cycle has been nothing but a coincidence to the MACRO indicator (i.e., liquidity) all along, we trust liquidity over halving cycles.
Time will tell, but I lean towards the liquidity (i., MACRO indicator) even though it feels like bitcoin is almost about to top this cycle.
Which one do you lean on?

The FUTUREThe Future of Bitcoin According to the Advance EduReader™
Ladies and gentlemen, brace yourselves: the sacred charts have once again spoken through my proprietary algorithm, the Advance EduReader™ — a machine so perfect it makes Nostradamus look like a confused intern at Goldman Sachs.
According to my model (a carefully calibrated blend of Fibonacci spirals, lunar cycles, liquidity traps, and three espressos at 3 a.m.), Bitcoin is about to enter what I call the “Quantum Parabolic Phase.” That’s the technical term for “number go up in ways your Excel sheet can’t handle.”
Forget about simple support and resistance lines. My algorithm reads the hidden vibrations between candlesticks, the emotional leverage of market makers, and even the frequency of memes on X/Twitter. Last week, it predicted the exact moment a whale sneezed in Singapore, and sure enough, the BTC chart hiccupped by 0.37%. Precision unmatched.
Now, for the big reveal: by the time the average retail investor finally googles “what is halving?”, Bitcoin will have already breached levels that make traditional valuation models irrelevant. Think metaphysical resistance zones rather than technical ones. My EduReader doesn’t just predict the market — it feels it.
In short, the future of Bitcoin is inevitable: volatility will look like stability, dips will look like generational buying opportunities, and every pundit on CNBC will claim they “always knew.” Meanwhile, my Advance EduReader™ will be three steps ahead, sipping cocktails on the blockchain while the rest are still stuck drawing triangles on TradingView.
So mark my words: when the candles align with Jupiter, and the RSI whispers “oversold” in tongues, that’s when you’ll remember this prophecy.
MY ALGORITHM
i.ibb.co

A clear sell Signal #Bitcoin Our system provided a gain a fantastic opportunity to make Major #profits.
Follow along to get the next new signal.
It still in a downward trend.

Don’t Underestimate Dogecoin!Dogecoin is one of my favorite setups. I’m loving this market cycle — it looks exactly like Bitcoin before 2017 happened. I believe it’s setting up for a huge parabolic run that could make people very rich. I’m extremely excited about this setup.
As always, stay profitable.
— Dalin Anderson

With support at 110,000-111,000, we remain bullishAnother successful long entry 🚀! As we have repeatedly stated before, as long as BTC does not break below the 110000–111000 support range 🛡️, we will still maintain a bullish outlook 🐂
Buy @111000 - 111500
TP 113000 - 113500 -114000
Accurate signals are updated every day 📈 If you encounter any problems during trading, these signals can serve as your reliable guide 🧭 Feel free to refer to them! I sincerely hope they'll be of great help to you 🌟 👇

Which Way Bitcoin?Given the price action off the standing all-time high, there are three basic paths to take from here:
The most bullish suggests the primary 4th wave is in place and we have started the final leg higher to finish the cycle with a primary 5th to new all-time highs.
The most bearish, not labeled, is that the cycle top is already in place at the standing all-time high.
The last, but not least, likely path is for one more leg down to finish off wave (c) of 4 before heading higher to fresh all-time highs.

Not-so-strong supportToday, the price reached the support level we identified yesterday, which we expected it to test. It turned out to be a weak support, and as long as the price cannot consolidate above the 114,000 zone, we should continue looking for short positions. ✅

The Bear Market Isn't Coming? Old BTC Playbook is a TrapFor years, traders have relied on Bitcoin's predictable cycles. We look for the same clues, the same topping signals, and the same patterns. But what if the market has evolved? What if the playbook we've all been studying is now a trap?
This analysis dives deep into key indicators across all three major bull runs, comparing the RSI, MACD, Volume, and especially the Bollinger Band Width Percentile (BBWP). The data suggests that while some classic bearish signals are flashing, the market's underlying structure is telling a very different, and potentially much more bullish, story.
A Tale of Two Cycles: The Historical Baseline
To understand where we are, we must first look back.
The First Bull Run (2015-2017): This cycle was defined by raw, explosive power. The weekly RSI crossed above 80 a staggering four times. However, the end was confusing. We had bearish RSI divergences fighting against bullish MACD. The primary exit signals were a massive spike in selling volume and a BBWP reading that finally hit 94%, signaling trend exhaustion. It was effective, but messy.
The Second Bull Run (2018-2021): This cycle top was much clearer and became the "classic" model for many traders. The RSI crossed 80 only twice, and the end was signaled by a textbook combination of:
Classic bearish divergences on the RSI and MACD.
Obvious selling pressure at the top.
Crucially, the BBWP spectrum crossed 90% three separate times, screaming trend exhaustion before the final downturn.
The Current Cycle: A New Breed of Bull 📈
Now, let's analyze our current cycle, which began in November 2022. On the surface, some things look familiar, but the engine of this trend is behaving in a completely unprecedented way.
The Familiar Signs (The Bear Case):
Yes, we can see a classic bearish divergence forming on both the RSI and MACD. Furthermore, the recent buying volume, while still okay, is showing signs of weakness compared to the explosive start of the rally. This is what is causing many analysts to call for a cycle top, just like before.
The Unprecedented Anomalies (The Bull Case):
This is where it gets interesting and why the old playbook may fail.
No BBWP Exhaustion: Unlike the (2015-2017) (2018-2021) bull runs, the BBWP spectrum has not crossed 90% a single time during this entire uptrend. The volatility has never reached the levels of euphoria and exhaustion that marked previous tops. The trend, while strong, has not shown signs of being "finished."
The Contraction Anomaly: This is the most compelling signal on the chart. Historically, a major BBWP contraction (the indicator squeezing down) signals that energy is building for a massive expansion in price. This event has almost always marked the beginning of a new bull phase or the start of a major move up. Yet, here we are at the supposed end of the cycle, and the BBWP is contracting again. This has never happened at a cycle peak before. This odd behavior suggests that instead of winding down, the market could be coiling up for another powerful move, Also the number of contractions in this cycle is much higher than the pervious cycles which explains the elliot waves unexpected targets
Elliott Wave Strength: While I have not drawn the Elliott Wave count here because every trader's interpretation can be subjective, my personal count indicates that the current wave structure is targeting prices significantly higher than the current all-time high.
Summary and Final Thoughts
To summarize, while we have some classic, textbook bearish signals that would have marked the top in (2018-2021), we also have powerful, unprecedented evidence suggesting this cycle is different.
The lack of a BBWP exhaustion signal (>90%) is a major deviation from the last 2 cycle top.
The current BBWP contraction at a "cycle end" is a massive anomaly. This is typically a pre-trend signal, not an end-of-trend signal, and could be hinting at a major breakout ahead.
This is not a guarantee of a continued bull run, but rather a data-driven observation that the market is showing a structure we haven't seen before. Relying solely on the old playbook could be a mistake. The market is evolving, and our analysis must evolve with it.
I have marked every anomaly and pattern on the chart, You can zoom in and analyze for yourself
I'm open to all discussions and opinions in the comments
Trade safe and keep an open mind.

BTCUSD Q4 2025 to Q1 2026 DIP has begun!I see strong confirmations to back up a massive dip to 95 - 80k. Currently price is only pulling back to retest that bearish continuation pattern and head and shoulders.
I will send updates on LTFs on this trade idea as price continues to move to the downside.


BITCOIN Can this pattern hold one last time?Bitcoin (BTCUSD) is holding (so far) its 1W MA20 (red trend-line) as mentioned on our previous analysis, which is critical for the continuation of the bullish trend.
Today however, we bring you a pattern that may have gone unnoticed and as long as it holds, the market should be expecting a new High.
That is the transition of a former Resistance level (formed from a previous High) that turns into Support (new Low), which generates a rally that so far has measured a minimum +45.73% (from the High).
However every such Low was priced at or very close to the 1W MA50 (blue trend-line). This time the 1W MA50 is at 100k and a way for this pattern to be fulfilled, BTC should at least trade sideways until it comes close to the 1W MA50.
In any case, as long as the Support level holds, a +45.73% rise, would take us to $157000.
Do you think we have chances for that? Feel free to let us know in the comments section below!
-------------------------------------------------------------------------------
** Please LIKE 👍, FOLLOW ✅, SHARE 🙌 and COMMENT ✍ if you enjoy this idea! Also share your ideas and charts in the comments section below! This is best way to keep it relevant, support us, keep the content here free and allow the idea to reach as many people as possible. **
-------------------------------------------------------------------------------
💸💸💸💸💸💸
👇 👇 👇 👇 👇 👇

BTC parabolic step patternChances of a top is very low here
these step patterns p accurate
gas it
hard

BTCUSD: hold a bullish viewThe current price is around 112700, up 0.17% from the previous trading day. It has fluctuated within the 111000 - 113300 range in the past 24 hours, showing a narrow - range consolidation trend. However, it has not yet broken below the 111000 support level, so we still hold a bullish view. That said, the market is currently in a phase of game between "institutional accumulation and short - term caution"—do not blindly chase the upside.
Buy 112000 - 112500
TP 113000 - 113500 -114000
Daily-updated accurate signals are at your disposal. If you run into any problems while trading, these signals serve as a reliable reference—don’t hesitate to use them! I truly hope they bring you significant assistance

BITCOIN Bullish Breakout! Buy!
Hello,Traders!
BTCUSD reclaims key horizontal level after liquidity sweep, signaling strength. Breakout confirms bullish intent with Smart Money driving price toward 114,341 target to fill imbalance overhead. Time Frame 3H.
Buy!
Comment and subscribe to help us grow!
Check out other forecasts below too!
Disclosure: I am part of Trade Nation's Influencer program and receive a monthly fee for using their TradingView charts in my analysis.

$BTC beautiful range to play i will looking for short!lower time frame rejection call lead us for more downside ! keep eye on it..

Shocking bloodbath! Bitcoin plummeted 3% in a single dayBitcoin plummeted 3% in a single day, breaking through $112,000, and Ethereum fell below $4,100! Market panic erupted. Is the bull market still here?
Just now, the crypto market was suddenly hit by a massive sell-off!
According to HTX real-time market data, Bitcoin plummeted rapidly, not only breaking through the $114,000 support level but also rapidly falling below the $112,000 mark, with its 24-hour decline widening to 3%!
At the same time, Ethereum was also affected, briefly falling below $4,100, plummeting below the psychologically sensitive level!
Even the recently strong SOL collapsed, breaking through the $230 support level, sending all cryptocurrencies into a tailspin!
This sharp drop is not just a technical correction; there are also undercurrents in the market news.
Some analysts point out that this may be related to the sudden shift in Federal Reserve interest rate expectations, profit-taking by large institutions, and weak liquidity in the early Asian trading session.
There are also unconfirmed rumors that a whale has been making continuous large on-chain transfers, triggering a market-following panic sell-off.
The bullish defenses are currently facing a severe test. If Bitcoin fails to quickly reclaim $115,000, its medium-term structure may turn bearish.
Ethereum must closely monitor whether it holds above $4,000. If it falls below, market sentiment could deteriorate further!
But crises also present opportunities! Historical data shows that sharp declines often present opportunities for institutional investors to buy at a low price, and sudden pullbacks are not uncommon during bull markets.
The most important thing now is to remain calm and closely monitor whether BTC and ETH can generate rebound signals at key levels. Should you buy the dip? Be sure to set stop-loss orders and control your positions!

Trading balanceTrading balance The price of the asset has rebounded from the balance zone. With the prospect of growth into the resistance zone.
