check the trend Given the price behavior within the current support area, it is expected that the upward trend will continue. Otherwise, a continuation of the downtrend is possible until the next support levels.
BTCUSD.P trade ideas

Bitcoin just hit its golden ratio, SHORTS incoming.Bitcoin just hit the golden ratio at a critical zone. It's had two chances to go higher and have been heavily rejected. The market is also forming a head and shoulders pattern.
I think institutions are going to try and hide their positions by accumulating shorts overtime at this level, leveling out the volume to hide any indication of a drop. This will be a large-short opportunity at these prices for Bitcoin.
Good luck everyone. Trade responsibly.

BRIEFING Week #38 : Waiting for Something to Happen !Here's your weekly update ! Brought to you each weekend with years of track-record history..
Don't forget to hit the like/follow button if you feel like this post deserves it ;)
That's the best way to support me and help pushing this content to other users.
Kindly,
Phil

BTCUSD: Will Go Up! Long!
My dear friends,
Today we will analyse BTCUSD together☺️
The in-trend continuation seems likely as the current long-term trend appears to be strong, and price is holding above a key level of 115,614.83 So a bullish continuation seems plausible, targeting the next high. We should enter on confirmation, and place a stop-loss beyond the recent swing level.
❤️Sending you lots of Love and Hugs❤️

Bitcoin short recovery 4hr OB strong rejection After Strong Bull Reen Bitcon Reached 4hr OB , facing Strong Regution 4 hrs Blocke liquidity accumulated enough to hunt Buyer.

BTCUSD - Weekly OutlookPair: BTCUSD
Bias: Bullish
HTF Overview (4H):
Bullish structure remains intact. Dropping to lower scales to anticipate continuation within the broader trend.
MTF (2H/1H/30M):
Structure is mapped and refined. A CHoCH has printed from a deep anchor zone. Now waiting for the sell-side liquidity (SSL) sweep 🧹 before dropping to lower confirmations.
LTF (30M/5M):
Once mitigation from the higher zone is complete, we’ll wait for a breach of the LH. Once applied, we’ll attend the bullish leg.
Targets:
• TP1: 5M highs
• TP2: 30M highs (depending on market delivery)
Mindset Note:
Crypto loves liquidity sweeps — let BTC clear the SSL and confirm with structure before committing to the long side.

What If We Buy From Here???🚀 BTC/USD — Buy Opportunity
🔑 Support holding strong
🟢 Bullish reversal signs
📊 RSI recovering from lows
📈 Trend still intact
Plan:
Buy near support
SL just below
TP1 = local resistance
TP2 = higher swing level
👉 Clean setup, momentum favors upside.

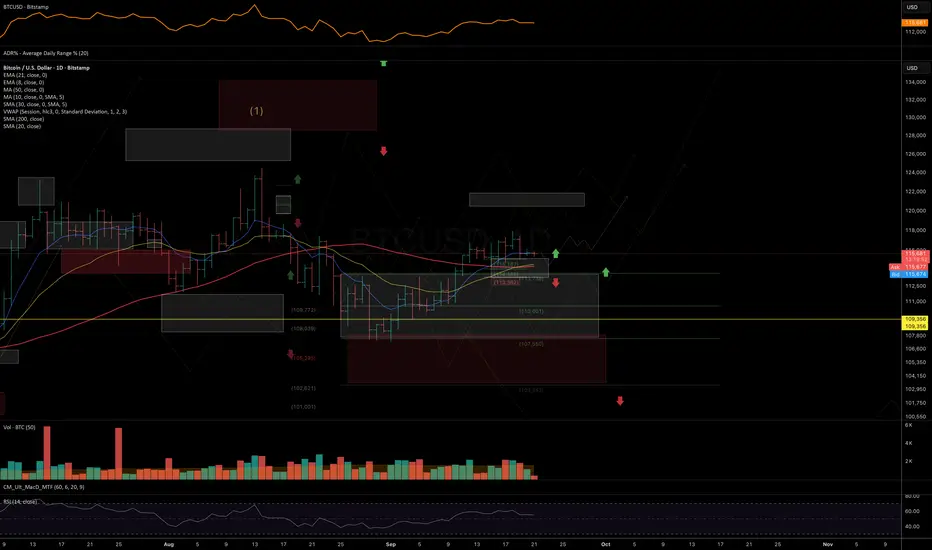
ANFIBO | BTCUSD [update]Hello guys! It's me, Anfibo.
Here is my New Updated Strategy of BITSTAMP:BTCUSD
I agree with the view that BITSTAMP:BTCUSD is currently in a compression phase. The market seems to be waiting for a catalyst (potentially economic data or macro news) to break out of this consolidation zone.
>>> Key observations:
Trading volume has shown signs of decline over the past few sessions, reflecting investor sentiment of waiting on the sidelines rather than taking strong action.
Funding rates and overall market sentiment remain positive but not overly euphoric, which is a healthy signal supporting the case for a sustainable upward move.
On the Daily timeframe, the primary trend remains bullish, and the current sideways movement appears to be a technical correction within the broader uptrend.
>>> Strategic approach for today:
> For short-term traders: consider accumulating small positions around the support levels of 115,200 – 114,400, with stop-loss orders set below 114,000 to manage downside risk.
> For medium-term investors: it is more prudent to wait for a confirmed breakout above the 117,000 – 118,000 resistance zone before scaling into larger positions, targeting the 120,000 – 123,000 levels.
Have a beautiful weekend! :)

BTCUSD - Long 137,000BTC is expected to hit the levels of 137,000.
The Crypto is expected to fall to the levels of 97000 or even to the levels of 90500 before moving to higher levels of 137k.

Price correction to 103,000Right now, they are manipulating the market a lot, since it became clear that Trump is the winner of the election, they started manipulating the market in both gold and Bitcoin.
The ceiling of 123,200 should not be hit. Before that, the price should have been 108,000.
Now we have a correction, at least until 103,000 is not hit, the previous ceiling will not be hit.

Bitcoin (BTC/USD) — 4H Outlook: Expanding Ascending Triangle +
** Bitcoin (BTC/USD) — 4H Outlook: Expanding Ascending Triangle + RSI/MACD Convergence **
Overview
Bitcoin is consolidating between $114K and $117K while testing the upper edge of an **expanding ascending triangle**. Price is hovering under the linear regression chop zone (~$116K), which is capping short-term upside momentum. Momentum oscillators are leaning bearish, but structure shows potential for a breakout if resistance is cleared.
What it does
This analysis combines **pattern recognition (triangles & regression zones)** with **RSI, MACD, and OBV momentum signals** to frame the near-term outlook. By highlighting support/resistance pivots and probability-weighted scenarios, traders can position for either consolidation, pullback, or breakout.
Key Levels
• Support: $113.5K–$114K / $111.5K–$112K
• Resistance: $116K / $117.5K–$118K
• Breakout Trigger: Daily close above $117.5K with volume → target $119K–$120K
Forecast (2–3 Days)
• 🔼 40%: Breakout above $117.5K toward $119K–$120K
• 🔁 35%: Sideways consolidation between $113.5K–$116K
• 🔽 25%: Pullback toward $111.5K if RSI/MACD weakness persists
Strategy Notes
• Swing traders: Wait for reclaim of $117.5K for bullish continuation.
• Breakout traders: Enter above $117.5K → target $120K+.
• Bulls: Defend $113.5K support; losing this zone risks flush lower.
📌 Chart shows BTC testing regression resistance with **expanding triangle structure**. Indicators lean slightly bearish but breakout potential remains if $117.5K is reclaimed.
---

BTC TO HIT $124,000The Prime minister of crypto republic is on a pull bac that may probably trigger a bullish run to the next equal high or another ATH
Bitcoins will reward holders before the end of the year

BTC/USD – Struggling Below SMA200⚪ Neutral, bias bearish under $115.8k
Bitcoin trades at $115,726, capped by SMA200 ($115,781). Resistance: $115,885, support: $115,407. RSI sits at 50, mid-level, showing indecision. Bulls need to reclaim $115.8k for upside; rejection risks another dip.
📖 Keywords: #BTCUSD #Bitcoin #CryptoTrading #KeyResistance

Bitcoin –> Inverse Head & ShouldersHello guys!
On the 4H chart, Bitcoin completed an inverse Head & Shoulders.
The measured target of the pattern lies near $118K, aligning with a strong resistance zone.
This level should be watched closely, as it may act as a potential reversal area.
If price rejects around $118K, we could see a pullback towards $115K – $114K.
A confirmed breakout above $118K with volume would invalidate the reversal scenario and open the way for higher levels.
Key zones:
🎯 Target / Resistance: $117.5K – $118K
Possible Reversal Zone: $118K
📉 Support: $115K – $114K
Disclaimer: As part of ThinkMarkets’ Influencer Program, I am sponsored to share and publish their charts in my analysis.

BTCUSDBTCUSD needs some correction for the next few days before any upside.
Disclosure: We are part of Trade Nation's Influencer program and receive a monthly fee for using their TradingView charts in our analysis.

BTC/USD Holds Support, Looks for Rally to 117,964BTC/USD is holding above a support zone after recent BOS (Break of Structure) and accumulation in the blue area. If the price maintains this support, a move toward 117,964 is expected. If support fails, a deeper pullback could follow.
This analysis is for educational purposes only and does not constitute financial advice.

BITCOIN GOLDEN ZONE RESISTANCE FOR NEXT LEG DOWNThis is continuation and update on my previous analysis on Bitcoin. As noted earlier Bitcoin found support on the weekly 21 EMA and has retrace to the golden fib zone. The overhead resistance on the weekly chart is still intact with the double tops shooting stars. The daily chart is presenting itself as the lower high at the golden fib zone. Indicators are also pointing to the lower side as there is no strength on RSI and MACD. From these signals I still expect BTC to sell off to the bearish targets with the initial target at $105,724. There is also the likelihood that price consolidates at this zone for a moment before the pullback.
The trade idea and plan will be invalidated if we get a candle open and close on the daily chart above the golden zone of about $118k.
Thanks for listening and reading my publications and please share your thought in the comments sections if you see otherwise or support the trade idea. Let beat the market together. Cheers!!!

Bitcoin OutlookWeekend trade after the FOMC has been a ghost town—low volume and choppy, un-tradable price action.
The dollar has been pinned inside a narrow hourly fractal range: high 116.211 / low 115.132.
I’ve been waiting for a sharp dollar pullback with a news driver, but the broader macro picture keeps price in oversold territory. Timing the next big move is anyone’s guess.
For now:
Higher-timeframe bias: still unpredictable.
Intraday (high-frequency) moves: perfectly tradable.
Crypto: don’t expect a clean breakout this weekend.
On the weekly map, there’s a bullish imbalance that still needs to be tapped.
Expect any breakout to have a dose of manipulation—trade carefully.

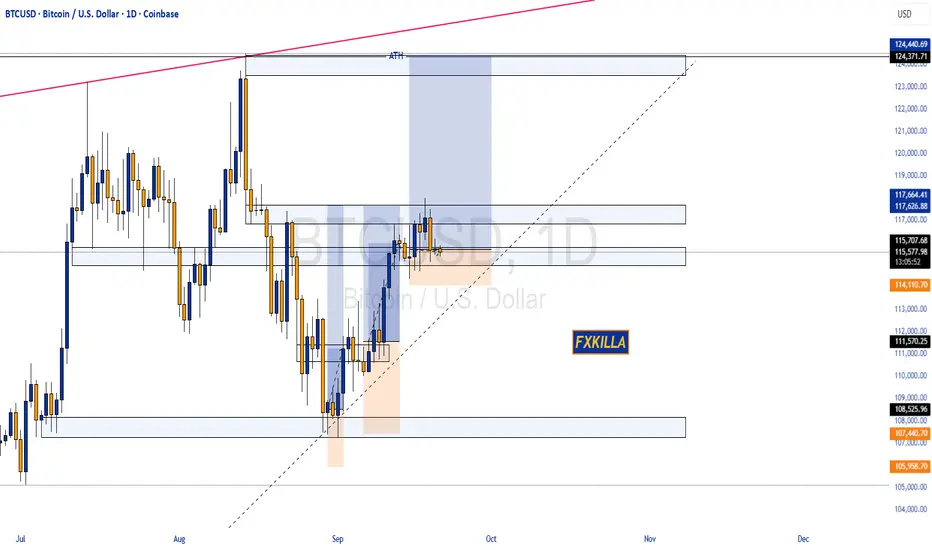
BITCON HIGH PROBABILITY SETUP SOON!!!🚨 BTCUSD HIGH PROBABILITY BUY SETUP 🚨
* Here We Can See Clearly The Next Potential Move For BTC Coming Hours/Days.
* Keep Your Eyes Close On Your Trading Positions.
* Happy PIP Hunting Traders.
FXKILLA.
Crypto Market Weekly Review: Trend Structures and Key ExpectatioOverall trends continue to develop within the macro structures outlined in previous weekly reviews. Some assets (BNB, SOL, HYPE) are already in new uptrends, while others are only starting to form the first impulsive moves within broader bullish structures.
In the coming days, I expect local downside pressure to complete the ongoing September corrections, followed by a continuation of the uptrend toward target resistance zones. Another wave of Autumn consolidation is likely to follow afterward.
From a macro perspective, as long as prices hold above their key support zones, I continue to view the September lows as important macro higher-lows. Below these levels, most coins (possibly with the exception of ETH) are unlikely to fall and should instead continue forming higher lows ahead of a more sustainable rally into Q4.
⸻
BINANCE:BNBUSDT
Chart:
Support: 1000–930
Resistance: 1135–1150
⸻
BINANCE:BTCUSDT
Chart:
Support: 115–113.3K
Resistance: 120–122K
⸻
BINANCE:XRPUSDT
Chart:
Support: 2.97–2.91 / 2.85
Resistance: 3.30–3.40
⸻
BINANCE:ETHUSDT
Chart:
Support: 3380
Resistance: 5060–5235
⸻
BINANCE:SOLUSDT
Chart:
Support: 230–223
Resistance: 285–310
⸻
$HYPEHUSDT
Chart:
Support: 52.5–51
Resistance: 67–73
Feel free to comment which coins and assets you’re most interested in, and I’ll prepare a separate review on them.
Thank you for your attention, and wishing you a successful week ahead!
BTC OUTLOOK 21-09-25In a grand scheme of things, I still see BTC will sweep the OB in 116818 zones before dumping lower to take lower liquidity
Trade smart, Trade safe guys

BITCOIN Update: Stay Alert (4H)This analysis is an update of the analysis you see in the "Related publications" section
Read the analysis carefully
Given the loss of the trendline, Bitcoin stalling, and decreasing momentum, the previous Bitcoin analysis needed to be updated.
If Bitcoin fails to make a valid breakout above the yellow line at $116,520 and does not sustain above it, a bearish scenario will emerge, and the price will drop significantly
A bullish outlook toward the supply zone shown on the chart above is only valid if Bitcoin executes a confirmed breakout above $116,520.
So stay alert and follow the chart closely.
For risk management, please don't forget stop loss and capital management
Comment if you have any questions
Thank You

BTCUSD: Long Trade with Entry/SL/TP
BTCUSD
- Classic bullish formation
- Our team expects growth
SUGGESTED TRADE:
Swing Trade
Buy BTCUSD
Entry Level - 11515
Sl - 11471
Tp - 11610
Our Risk - 1%
Start protection of your profits from lower levels
Disclosure: I am part of Trade Nation's Influencer program and receive a monthly fee for using their TradingView charts in my analysis.
❤️ Please, support our work with like & comment! ❤️
