BTCUSD Short Scalp 15MThis is for BTCUSD because the trend is bearish, there is FVG that not mitigated yet. We wait the price tap the FVG then entry
BTCUSD.P trade ideas

BTC retrace down to 105 and 100kBTC retraces down to 105 and 100k
still inside bullish channel
momentum still bullish
possible hit 118k again pr higher before spike down

Financial Market CoverageUnderstanding the Backbone of Modern Finance
Introduction
Financial markets are the lifeblood of the global economy. They provide the infrastructure for the allocation of capital, risk management, and wealth creation. However, the true power of financial markets lies not just in their existence, but in how they are observed, analyzed, and reported. This is where financial market coverage comes in—an essential mechanism that informs investors, regulators, policymakers, and the public about the constantly evolving financial ecosystem.
Financial market coverage is more than reporting stock prices or bond yields. It encompasses the analysis of macroeconomic trends, corporate performance, policy changes, market sentiment, and geopolitical events. Effective coverage ensures transparency, fosters confidence, and enables participants to make informed decisions. In this discussion, we will explore the scope, methods, challenges, and future of financial market coverage.
The Scope of Financial Market Coverage
Financial market coverage extends across multiple segments, each with its unique nuances and stakeholders. Key areas include:
1. Equity Markets
Equity markets, or stock markets, are arguably the most visible segment. Coverage here involves:
Stock Price Movements: Tracking real-time prices, indices, and market trends.
Company Analysis: Evaluating earnings, management strategies, mergers, acquisitions, and other corporate actions.
Sectoral Analysis: Comparing performance across sectors such as technology, healthcare, or energy.
Market Sentiment: Understanding investor psychology through trading volume, options activity, and news flow.
2. Fixed Income and Bond Markets
Bond markets are critical for funding governments and corporations. Coverage involves:
Yield Movements: Monitoring interest rate trends, yield curves, and bond spreads.
Credit Analysis: Assessing corporate and sovereign creditworthiness.
Policy Implications: Evaluating central bank actions and their effects on debt markets.
3. Derivatives and Commodities
Derivatives such as futures and options provide hedging and speculative opportunities. Coverage includes:
Price Volatility: Tracking commodity prices (oil, gold, agricultural products) and derivative contracts.
Market Structure: Observing open interest, options chains, and leverage trends.
Risk Indicators: Monitoring implied volatility indices like VIX.
4. Foreign Exchange and Currency Markets
The forex market is the largest and most liquid. Coverage includes:
Currency Pairs: Tracking movements in major and emerging market currencies.
Global Trade Impacts: Understanding how exchange rate fluctuations affect trade and investment.
Central Bank Interventions: Monitoring interest rate decisions and monetary policy adjustments.
5. Alternative Investments
Alternative assets such as private equity, hedge funds, and cryptocurrencies are increasingly covered due to their growing influence. Coverage examines:
Market Trends: Adoption rates, liquidity, and performance metrics.
Regulatory Risks: Monitoring government policies and enforcement actions.
Investor Interest: Tracking institutional and retail participation.
Methods and Channels of Financial Market Coverage
Financial market coverage employs multiple methods, tools, and media channels:
1. Traditional Media
Newspapers and Magazines: Financial dailies like The Wall Street Journal and Economic Times provide daily market summaries.
Television Channels: CNBC, Bloomberg TV, and local financial channels offer live analysis and expert interviews.
Radio and Podcasts: Financial talk shows provide commentary and insights for casual investors.
2. Digital Platforms
Financial Websites and Portals: Platforms like Bloomberg, Reuters, and Moneycontrol deliver real-time updates.
Mobile Apps: Trading apps and news apps provide push notifications and analytical tools.
Social Media: Twitter, LinkedIn, and specialized forums allow rapid dissemination and crowd-sourced sentiment.
3. Analytical Tools
Charting Software: Technical analysis relies on historical price charts and pattern recognition.
Financial Models: Fundamental analysis uses valuation models, discounted cash flows, and ratios.
AI and Big Data: Machine learning models analyze vast datasets to predict market trends and detect anomalies.
4. Institutional Reports
Brokerage Reports: Analysts provide in-depth research reports with buy/sell recommendations.
Investment Bank Publications: Macro and sectoral insights influence market perception and trading strategies.
Regulatory Disclosures: Filings such as 10-Ks, 10-Qs, and prospectuses provide authoritative information.
The Role of Financial Journalists and Analysts
Coverage is not just about raw data; interpretation is critical. Financial journalists and analysts bridge this gap:
Journalists: Provide context, highlight market-moving news, and summarize complex events in understandable language.
Analysts: Offer technical insights, forecasts, and actionable recommendations.
Influencers and Educators: Thought leaders shape sentiment and influence retail participation.
A balanced coverage ecosystem combines speed with accuracy, commentary with data, and local insights with global perspective.
Importance of Financial Market Coverage
1. Promotes Transparency
Timely coverage ensures that market participants have access to relevant information, reducing information asymmetry.
2. Enhances Market Efficiency
Markets respond more accurately when participants are informed, contributing to better price discovery.
3. Guides Investment Decisions
Coverage helps investors identify opportunities, manage risk, and adjust strategies in volatile conditions.
4. Supports Policymaking
Regulators and central banks monitor market coverage to gauge sentiment, liquidity conditions, and systemic risks.
5. Educates the Public
Effective reporting demystifies markets for retail investors, empowering financial literacy and participation.
Challenges in Financial Market Coverage
Despite its critical role, coverage faces several challenges:
1. Information Overload
The sheer volume of financial news can overwhelm investors, making it difficult to distinguish signal from noise.
2. Speed vs. Accuracy
In the digital age, the pressure to report first can compromise accuracy.
3. Bias and Conflicts of Interest
Analyst recommendations and media reporting may be influenced by corporate sponsorships or personal interests.
4. Complexity of Modern Markets
Derivatives, algorithmic trading, and decentralized finance (DeFi) make coverage increasingly technical and challenging.
5. Global Interconnectedness
Events in one country can trigger cascading effects worldwide, demanding comprehensive, real-time coverage.
Conclusion
Financial market coverage is far more than a reporting mechanism; it is a critical pillar of modern financial systems. It informs, guides, and protects the interests of investors, institutions, and regulators. In an era of rapid information flow, complex instruments, and interconnected economies, high-quality coverage ensures that markets remain transparent, efficient, and fair.
As technology evolves and markets become more sophisticated, the role of coverage will expand further, blending real-time data, advanced analytics, and global insights. For any market participant, understanding financial market coverage is no longer optional—it is an essential part of navigating the intricate world of finance.


BTCUSDLONGS looking at for btc.
Earlier this week, the US Federal Reserve (Fed) cut interest rates by 25 basis points, providing the much-required impetus to the economy after a cycle of raising interest rates to keep inflation under check. A cut in interest rates is likely to benefit risk-on assets, including Bitcoin (BTC).
Fed Cuts Interest Rate, Bitcoin Supply Ratio Falls
According to a CryptoQuant Quicktake post by contributor Arab Chain, the latest data from Binance shows that the interest rate cut has rekindled investors’ interest in BTC. Notably, the exchange supply ratio has declined to 0.0291, hinting that investors are choosing to withdraw their BTC from exchanges and hold it for the long-term instead of selling it.
To support their analysis, Arab Chain shared the following chart, which shows a tumbling exchange supply ratio while the BTC price continues to shoot up. The analyst noted that the interest rate cut has increased risk appetite and improved liquidity in the market.

#btcusd Sell Trade AnalystCurrent Snapshot
1 BTC ≈ ₹1,04,55,337 in India.
The price has moved down ~1-2% in the past 24 hours.
Volatility remains high. Hourly and daily swings are noticeable. That means there are intraday opportunities — but with higher risk.
---
⚙️ Intraday Trading Strategies
These are common methods traders use for BTC or crypto intraday:
Strategy What it is When it works well Things to watch out for
Scalping Very short-term trades (minutes, sometimes seconds). Capture small price movements many times per day. When liquidity is high, fees are low, spread is small. High transaction costs; noise (& false signals); needs discipline.
Range-Trading Identify support / resistance zones. Buy near support, sell near resistance. When market is not trending strongly, more sideways movement. Risk of breakout against you; needs tight stop loss.
Trend Following / Momentum Enter when a trend is confirmed (e.g. breakout), ride the trend for some hours. When there’s strong directional move, e.g. after news or volume spike. Reversals can be sharp; need good exit rules; don’t enter too early.
Using Indicators (MA crossover, RSI etc.) Use moving averages, Relative Strength Index, MACD etc. to spot momentum or overbought/oversold. When markets are somewhat stable or predictable; less “wacky” news. Indicators lag; many false signals in volatile markets.

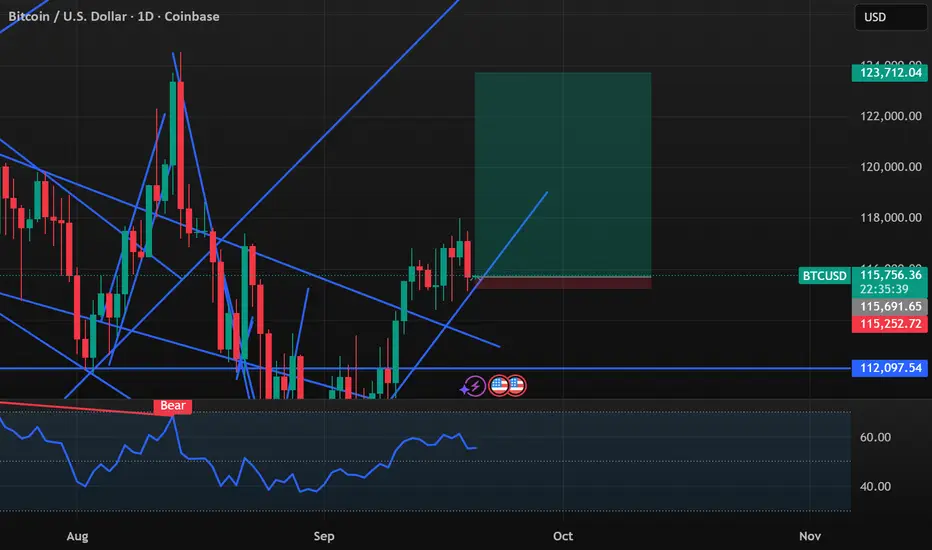
btcThe most important area for Bitcoin to make a short-term upward move is the green box. If this box breaks and consolidates below it, a short-term buy can be expected in the lower box.

BUY BUY BUY 4 HR TrendlineOn the 4-hour timeframe, Bitcoin remains in a bullish trend as long as it holds above its rising support line, with momentum strengthening projecting 123 or new ATH
BITCOIN This is where the fat lady sings..Well this is o secret. We've pointed that out many times before but it couldn't be more relevant than now as Bitcoin (BTCUSD) is approaching the end of its 4-year Cycle.
So where does the 'fat lady sing'? According to the 1M RSI, at the top of its historic 15-year Channel Down. Which by the end of this year it should be above (the vastly oversold condition of) 90.00.
Is there enough time to left to do so? Feel free to let us know in the comments section below!
-------------------------------------------------------------------------------
** Please LIKE 👍, FOLLOW ✅, SHARE 🙌 and COMMENT ✍ if you enjoy this idea! Also share your ideas and charts in the comments section below! This is best way to keep it relevant, support us, keep the content here free and allow the idea to reach as many people as possible. **
-------------------------------------------------------------------------------
💸💸💸💸💸💸
👇 👇 👇 👇 👇 👇

BTC is trying to hold the 108kBTC long term is still bearish but short term is trying to hold the 108k
If it holds 108k we might see a small pump to 112-114k if it gets fomo even 118-124k
If it breaks below 108k then the next stop is at around 98k, so Definitively buy the 98k if it gets there.

Btcusd breakdown to 40KWe are at the end of the monthly chart.
Btc will likely break below trendline and 40k over one year.

BTC USD LongStill holding the long position on the BTC USD.
Stops @ 112,000 - 112,500.
Next update when required.

BTC short trade update from last post !we see more down side? CRYPTOCAP:BTC Short Trade Update: I'm in a short position targeting a potential Monday low. As noted in my previous post, a close below 116.8K could trigger further downside. Stop loss set above the 1hr FVG at 117.2K for risk management !

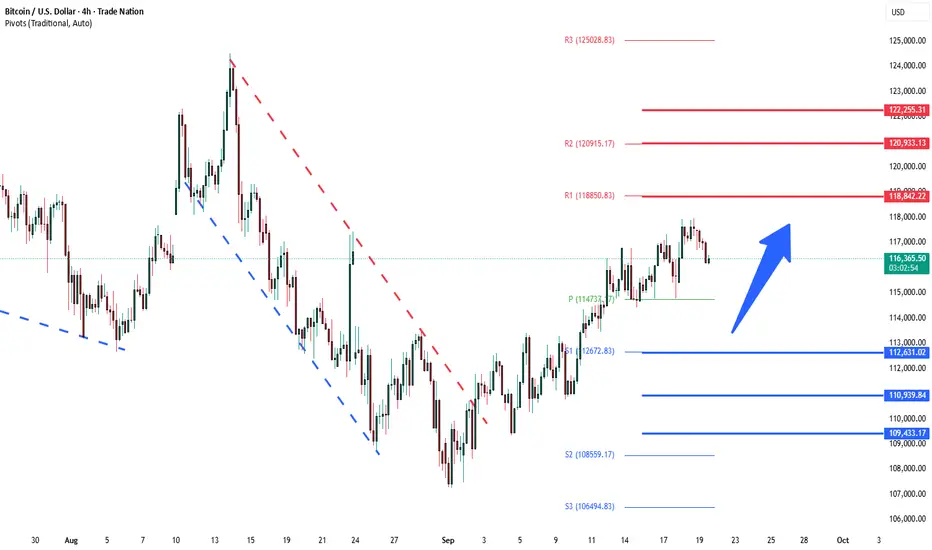
BTCUSD uptrend continuationThe BTCUSD remains in a bullish trend, with recent price action showing signs of a corrective sideways consolidation within the broader uptrend.
Support Zone: 112,630 – a key level from previous consolidation. Price is currently testing or approaching this level.
A bullish rebound from 112,630 would confirm ongoing upside momentum, with potential targets at:
118,840 – initial resistance
120,930 – psychological and structural level
122,260 – extended resistance on the longer-term chart
Bearish Scenario:
A confirmed break and daily close below 112,630 would weaken the bullish outlook and suggest deeper downside risk toward:
110,940 – minor support
109,430 – stronger support and potential demand zone
Outlook:
Bullish bias remains intact while the BTCUSD holds above 112,630. A sustained break below this level could shift momentum to the downside in the short term.
This communication is for informational purposes only and should not be viewed as any form of recommendation as to a particular course of action or as investment advice. It is not intended as an offer or solicitation for the purchase or sale of any financial instrument or as an official confirmation of any transaction. Opinions, estimates and assumptions expressed herein are made as of the date of this communication and are subject to change without notice. This communication has been prepared based upon information, including market prices, data and other information, believed to be reliable; however, Trade Nation does not warrant its completeness or accuracy. All market prices and market data contained in or attached to this communication are indicative and subject to change without notice.
BTC falls back to support, but still has rebound potential#BTCUSD
Although the BTC moving average is bullish, the trading volume is shrinking and there is still a need for a correction in the short term. The first support is around 116500-116000. If it falls below, stop loss in time and continue to watch the support below 115500-114500. If these support levels hold, there is potential for further upward movement towards 118,000-119,000, and possibly even a test of 120,000.

BTCUSDT Added Long positionBTCUSDT is in a critical zone now. could take a long side up to 118000 to grab the Liquadation zone. From there, we take a future position For nwo taking small risk of 1:2.2 reward

BTC PERPETUAL TRADE SELL SETUP Short from $117,600BTC PERPETUAL TRADE
SELL SETUP
Short from $117,600
Currently $117,500
Targeting $116,300 or Down
(Trading plan IF BTC
go up to $118,500
will add more shorts)
Follow the notes for updates
In the event of an early exit,
this analysis will be updated.
Its not a Financial advice

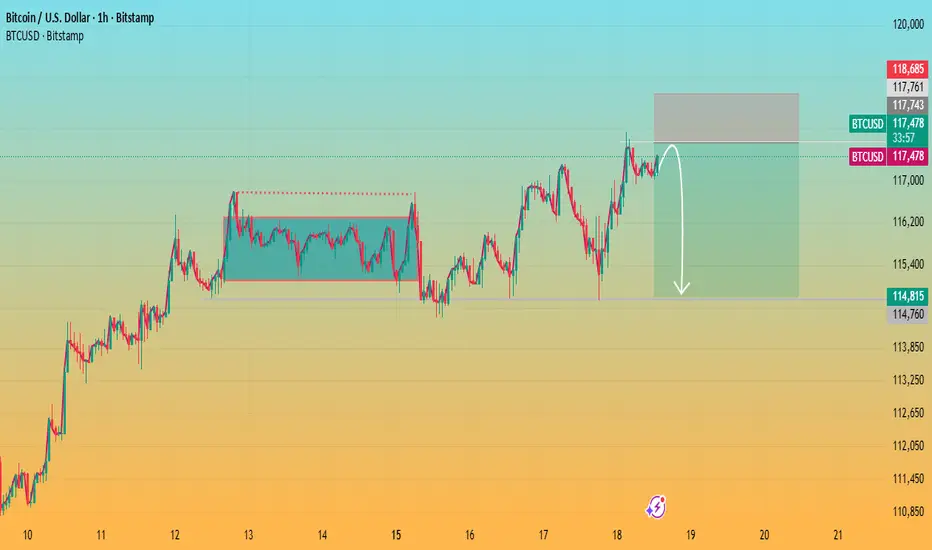
Bitcoin Testing Resistance with Potential Pullback AheadKey observations:
Range Breakout: Earlier, Bitcoin broke out of a consolidation zone (marked box), which triggered the recent upward move.
Resistance Zone: Price is hovering near the 5.15%–5.42% gain zone, where selling pressure has historically emerged.
Pullback Signal: The drawn arrow suggests a possible rejection at this resistance, pointing to a corrective move down toward the 3% zone.
Momentum Check: If BTC fails to hold above this resistance, a retracement is likely. However, a strong breakout could open the door toward 6% gains.
Bitcoin’s 1.5-2 year downtrend has begun. (Phase 1)As predicted in the previous analysis, Bitcoin saw its two-year price ceiling at around $109K when Trump entered the White House, and Bitcoin will have downtrend for about a 1.5-2 year.
This decline will have 3 phases, which I have shown in the first phase chart in 3 stages.
As you can see in the chart, in the first phase, Bitcoin will fall to around $81K and then rise again to near the price ceiling. But in my opinion, it will not be able to create a new price ceiling and will have a heavier decline towards the $50K-$60K range.
@JalilRafieefard
February 18, 2025

2025 is a Bitcoin Rising Wedge PatternBitcoin's two-year bullish wave in 2025 has faded into a low-slope uptrend,
and this trend will continue until the end of 2025 as shown in the image,
and then it will enter a downward trend for about 1-2 years.
First, it will fall to the $100,000 range in the next 15 days,
and then it will grow to about $138,000 in the last 3 months of the year,
and will enter a downward trend in 2026.
@JalilRafieefard
September 19, 2025

Expanding TriangleThe price makes a false breakout followed by a sharp pullback, only for buyers to push the price higher, now the price has broken out followed by a small pullback and now it looks to make a higher high and go long
WE ONLY TRADE PULLBACKS
Comment your thoughts

Bitcoin slips as Fed resumes rate cuts, but Outlook stays neutraBitcoin slips as Fed resumes rate cuts, but Outlook stays neutral
Bitcoin prices edged lower Friday morning after the Federal Reserve cut interest rates by 0.25% on Wednesday. The move initially pressured BTC as Chair Jerome Powell signaled a slower pace of easing than markets had expected. However, the crypto later rebounded as investors noted that further rate cuts remain on the table—generally supportive for risk assets. Still, Bitcoin’s upside was modest compared with stronger gains in some altcoins.
In terms of fundamentals, Bitcoin remains far from overheated. The Network Value to Transactions Golden Cross (NVT-GC), a key on-chain metric comparing market cap to transaction value, is currently in “neutral” territory.
Historically, negative NVT-GC readings—especially below -1.6—have preceded bullish moves, while values above 2.2 often signal reversals. The last major long signal appeared in July, when NVT-GC hit -2.8 before rebounding to 0.3.

BTCUSD Long: Awaiting Bounce from Channel SupportHello, traders! The prior price auction for BTCUSD was controlled by a downward wedge, which guided the price to the major 110000 DEMAND level. A strong bullish initiative from this demand zone caused a reversal and a breakout from the wedge, establishing the current bullish market structure and shifting control to buyers.
Currently, the price action is being guided by a new ascending channel. The auction has recently pushed up to test the significant horizontal supply at the 117600 level and is now in a corrective pullback phase, heading towards the lower support line of this channel for what I see as a critical test.
My scenario for the development of events is a continuation of this uptrend after the corrective dip completes. I believe the price will find strong support on the ascending demand line of the channel. In my opinion, a successful bounce from this dynamic support will confirm that buyers are still in control, triggering the next impulsive wave higher and breaking the 117600 supply level. The take-profit is therefore set at 120300, targeting the upper resistance line of the channel. Manage your risk!
