A VERY Bullish sign for Bitcoin but with a possible Warning
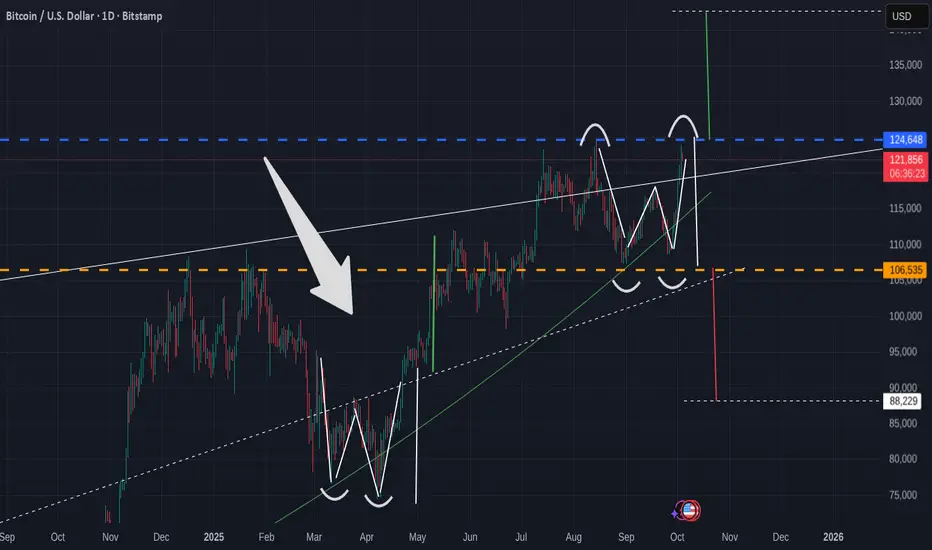
A Very simple Bitcoin Daily chart
Obviously, the eye is drwan to the Arrow pointing towards March / April 2025 when Bitcoin PA printed a W patter, or a double bottom.
The Vertical lines show the measured move higher that was executed perfectly.
The question we have right now is, have we just printed another W pattern, with a Measured Move higher to 142K usd
Or Have we just printed a Double TOP with a measured move LOWER to around 88K usd
4 days ago I posted the Monthly Charts and mentioned that we may start October with a Drop, that may last till around 12 - 15 October.
Untill this measured move plays out, I stand by this But I am obviously also open to this not happening.
What ever happens, I have learnt over the years to be ready for BOTH sides of the coin.
I DO have a BUY SPOT order placed for Bitcoin at 92K
IF we get down there,,IF,,,,,It may well be thelast time we get the chance to Buy Bitcoin under 100K
Time will tell
BTCUSD.PI trade ideas
BITCOIN HIGH PROBABILITY SETUP SOON!!!🚨 BTCUSD HIGH PROBABILITY SELL SETUP 🚨
* Here We Can See Clearly The Next Potential Moves For BTC Coming Hours/Days.
* Keep Your Eyes Close On Your Trading Positions.
* Happy PIP Hunting Traders.
FXKILLA.

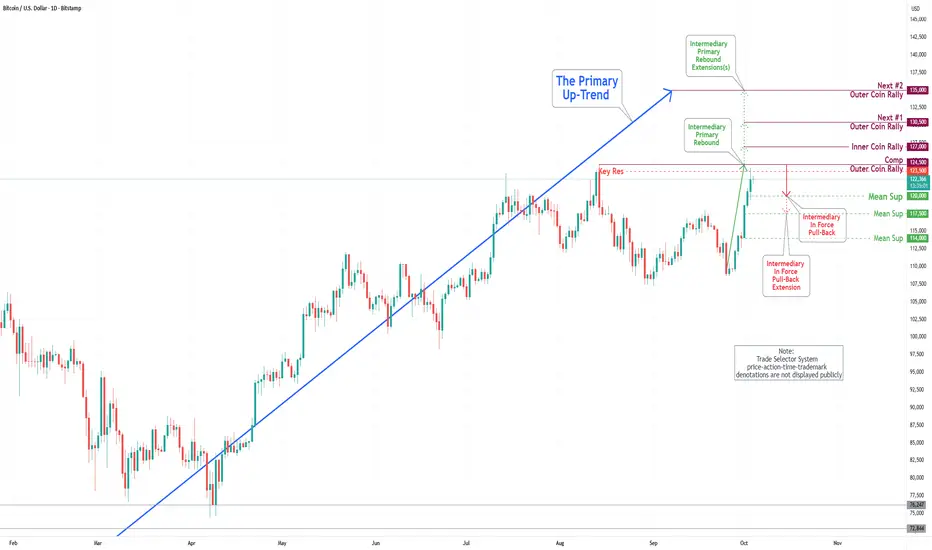
Bitcoin(BTC/USD) Daily Chart Analysis For Week of Oct 3, 2025Technical Analysis and Outlook:
During the most recent trading session, the Bitcoin market exhibited a notable surge, surpassing our Mean Resistance levels of 111600 and 113300, and the established Inner Coin Rally threshold of 117700. Currently, Bitcoin is fluctuating around the Key Resistance level of 123500 as it attempts to retest the completed Outer Coin Rally at 124500.
Following the conclusion of this retest, it is anticipated that the cryptocurrency may initiate an Intermediary In-Force Pullback towards the Mean Support target of 120000, with the potential for a further correction dip to Mean Support at 117500. Upon the completion of this phase(s), we expect Bitcoin to resume its upward trajectory.
Current analysis suggests the following designated upside targets: the Inner Coin Rally at 127000, the Next #1 Outer Coin Rally at 130500, and the Next #2 Outer Coin Rally at 135000. It is essential to recognize that Intermediary In-Force Pullbacks may occur at these specified levels.
BTCUSD analysis on daily timeframe BTCUSD is touching all time high resistance a possibility of short time downside move to nearest support.

BITCOIN Will Go Higher From Support! Long!
Here is our detailed technical review for BITCOIN.
Time Frame: 1D
Current Trend: Bullish
Sentiment: Oversold (based on 7-period RSI)
Forecast: Bullish
The market is on a crucial zone of demand 122,787.24.
The oversold market condition in a combination with key structure gives us a relatively strong bullish signal with goal 130,283.78 level.
P.S
The term oversold refers to a condition where an asset has traded lower in price and has the potential for a price bounce.
Overbought refers to market scenarios where the instrument is traded considerably higher than its fair value. Overvaluation is caused by market sentiments when there is positive news.
Like and subscribe and comment my ideas if you enjoy them!

Against the trend, risky but worthy trade..I found the head and shoulder potential pattern in BTCUSD today.
As price now is challenging its high and been around 88.6% fibo level as well as the previous swing high (left shoulder), i will entry short from this level..
GOOD RR, i am expecting a correction to 114-115k in upcoming week.
CHEERRRSSS...!!!

BTCUSD H4 | Bullish Momentum Likely to ContinueBitcoin (BTC/USD) is falling towards the buy entry at 117,764.14, which is a pullback support that aligns with the 23.6% Fibonacci retracement and could bounce from this level to the upside.
Stop loss is at 114,705.13, which is a pullback support that lines up with he 50% Fibonacci retracement.
Take profit is at 124,031.38, which acts as a swing high resistance.
High Risk Investment Warning
Trading Forex/CFDs on margin carries a high level of risk and may not be suitable for all investors. Leverage can work against you.
Stratos Markets Limited (tradu.com ):
CFDs are complex instruments and come with a high risk of losing money rapidly due to leverage. 65% of retail investor accounts lose money when trading CFDs with this provider. You should consider whether you understand how CFDs work and whether you can afford to take the high risk of losing your money.
Stratos Europe Ltd (tradu.com ):
CFDs are complex instruments and come with a high risk of losing money rapidly due to leverage. 66% of retail investor accounts lose money when trading CFDs with this provider. You should consider whether you understand how CFDs work and whether you can afford to take the high risk of losing your money.
Stratos Global LLC (tradu.com ):
Losses can exceed deposits.
Please be advised that the information presented on TradingView is provided to Tradu (‘Company’, ‘we’) by a third-party provider (‘TFA Global Pte Ltd’). Please be reminded that you are solely responsible for the trading decisions on your account. There is a very high degree of risk involved in trading. Any information and/or content is intended entirely for research, educational and informational purposes only and does not constitute investment or consultation advice or investment strategy. The information is not tailored to the investment needs of any specific person and therefore does not involve a consideration of any of the investment objectives, financial situation or needs of any viewer that may receive it. Kindly also note that past performance is not a reliable indicator of future results. Actual results may differ materially from those anticipated in forward-looking or past performance statements. We assume no liability as to the accuracy or completeness of any of the information and/or content provided herein and the Company cannot be held responsible for any omission, mistake nor for any loss or damage including without limitation to any loss of profit which may arise from reliance on any information supplied by TFA Global Pte Ltd.
The speaker(s) is neither an employee, agent nor representative of Tradu and is therefore acting independently. The opinions given are their own, constitute general market commentary, and do not constitute the opinion or advice of Tradu or any form of personal or investment advice. Tradu neither endorses nor guarantees offerings of third-party speakers, nor is Tradu responsible for the content, veracity or opinions of third-party speakers, presenters or participants.

BTC USD HI GUYS,
Btc has presented a test area for continuation sells. we are bearish as we form a complete cup and handle RT H8, H6, H4.
these are inner structure sell entries as we move

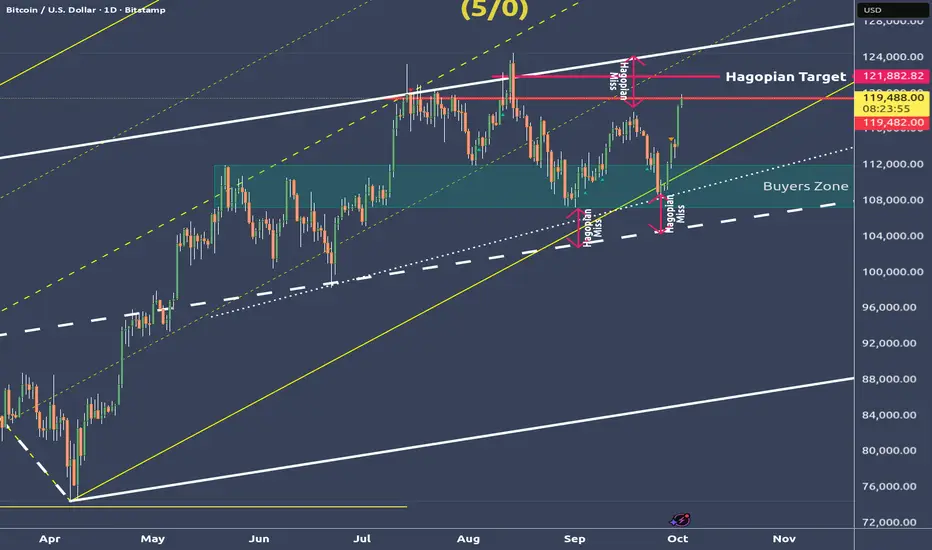
Bitcoin deep dive - We go up to the Hagopians line🔱 Up to the HAGOPIAN's line! 🔱
My last post showed what the possible moves are.
Bitcoin blew through both U-MLH's and is now on the way to the HAGOPIAN-Line.
I could imagine that we even tag the white U-MLH again.
That would be about where the confluence with the yellow forks 1/4 line is.
Because there is much more to say about this chart, I thought I'll do a video.
⛏️ I constructed the Chart from the ground up so you can see all the details and thoughts running through my Mycel Network §8-)
👉 Just check my SOM links.
🙏 Thanks you all for the Boosters I got lately. You all are absolutely awesom and I really appreciate it! 🙏
Yeah...I'm doing BTCUSD quick flip ideas now...Those who have followed me know I've had a bit of a run using my algorithm (no I'm not giving it away or selling it) on stocks, with 152 ideas posted here and 147 closed profitably so far. I have been playing around with it for several months on crypto and it's Saturday and it's raining and I'm bored and BTCUSD is on sale so I thought I'd stir up a little trouble here.
While I don't trade Bitcoin myself except using BITX to double my returns, I'll throw this out mostly for any of my followers that do trade it and are also bored and would like to give it a run on a weekend. Here's how I do this. My initial lot is placed here at this entry price. I do not use stop losses and I do not use price targets. When my algo says sell, I sell without hesitation. If it says buy again before it says sell, I will add another lot at that point, tactically adding and selling until the original lot closes out.
I know there are those who might be understandably skeptical of me not using stop losses, but this works. 23-1* this year, 31-0 last year and 28-0 the year before that. Etc. etc. Literally the only losing trade so far with BTC is the one opened August 15th and that would still be open and only down 1.5% or so. It's been used on stocks for a LONG time with a win rate of better than 99% all time. Maybe consider giving me the benefit of the doubt here...
Anyway, the basic premise behind this is simple - harvest gains before the market has a chance to claw them back. It's FAR easier to make money than it is to make it back after you lose it, so my goal is to not lose it. It's pretty simple in that regard. Short duration, high percentage trades stacked one after the other. When one trade pays off, I put the money to work elsewhere immediately. There is always something on sale somewhere.
This is not a trading style for the get rich quick, moonshot or bust crowd, so just move along if that's you. My goal is a relentlessly increasing equity curve and if you're wondering how that's going, check out the first paragraph again.
So here goes. Fully prepared for crazies who think trying to shout my long idea down will magically protect their short positions (btw, it doesn't work). If this hasn't paid off by Monday, I'll be loading up on BITX then. For now, let's pretend I'm long at 115,750.57.
As always - this is intended as "edutainment" and my perspective on what I am or would be doing, not a recommendation for you to buy or sell. Act accordingly and invest at your own risk. DYOR and only make investments that make good financial sense for you in your current situation.

Could BTC Break $100K on the Way Down?History Might Rhyme Again
Looking at BTC on the 1D timeframe, a pattern seems to be forming, one that we’ve already seen twice this cycle.
🔎 March 2024:
Price made an ATH just above the 78.6% Fib, chopped around that level, then dropped below the 50MA first a fake-out, then the real break. After that came the drop below the 200MA.
All price action stayed confined between:
• 78.6% – 61.8%
• 61.8% – 50%
Meanwhile, RSI formed higher lows → a clear bullish divergence while price was making lower lows.
🔎 December 2024:
ATH at the 127.2% Fib level, same pattern: chop → fake-out under 50MA → real drop → break below 200MA.
Price again stayed confined between:
• 127.2% – 100%
• 100% – 78.6%
And again, RSI showed higher lows while price went lower, another bullish divergence.
🔎 Today:
ATH in July (or August, with just a few dollars difference), chop at 161.8% Fib, fake-out under 50MA, now real drop under 50MA. Price is getting close to the 200MA.
The big question:
Will it do the same again?
– Drop under the 200MA
– Trade between 161.8% – 127.2% and 127.2% – 100%
– Form a bullish divergence on RSI while making lower lows
If history rhymes, we could see BTC trade below $100K before forming the next major leg up.
🎯 Plan:
I’m preparing for this scenario and adjusting risk accordingly. High-leverage trades here need surgical precision.
📌 Mindset Reminder:
This is where patience and discipline get tested. It’s not just about charts, it’s about staying calm when fear takes over.
🟠 Macro Wildcard:
The Fed has already started cutting rates.
A rate cut in October could shift BTC’s trajectory upward, but a pause in October could just as easily push price lower.
🎯 Closing Line:
History may not repeat, but right now it’s rhyming loudly and I’m listening.
Always take profits and manage risk.
Interaction is welcome.

BTCUSD – Last Chance to Go HigherOver the weekend, price found support just outside the white L-MLH. That’s where I previously mentioned the red Centerline — the target for the earlier short trade.
Now, however, price has jumped back into the fork. Tthis could be the last chance to break out of the down-sloping yellow fork to the upside.
P3 would be my next level to watch for support after the break of the red Centerline.

BITCOIN Is Going Up! Buy!
Take a look at our analysis for BITCOIN.
Time Frame: 9h
Current Trend: Bullish
Sentiment: Oversold (based on 7-period RSI)
Forecast: Bullish
The price is testing a key support 109,230.63.
Current market trend & oversold RSI makes me think that buyers will push the price. I will anticipate a bullish movement at least to 112,035.52 level.
P.S
We determine oversold/overbought condition with RSI indicator.
When it drops below 30 - the market is considered to be oversold.
When it bounces above 70 - the market is considered to be overbought.
Like and subscribe and comment my ideas if you enjoy them!

Bitcoin top not is in. We can see that no local peak has yet been observed in terms of the cyclical logarithmic nature of Bitcoin.

Bitcoin Eyes $114K Before Bearish ContinuationFenzoFx—Bitcoin remains bearish, though the downtrend eased near the equal lows at $107,268. The first daily bearish fair value gap has been inverted, but this does not signal a market structure shift. Price may rise toward higher resistance before resuming its decline.
Immediate support is at $110,370. Technically, BTC/USD could target the mean threshold of the bearish FVG near $114,000.0, offering a premium entry for short positions aiming below $107,268.

Weekly Crypto Market Review: BTC, ETH, SOL, XRP, BNB, HYPEReview of trend structures and my expectations for the coming weeks on Bitcoin and key altcoins.
The key local support zones highlighted in the previous market outlook did not hold against selling pressure, increasing the likelihood of a more prolonged consolidation across the crypto space.
As long as prices continue to close below their local resistance areas, the base scenario remains in favor of further correction toward macro support levels.
Below is a brief summary of important resistance, support zones and potential trend structures I am following:
BITSTAMP:BTCUSD
Chart:
Resistance: 112–114.5k
Support: 103.5–101–98k
BITSTAMP:ETHUSD
Chart:
Resistance: 4115–4215
Support: 3700–3430
BINANCE:BNBUSD
Chart:
Resistance: 1020–1040
Support: 900–870–840
BITSTAMP:XRPUSD
Chart:
Resistance: 2.87–2.99 / 3.07
Support: 2.55–2.40–2.32
PYTH:HYPEUSD
Chart:
Resistance: 49–50–53
Support: 35.5–29–23
COINBASE:SOLUSD
Chart:
Resistance: 213–219
Support: 177–169
Thank you for your attention, and I wish you a successful week ahead.

Bitcoin - Bitcoin Left Behind the Stock Market!?Bitcoin is in its descending channel on the four-hour timeframe, between the EMA50 and EMA200. In case of an upward correction towards the specified supply zone, it is possible to sell Bitcoin with a better risk-reward.
It should be noted that there is a possibility of heavy fluctuations and shadows due to the movement of whales in the market and compliance with capital management in the cryptocurrency market will be more important. If the downward trend continues, we can buy in the demand range.
A group of U.S. lawmakers has called on the Securities and Exchange Commission (SEC) to enforce an executive order issued by President Donald Trump that opens the door for cryptocurrency investments within the $12.5 trillion 401(k) retirement fund market. Signed in August, the order authorizes 401(k) plans to offer cryptocurrencies as a new investment option.
Members of the House Financial Services Committee, in a formal letter, praised the order for its potential to help Americans boost their retirement savings. They urged the SEC to work with the Department of Labor to update existing rules and guidelines, with the aim of enabling millions of Americans to gain access to such investment opportunities for their retirement.
The letter further stated: “We also ask the SEC to review the bipartisan bills currently advancing in the 119th Congress regarding accredited investors. We hope these measures will allow the 90 million Americans who are currently excluded from alternative investments to secure a more dignified and comfortable retirement.”
Meanwhile, the Senate Finance Committee announced that it will hold a hearing this week on the issue of digital asset taxation, as industry stakeholders continue to press for greater clarity in federal regulations.
According to Committee Chairman Mike Crapo, the session—titled “Examining the Taxation of Digital Assets”—is scheduled for October 1. The official notice confirmed that Lawrence Zlatkin, Vice President of Tax at Coinbase, and Jason Somensatto, Policy Director at Coin Center, will testify at the hearing.
The committee had earlier invited public comments on how existing tax laws should apply to digital assets and whether new legislative frameworks are needed. The upcoming session is expected to draw heavily on the recommendations of the White House Digital Asset Working Group, which urged lawmakers to recognize cryptocurrencies as a distinct asset class and establish tailored tax rules separate from those applied to commodities and securities.
From a market perspective, liquidation heatmaps in the futures market highlight clusters of leveraged positions at key levels. When the price fell between $114,000 and $112,000, a wave of long liquidations occurred simultaneously, leading to heavy wipeouts and accelerating the downward momentum.
Risk pockets remain around the $117,000 level, making both sides of the market vulnerable to liquidity-driven volatility. Without strong demand at these levels, fragility persists, increasing the likelihood of another sharp downward move.

We love Red daysA tru investor/Day traders gets fu***ing excited when the markets are bleeding because they understand how to maneuver and capitalize on the fear of others… clean support sitting at 110,000 let’s see what shakes out🫣
But hey…. What do I know..

107 the first target in downtrendSoon
After increasing price we can see another waves of downtrend to minimum 107000
BTCUSDT (H1) – Trading ScenariosScenario 1 – Rebound from Demand Zone
The demand area at 108,500 – 108,700 remains the strongest short-term support.
If bullish reversal patterns (Pin Bar, Bullish Engulfing) form here with confirming volume, a rebound is likely.
Trade Setup: Enter long around 108,600 – 108,700, targeting 109,800 (PoC) as the first objective, and 111,900 – 112,100 (VAH) as the second.
Stop Loss: Below 108,300.
Scenario 2 – Consolidation around PoC
The PoC area at 109,400 – 110,200 represents the equilibrium zone where price may consolidate.
In this case, short-term scalping strategies can be applied: buying near the lower bound (109,400) and selling near the upper bound (110,200).
Take Profit: Quick targets of 30–50 USD.
Stop Loss: 0.3–0.5%, depending on position sizing.
Scenario 3 – Breakout above VAH
A decisive close above the 111,900 – 112,100 (VAH) zone would confirm bullish continuation.
This breakout would likely attract momentum buyers and trigger stop orders.
Trade Setup: Place buy stops at 112,150 – 112,200, aiming for 112,800 as the first target and 113,500 (liquidity zone above) as the second.
Stop Loss: If price falls back below 111,700.
Scenario 4 – Breakdown of Demand Zone
If price closes firmly below 108,500 with high volume, it signals bearish continuation.
Such a breakdown opens the path to lower liquidity levels.
Trade Setup: Enter short via sell stops at 108,450 – 108,500.
Targets: 107,800 initially, followed by 106,500.
Stop Loss: Above 108,900.
✅ Summary
Bullish setups: Buy from 108,600 – 108,700 (Demand Zone) or on breakout above 112,100.
Bearish setups: Sell if 108,500 breaks, or look for rejection signals near 113,000.

BTCUSD 1D Chart🔎 key levels
• Resistance: approx. 117,971 USD
• Resistance: approx. 111 426 USD -
• Support 2: approx. 108 292 USD - the course is testing this level.
• Strong support: approx. 103 883 USD - strategic defense level.
📈 Trend
• You can see a clear upward trend (orange trend line), but has just been violated by a strong relegation candle.
• It can be a signal of buyers' weaknesses.
📊 oscillator (Stoch RSI)
• It is very low (close to the sale zone).
• This means that a short -term reflection may occur, but there is no confirmation.
🚩 Scenarios
1. Bycza - if the course reflects from 108k and returns above 111k, a possible approach to 117K.

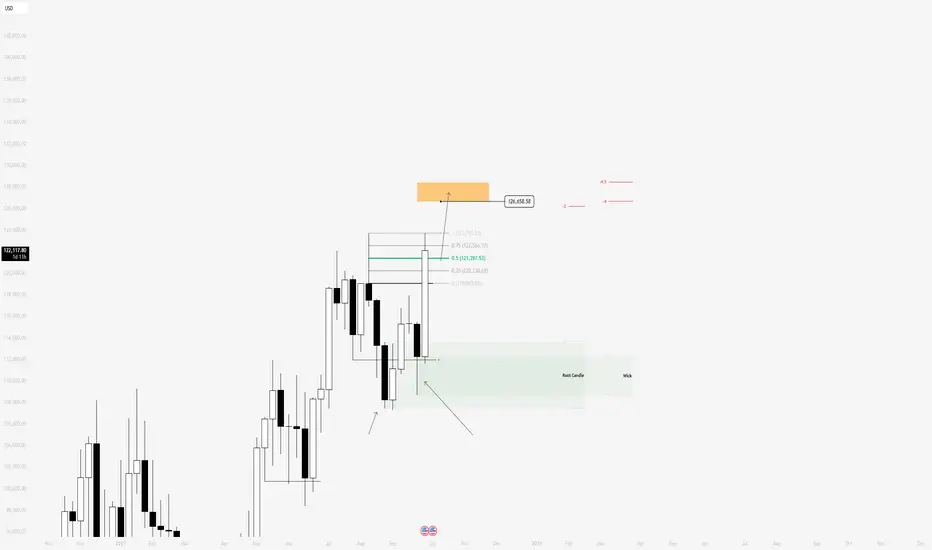
BTC Well on it's way to 126kTechnical analysis most times does not need many words.
Here we have a very bullish bitcoin BINANCE:BTCUSD
Using the wicks on the weekly chart, I can measure them and project values towards all time highs based on Market Maker Model Dynamics
The first projection, is the root candle of the current distribution
The second projection is the lower wick of the last re-accumulation before we had an expansion in the just concluded week.
Both projections, converge around 126k so I have my sights set on 126k
I anticipate the lower wick of the upcoming week to form around 121k (50% premium wick level)
See image below
BINANCE:BTCUSD
That's it.