114-114K is a Key Level for BTC directionMorning folks,
So, BTC indeed dropped as we suggested. It was not a surprise with so tight liquidity situation in the US... Now, BTC keeps door open to both scenarios with some adv. on bearish side. But this adv. is not total.
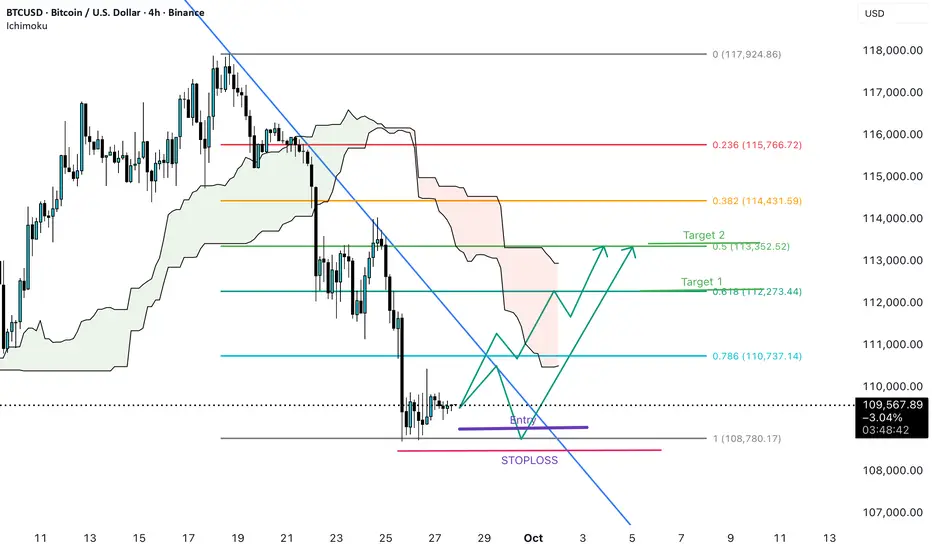
Since our H&S pattern in a process of failure, it is logical to suggest [b ]potential Butterfly on daily chart
At the same, on 1H chart we can see that BTC is forming reverse H&S pattern. By itself, it is not a problem for daily butterfly, this H&S might become a part of it. But, it could become the part of weekly opposite butterfly either.
So, everything depends on 114-114.5K area which is a neckline. Upside breakout increases bullish chances. What we're going to do?
Obviously - try to take a long position with H&S. No matter, will it get minor target or become a reversal pattern - anyway it has to be considered. And we also will be keep an eye on its failure. This is also important and gives us a confidence with downside continuation.
Probably to the next update on Thu, we should get the clarity over this pattern. Right now we prefer to sit on the hands.
BTCUSD.PI trade ideas

I'm shocked at how good my AI forecasts are. I can't promise they'll always be like this, but as I feel the fails I too want to celebrate the WINS
This is the accuracy serious traders want to make money
(are you impressed yet?)

Uptrend or strong correction?Bitcoin’s move toward 117,000 looks strong. If it can break through the 117,000 resistance and move higher, we’ll see a trend reversal. But as long as it stays below 117,000, the trend remains bearish. ✅

This BTC cycle has a higher % increase in PA than previous cycle
Many people are moaning about how Calm and Lazy Bitcoin is this cycle, all waiting for that mad parabolic push higher to ATH
And it may happen again, though I doubt it.
But as this post shows you, we have had already, a higher % increase over previous cycles
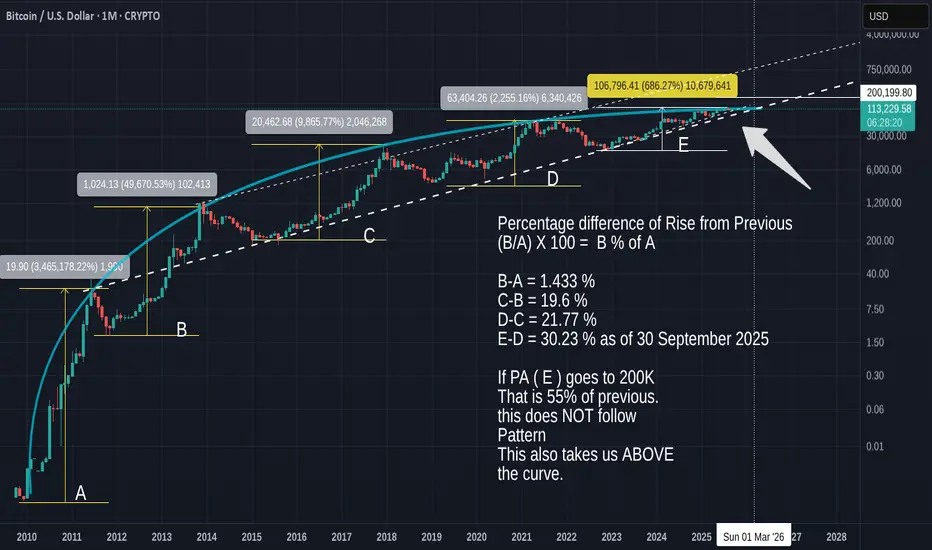
So, what is The % of increase over the previous cycles. Or, How much of the previous increase from Low to ATH was this cycle, in %. The same would be 100%, Half would be 50%
If you refer to the main chart for the letters.
(B/A) X 100 = B % of A
B-A = 1.433 % - The Rose from the Low to the Next ATH was only 1.4% of the previous increase.
C-B = 19.6 %
D-C = 21.77 %
E-D = 30.23 % as of 30 September 2025. A Larger increase that previously.
If PA ( E ) goes to 200K This cycle as many expect, That is 55% of previous increase.
This does NOT follow the last 2 [previous pushes that are in the long term channel of near 20 % on average.
This also takes us ABOVE the curve.
THE CURVE ( Blue) is a part of a Fibonacci spiral that has rejected every ATH since BTC began.
PA needs to rise above this Curve, as you can see, or we get pushed back down.
This Zoomed in Image of the same main monthly chart show this ckearly
PA has been trying to escape this Arc for a Long time now and is struggling a little but with the Strong line of support below, that has NEVER broken, we should be able to cross over and remain above this Arc.
We have till December 2025 before that arc begin to push PA back down in a negative Arc
I have explained in previous posts about this idea but here is the chart
So, the % increase of previous pushes WILL rise further
It has to
$BTC Wyckoff DistributionPreliminary supply, or PSY:
Occurs when significant interests start to sell lots of shares following a sharp upward trend. Volume increases and the price spread widens, indicating the possibility of a trend change.
BC:
buying climax, characterized by frequently significant rises in volume and price spread. The intensity of purchasing peaks, with professional interests filling heavy or urgent public demand at prices close to their peak. Since large operators require enormous public demand to sell their shares without reducing the stock price, a BC frequently occurs in conjunction with excellent earnings reports or other positive news.
AR:
Automatic reaction. After the BC, the strong buying significantly decreased, but the heavy supply persisted, and an AR occurred. The lower border of the distribution TR is defined in part by the selloff's low.
ST:
Stands for the secondary test, in which the price returns to the BC region to evaluate the demand/supply situation at the current price levels. Supply must exceed demand for a top to be confirmed, so volume and spread should decline as the price moves closer to BC's resistance zone. An ST could appear as an upthrust (UT), in which case the price goes above the resistance indicated by the BC and perhaps other STs before abruptly reversing to close below resistance. Price frequently tests the TR's lower boundary after a UT.
SOW—sign of weakness:
A downtrend to (or just barely past) the TR's lower border, typically accompanied by an increase in spread and volume, is an indication of weakness (SOW). The AR and the initial SOW(s) point to a shift in the stock's price movement, with supply now in control.
Last point of supply, or LPSY:
A weak rally on a tight spread following a test of support on a SOW indicates that the market is having significant difficulties advancing. Strong supply, low demand, or both may be to blame for this market's inability to recover. Before markdowns start in earnest, LPSYs signify the end of the demand cycle and the final distribution waves from large operators.

BITCOIN BUYERS WILL DOMINATE THE MARKET|LONG
BITCOIN SIGNAL
Trade Direction: long
Entry Level: 109,018.58
Target Level: 113,324.76
Stop Loss: 106,141.68
RISK PROFILE
Risk level: medium
Suggested risk: 1%
Timeframe: 9h
Disclosure: I am part of Trade Nation's Influencer program and receive a monthly fee for using their TradingView charts in my analysis.
✅LIKE AND COMMENT MY IDEAS✅

Bitcoin Bull Market Support Band!Bitcoin Bull Market Support Band!
Bitcoin is bouncing from the bitcoin bull market support band.

$Btc Turning PointBitcoin has bounced from its lower low and is now pressing toward the upper wall, but here’s the catch — it still hasn’t printed a higher high. The market seems to be preparing for a potential higher low formation, yet the RSI slipping from the overbought zone hints at profit-taking.
What does this mean? If CRYPTOCAP:BTC confirms a new lower high and holds, we could witness a push upward as buyers regain control. But if that setup fails and a fresh lower low forms, a clear bearish phase might kick in. The coming sessions will reveal whether Bitcoin is setting up for a healthy continuation or a deeper downturn.
Keep a close watch — this zone could define the next big move.
#Bitcoin #CryptoMarket #BTCAnalysis #TradingView

BTC Trade Setup: Dip Buy Zone at 113.8K, Breakout Above 115K1. Trend
BTC is currently in a short-term uptrend (multiple BOS and higher highs).
Price is stalling around Fib 0.5–0.618 zone (114,800 – 114,900).
The uptrend line is still holding for now.
2. Key Levels
Resistance: 114,800 – 115,000 (Fib 0.5–0.618).
Support zones:
113,800 – 114,000 (nearest FVG).
113,200 – 113,400 (previous structure + FVG).
111,800 – 112,200 (deeper FVG if correction extends).
3. Trading Plan (scenarios)
Scenario 1 – Buy with trend:
Wait for retracement into 113,800 – 114,000 zone.
Entry: Buy inside this zone.
SL: Below 113,600.
TP1: 114,800 – 115,000.
TP2: 115,500+.
Scenario 2 – Short-term Sell:
If price breaks below the trendline + closes under 114,000.
Entry: Sell on pullback.
TP1: 113,200.
TP2: 112,200.
4. Outlook
Short-term: Likely to retrace into 113,800 – 114,000 FVG before retesting 114,800 – 115,000 resistance.
If breaks above 115,000, next bullish target is 115,600 – 116,000.
If loses 113,800, a deeper correction toward 113,200 – 112,200 is expected.

Will BTC come out of the downward channel?• In the chart you can see how we are close to the upper limit of the downward channel. This is a key signal - if the breaking persists, it may mean a change in the trend.
• We have several support levels from below (marked with red lines):
• 112,238 USD
• USD 108,981
• USD 107,040
• From the top you can see resistance (green lines):
• 115,266 USD (local resistance - the course is just approaching)
• 117 395 USD
• 119 404 USD
⸻
🔹 Medium walking (SMA/EMA)
• You can see EMA Cross 50/200 (yellow label) - a classic signal "Golden Cross" / "Death Cross". It seems that the average is raised recently, which the market often interprets as a signal of a potential change of trend.
• SMA #1 and #2 (red and green lines) - the course tries to stay above the average, which is positive.
• SMA #5 (blue line below) shows long -term support ~ 107k USD.
⸻
🔹 MacD (below)
• The histogram shows reversal - red posts decrease, and the lines (blue and orange) are approaching each other → possible buy signal.
• If the signal line is intersected up, this will be confirmed by the growth moment.
⸻
🔹 RSI (Relative Strength Index)
• RSI is currently around 40-50 →, i.e. a neutral level (neither purchase nor selling).
• It slightly reflects from below, which suggests that there may still be space for further growth before we enter the purchase zone (> 70).
⸻
📌 Summary
• Short -term (1-7 days): it looks like BTC is trying to stand out from the downward trend. If it pierces 115,266 USD and persists above, subsequent goals are 117 395 USD and 119 404 USD.
• Medium -term (weeks): support levels 112K - 108K are key. A decrease below 107k would negate a bull scenario.
• Technical signals: MacD and RSI give the first signs of reflection. The course balances on the border of breaking the trend.
👉 It looks at the beginning of a potential growth movement, but it will be crucial whether BTC will stay above 115K.


Is is over for BITCOIN or new ATH is next ??Hi everyone.
Here is the summary of what i think about btc.
I expect a dip to mid 90s region. liquidity will be grabbed and then the path to new all time high in Q4 will be set.
I expect 130k - 140k region to be the top of this cycle for bitcoin.
meanwhile some altcoins will print massive pumps too.
I believe bear run can start in late Q1 2026 followed by a dip of a bear run in Q3 2026 where bitcoin can form bottom at 45k - 60k region.
follow me for more analysis and altcoins

BTC BUYA double bottom is clearly visible and a bullish move has already started. Price has past a zone and is expected to continue moving upwards to complete the W pattern.
Your entry point is 113991,tp is 123441 and your stop loss at the dotted line which is at 111073.

BTCUSD Another Bullish Continuation PatternAnother bull flag has formed. Meaning another bullish impulse is loading.
Every time you see one of these, do not hesitate. Ride the trend.

BTC/USD - TRADER EDGE💎 Diamond Difference Maker:
Everyone sees the same chart, but only those who read the full breakdown captures the edge.
🎯 KEY PIVOT ZONE
SUPPLY ZONE: $115,800 - $117,400
Dense cluster of session POCs converging at this level showing consistent resistance
Massive VRVP volume node indicating heavy historical trading activity and institutional interest
Price currently trading below this zone after recent rejection, confirming supply dominance
Multiple failed breakout attempts visible, reinforcing this as critical overhead resistance
📊 PRICE TARGETS
UPSIDE TARGETS ⬆️
T1: $115,800 - $117,400 (Primary supply zone retest)
T2: $119,000 - $120,800 (Secondary volume node with POC cluster convergence)
DOWNSIDE TARGETS ⬇️
T1: $111,600 - $112,800 (Immediate support volume node with POC alignment)
T2: $108,200 - $109,800 (Major demand zone with multiple POC convergence and high volume)
⚡⚡ EDGE - HIGHEST PROBABILITY PLAY
Short from supply zone rejection with targets at lower volume nodes where demand historically emerged.
🔍 PRE-ENTRY CONFIRMATION SIGNALS
These signals must occur BEFORE entering the trade and at appropriate price levels:
✅ Bearish rejection pattern forming at or above $115,800
(shooting star, bearish engulfing, or long upper wick)
✅ Failed breakout above $116,500 followed by rapid reversal back into the range confirming distribution
✅ Volume spike at $115,800-$117,400 zone with selling pressure exceeding buying, visible on volume bars
📈 TRADE SETUP
🔴PRIMARY BIAS: BEARISH @ Current Position
🆗➡️Short Setup:
Entry: $115,800 - $117,400 -
(wait for price to reach zone AND display confirmation signals above)
Stop Loss: $117,850 - (above supply zone and recent swing high)
Target 1: $111,600 - $112,800
Target 2: $108,200 - $109,800
Risk/Reward: 1:2.4 (to T1) / 1:5.8 (to T2)
🔄 BIAS FLIP CONDITIONS
🟢TURNS BULLISH IF:
Strong breakout with 2H candle close above $117,850 accompanied by volume expansion above average
Price reclaims supply zone and holds above $117,400 for at least 4 hours showing demand absorption
Higher lows formation above $117,000 with bullish market structure shift
⚡Then Target:
New T1: $119,000 - $120,800
New T2: $122,400 - $123,600
⚠️ RISK MANAGEMENT
Max Risk: $1,650 per contract from mid-entry to stop (approximately 1.4% risk)
Position Size: Limit exposure to 1-2% of total trading capital on this single setup
Time Stop: Close position if no favorable movement within 16 hours or before major economic releases
✅CONTEXT NOTES:
Current price is consolidating in a lower-volume area between $113,000-$115,000 suggesting potential volatility
Watch for bounce attempts toward the supply zone for optimal short entry positioning
The $109,000-$113,000 range shows thinner volume profile indicating faster price movement potential through this area

Uptrend? what an interesting start to the week...
This trend didn't create a lower low on the dominant trend chart.
this either means some dodgy price action is going to fly in, or perhaps we've switched over to an uptrend.
I'm going to get to my AI forecasting upgraded to make daily predictions more frequent

Btcusd healthy correction before it go up or further fall -levelBtc continuously falling from the resistance area of 118000 to 109000, before it further fall or go up health correction may be possible and price may go up to target 1 and target 2 which align with fib 0.5 and 0.618 level .Target 3 may also possible fib 0.382. Let us see how it plays out. SL .108500
BTCUSD Long Idea: Bullish Break and Retest of Key LevelHello TradingView Community,
This post outlines a potential long trade setup on the Bitcoin / U.S. Dollar (BTCUSD) pair, based on the 15-minute timeframe.
Technical Analysis:
The chart is showing a potential shift in momentum from bearish to bullish. A key horizontal price level can be identified at approximately $111,684.09. This level previously acted as a support zone before a breakdown, and subsequently served as a resistance ceiling.
We have recently witnessed a strong breakout above this key level, suggesting that buyers are stepping in with force. The trading idea is based on a classic "break and retest" scenario. The expectation is that the price will pull back to this former resistance level, which is now anticipated to act as new support. A successful bounce from this area would provide a confirmation to enter a long position.
Trade Setup:
The long position tool on the chart visualizes a potential trade plan based on this bullish outlook:
Entry: Approximately $111,684.09 (at the retest of the new support).
Stop Loss: $109,435.79 (placed below the support structure to invalidate the idea if the level fails to hold).
Take Profit: $120,820.14 (targeting a new higher high, representing the next potential leg up).
This setup offers a structured plan with a favorable risk-to-reward ratio for a potential bullish continuation.
Disclaimer: This analysis is for educational and discussion purposes only and should not be considered financial advice. Trading cryptocurrencies involves significant risk. Please conduct your own due diligence and manage your risk appropriately.

Is Btc STILL following this Eth Fractal? On Sept 9th I suggested Btc was following this Eth Fractal.
On Sept 12th I expressed concern for a lower low, and Btc seems to be heading lower now.
If Btc (on the 1 Day) is following this Eth (4 hr) fractal, then Btc may soon see a lower low (below 107). Alts may bleed harder.
I hope I'm wrong. But I am cautious for several reason, as also indicated in my other previously published charts.

BTCUSDPreferably suitable for scalping and accurate as long as you watch carefully the price action with the drawn areas.
With your likes and comments, you give me enough energy to provide the best analysis on an ongoing basis.
And if you needed any analysis that was not on the page, you can ask me with a comment or a personal message.
Enjoy Trading ;)

BITCOIN Is Going Up! Buy!
Take a look at our analysis for BITCOIN.
Time Frame: 9h
Current Trend: Bullish
Sentiment: Oversold (based on 7-period RSI)
Forecast: Bullish
The price is testing a key support 109,230.63.
Current market trend & oversold RSI makes me think that buyers will push the price. I will anticipate a bullish movement at least to 112,035.52 level.
P.S
We determine oversold/overbought condition with RSI indicator.
When it drops below 30 - the market is considered to be oversold.
When it bounces above 70 - the market is considered to be overbought.
Like and subscribe and comment my ideas if you enjoy them!

Bitcoin top not is in. We can see that no local peak has yet been observed in terms of the cyclical logarithmic nature of Bitcoin.

BTCBitcoin has been trading between 3 main areas - $117K, 112K and 108K, for over a month. Yesterday’s move was encouraging, but found resistance (predictably) at $112K.
Not much to see here until we get a definitive move above 117K or below 108K (those zones, not exact numbers).
