btc cyclecrypto cycle and seasonality analyzing timeframes and predicting next top and bottom using previous ones and halvings
Trade ideas

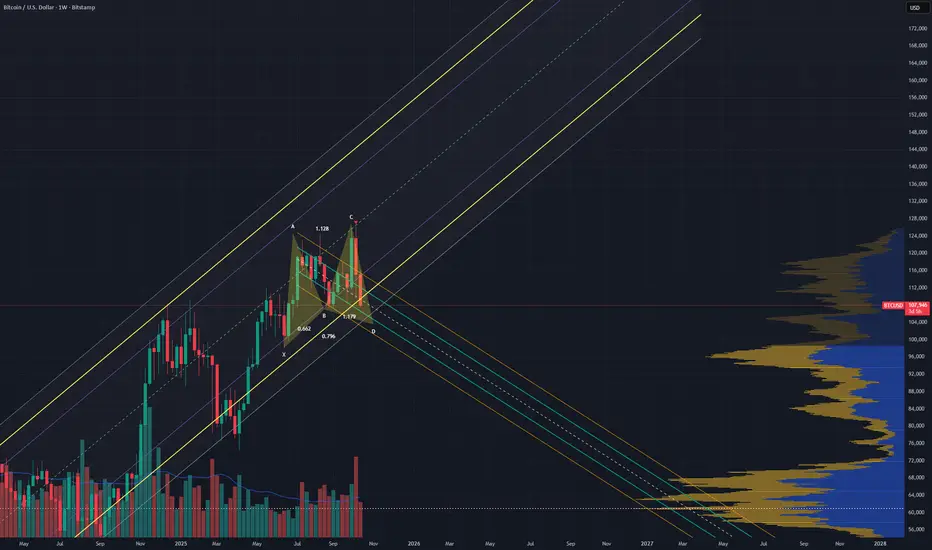
These channels and harmonic are all you need to know for BitcoinThe channel BTC goes to and stays in once this harmonic completes will tell you where CRYPTOCAP:BTC will go
EVE an Adam Top Bearish Break target $92,000.-BTC under a Top Pattern with Target $92,000.-
At Golden Fib Support
Not for Short but accumulation opportunity.

Bitcoin WeeklyTarget is 54k
May reverse in the 54-64k zone to fill the gap left at 20k.
Bullish if we can break the double top formation,
Target is 80k-120k
Expected to hit 54k with in the next 6 weeks.

Bitcoin (BTC/USD) Bearish Continuation After Liquidity GrabThe BTC/USD daily chart shows a bearish structure forming after a sharp rejection from the upper resistance area near $116,000–$117,000. The large red candle at the top indicates a strong liquidity sweep, where price briefly moved higher to collect buy-side liquidity before reversing downward.
Following this, a series of smaller candles suggest consolidation under the resistance zone, with a clear lower-high formation, signaling potential continuation to the downside. The blue-shaded box represents a premium zone (supply area) where sellers are expected to remain dominant.
The projected black arrow path on the chart shows an anticipated pullback toward the mid-level ($112,000–$113,000) before continuation of the bearish move targeting the $108,000–$109,000 zone — a potential demand or support area.
Summary:
Trend: Bearish continuation
Key resistance: $115,000–$117,000
Short-term pullback: $112,000–$113,000
Target zone: $108,000–$109,000
Market sentiment: Bearish after liquidity grab and lower-high formation

BTC — 4H ChartBTC — 4H Chart 📈
Price is currently in minor consolidation, forming a double bottom pattern.
We’ll wait for a valid breakout, followed by a retest with price action confirmation, before targeting the nearest resistance zone.
Buy Target: 113,588.85
CAPITALCOM:BTCUSD

Milestone Unlocked🚀 Milestone Unlocked!
My indicator RMBS Smart Detector – Multi-Factor Momentum System just hit 50 likes and 630 views in its first week on TradingView!
Thanks to everyone who tested and trusted it.
Stay tuned — new upgrades and strategies are coming soon. 💡
#TradingView #CryptoAnalysis #Indicator #TechnicalAnalysis #ArioPinelab

if they are going to hunt anoter whales? 1024000$?the weakness of the trend is obvious, do you believe that btc can reach 176000$ or not? the time period is finished and noting happen to altcoins?

Im not sayinig I was right BUT . . . These things are hard to predict yes but without significant new buyers and some new bitcoin hype it might stay stuck in its current position between $100k - $125k, But I mean we live and learn. When managing other people's money do not and by all means do not take unnecessary risk. Like Why would I margin myself up to my eyeballs in debt if I know I don't have it. It's it a gambling addiction or the rush of the trade. Figure it out it really does take some emotional discipline. I feel it right now because on my paper trade I made over a $1 mil on one trade. But with my real money I find myself YOLO-ing on GOLD right now because I'm trying to build my account fast. I'm broke I joined the Army because my family and I were going to be homeless.
But now here I am giving out winning trades, but I do not have the capital to invest so I'm starting with $250 in real money, So far I managed to get up to $800 Then I had to use a large portion of that because I was moving but now hopefully that I am moved and settling I can focus and do what I love. I honestly enjoy trading and never thought I would be able to be in this position. But alas here I am and I am looking forward to growing with you all.
I try my best always and at all times to give sounds trading analysis simple and easy to understand. So please take everything I say understanding that I am still learning and I am trading on a paper trading account on here but my personal Trades with real money I am growing on the side and am not able to participate in the trades I post. Yes, I am still in the Army btw lol Hopefully when perform well in the next two years I will get out.
So yea back to bitcoin I posted this a while back Where the resistance was and eeesh didn't expect a fall like that Pero let's all please learn to respect resistance.
AS ALWAYS GODBLESS YOU ALL, I PRAY YOU ALL FIND JESUS, HE LOVES YOU AND HE IS ALWAYS THERE YOU ALL, HE DIED FOR YOUR SINS SO THAT YOU CAN BE FORGIVEN AND LIVE WITH HIM ETERNALLY IN HEAVEN. Although I don't know if there's trading in heaven but I guess we will see lol.

Bitcoin Charts Show Bearish Divergence SignalsIntroduction
OYO Finance reports that recent Bitcoin chart patterns indicate emerging bearish divergence across several key momentum indicators. After a sustained period of price appreciation, momentum oscillators have started to decouple from price action, signalling potential fatigue in the current trend. This divergence, observed on multiple timeframes, reflects growing caution among traders as the market enters a phase of reevaluation following weeks of heightened optimism.
The divergence phenomenon—where price continues to rise while underlying momentum weakens—often suggests that the pace of accumulation is slowing. Bitcoin’s recent inability to sustain higher highs with corresponding strength in volume and momentum further reinforces this technical signal. OYO Finance notes that while this does not guarantee immediate reversal, it typically precedes a transitional phase marked by reduced volatility and increased range-bound trading.
As global macroeconomic conditions continue to influence risk sentiment, the current chart structure underscores the interplay between technical exhaustion and investor prudence. The coming sessions may determine whether Bitcoin’s trajectory stabilises into consolidation or begins a more pronounced correction phase.
Technology & Innovation
OYO Finance employs an advanced analytical framework combining algorithmic interpretation, machine learning, and real-time market data integration to assess shifting dynamics within the cryptocurrency sector. Its proprietary systems are designed to capture multi-dimensional patterns such as momentum divergence, liquidity clustering, and sentiment variance—key factors that contribute to identifying early trend transitions.
At the core of this analytical infrastructure lies the Adaptive Market Signal Engine (AMSE), a model calibrated to detect subtle discrepancies between price behaviour and momentum indicators. The system evaluates cross-timeframe relationships between moving averages, volume-weighted metrics, and oscillatory signals to determine when directional energy begins to fade. This allows analysts to quantify divergence not as a binary event, but as a spectrum of weakening momentum conditions.
Complementing this analytical depth, OYO Finance's visualisation tools translate raw data into intuitive graphical overlays that highlight the divergence between trend strength and price movement. These tools facilitate a structured view of how market energy disperses over time, providing a clearer context for phases like the one currently unfolding in Bitcoin markets.
Artificial intelligence components within the platform continuously recalibrate the models based on new data inputs. This ensures that the analysis remains adaptive across varying volatility regimes and liquidity conditions. In the context of the present bearish divergence signals, the platform’s technology emphasises data objectivity—focusing on structural interpretation rather than speculative bias.
Growth & Adoption
Despite technical caution signs in Bitcoin, broader engagement within the digital asset ecosystem continues to expand. OYO Finance’s internal data suggests that institutional and retail participation remains consistent, reflecting the growing normalisation of cryptocurrency as an asset class even amid short-term technical uncertainty.
This sustained engagement underscores an important market evolution: traders are increasingly prioritising data analytics, risk calibration, and long-term strategy alignment over speculative momentum. The rise of analytical platforms and algorithm-driven tools—like those developed by OYO Finance—illustrates this shift toward more systematic decision-making.
The company continues to enhance its analytical capabilities to support scalability and precision. Its modular system design allows seamless integration of additional market datasets, ensuring that analytical depth expands alongside user demand. This infrastructure scalability is particularly relevant in volatile market environments, where real-time adaptability and accurate signal processing become essential.
Furthermore, the steady adoption of AI-based tools within the broader crypto market marks a step toward analytical maturity. As traders transition from reactive trading to structured analysis, the ecosystem becomes increasingly efficient and resilient. The current Bitcoin environment, characterised by divergence and moderation, serves as a practical example of how market participants now rely on structured insight rather than sentiment-driven impulses.
Transparency & Risk Management
Transparency and disciplined risk evaluation are fundamental to OYO Finance’s analytical philosophy. Each market insight is derived from verifiable data sources, ensuring that every conclusion can be traced to objective parameters. The platform’s risk management framework is designed to interpret volatility and liquidity data in real time, identifying when market conditions shift from stable to stress-prone zones.
In the current environment of divergence-driven uncertainty, OYO Finance’s systems emphasise balance between caution and context. The platform’s risk modules monitor cross-asset correlations, liquidity thresholds, and leverage imbalances, allowing for a nuanced understanding of potential systemic exposure. This approach ensures that analysis remains grounded in data integrity rather than speculative conjecture.
The firm’s transparency standards extend to its model-validation process. Every analytical module undergoes continuous testing under various market conditions to ensure accuracy and reliability. By maintaining such consistency, OYO Finance contributes to raising analytical benchmarks across the digital asset research landscape.
During periods of reduced directional momentum—like the current Bitcoin setup—risk frameworks become even more critical. By identifying early signs of behavioural shifts among participants, transparency and data discipline help mitigate the uncertainty often associated with technical indecision.
Industry Outlook
The broader cryptocurrency market reflects a similar tone of caution, with major assets showing signs of consolidation after months of directional activity. OYO Finance’s research suggests that this phase may serve as a structural reset rather than a negative shift. Divergence, in this context, can represent a natural pause within an ongoing market cycle—allowing liquidity to redistribute and sentiment to recalibrate before a renewed directional move occurs.
Macroeconomic conditions, including interest rate expectations, global liquidity trends, and capital flow adjustments, continue to shape the risk appetite for digital assets. Bitcoin’s sensitivity to these external factors remains pronounced, particularly as it increasingly correlates with broader financial instruments. This integration underscores its dual nature: both as a risk asset and as an emerging alternative store of value.
From a long-term perspective, divergence signals like the current one often highlight the maturing analytical landscape within digital assets. Rather than inciting panic, such signals are increasingly being used as checkpoints—moments where traders reassess structure and positioning within the broader cycle. The prevalence of algorithmic and AI-driven analysis across the industry demonstrates that the market is evolving toward greater precision, reducing overreaction to short-term technical events.
OYO Finance maintains that the present divergence phase is best interpreted as a reflection of equilibrium, not instability. Market participants are recalibrating expectations in line with evolving macroeconomic narratives and technical readjustments.
Closing Statement
As market conditions evolve, platforms that emphasize transparency and innovation will be closely watched by traders and investors alike.

IMPENDING FLASHCRASH !Hi everyone,
I didn't wanted to share this before,but i feel like i really want to give a warning of an impending flashcrash which will be the last low for a couple of years.
BUYING OPPORTUNITY! - NO FINANCIAL ADVICE BITSTAMP:BTCUSD
May the fortune favor the bold,
CYANE

Bitcoin Technical Setup Points to IndecisionIntroduction
Niagarahub observes that Bitcoin’s recent technical configuration reflects a phase of indecision as price movements narrow and volatility contracts across major trading sessions. The BTC/USD pair has stabilised within a tight range, suggesting that market participants are waiting for external cues before taking significant directional positions. Indicators such as momentum oscillators, volume flow, and short-term trendlines show neutral readings, highlighting a balance between buying and selling pressure.
This period of indecision follows several weeks of uneven sentiment in global risk markets, where fluctuating macroeconomic indicators have influenced trader behaviour. The compression of price volatility suggests that both bulls and bears are exercising caution, leading to consolidation around key support and resistance zones. Niagarahub’s analysis indicates that this environment may precede a broader breakout or continued range-bound trading, depending on the interaction between liquidity, sentiment, and cross-market conditions in the coming sessions.
Technology & Innovation
Niagarahub utilises a data-driven analytical infrastructure designed to interpret complex market behaviour through advanced algorithmic frameworks. The platform’s architecture integrates real-time analytics, AI-assisted pattern recognition, and deep learning algorithms that collectively assess price momentum, volatility cycles, and market depth.
At the core of this system is an adaptive modelling engine that evaluates multi-timeframe correlations between Bitcoin and macroeconomic variables such as equity performance, interest rate expectations, and currency dynamics. This AI model continuously recalibrates as market conditions evolve, producing high-resolution assessments of trend strength and directional bias.
The platform’s analytical modules also incorporate sentiment mapping tools that parse market positioning data, liquidity heatmaps, and exchange order flow to detect imbalances in market behaviour. By correlating these factors, Niagarahub identifies whether periods of consolidation—like the current Bitcoin setup—are driven by genuine equilibrium or a temporary pause in directional intent.
Additionally, Niagarahub’s visualisation suite translates complex data patterns into intuitive metrics, providing structured overviews of momentum shifts and trend fatigue. Through these innovations, the platform bridges human interpretation with machine precision, allowing for consistent evaluation of technical setups in volatile or uncertain conditions.
This commitment to algorithmic transparency and adaptive intelligence reflects Niagarahub’s approach to market analysis—leveraging technology to interpret uncertainty, not to predict it. The platform’s goal remains focused on improving clarity in data presentation, enabling objective insights during phases where traditional indicators offer mixed signals.
Growth & Adoption
While Bitcoin’s technical landscape shows hesitation, engagement across the broader digital asset ecosystem continues to evolve. Niagarahub notes that user participation within analytical and infrastructure-driven platforms remains consistent, even as market volatility decreases. This suggests that participants are prioritising data accuracy and strategic positioning over speculative momentum.
The shift toward measured, research-based trading behaviour marks a significant step in the maturing cryptocurrency market. Niagarahub’s user analytics indicate that demand for institutional-grade tools—especially those integrating AI-driven insights and cross-asset comparisons—has expanded steadily. This pattern aligns with the wider adoption of systematic trading and algorithmic decision-making among both professional and retail users.
Scalability remains a cornerstone of Niagarahub’s design. Its modular infrastructure allows for seamless integration of additional datasets and analytical models without compromising performance. As digital assets continue to interconnect with traditional financial systems, this flexibility ensures that the platform remains capable of adapting to new market realities and regulatory frameworks.
Moreover, as the global trading landscape becomes increasingly data-centric, Niagarahub’s emphasis on scalable analytics and dynamic modelling places it in alignment with emerging standards of precision and accountability. Even in neutral or indecisive markets, consistent access to structured analysis remains essential for long-term adoption and trust within the ecosystem.
Transparency & Risk Management
Transparency and disciplined risk management form the foundation of Niagarahub’s operational philosophy. The platform’s analytical framework is built to ensure that every data interpretation can be traced back to verifiable sources and objective parameters. This transparency allows users and analysts to understand the basis of each insight rather than relying on opaque or speculative signals.
Niagarahub’s risk management systems continuously monitor liquidity fragmentation, volatility clusters, and systemic exposure levels across both crypto and traditional markets. During phases of uncertainty—such as Bitcoin’s current sideways movement—these systems assess how shifts in leverage, correlation, and sentiment might affect short-term risk.
The firm’s quantitative models incorporate scenario analysis to evaluate potential outcomes under varying volatility regimes. This proactive structure supports preparedness without reliance on prediction, aligning with professional risk management standards. By emphasising measured observation over reactionary adjustments, Niagarahub ensures analytical consistency even when sentiment fluctuates sharply.
Through its transparency-first approach, the platform fosters accountability and trust across the analytical process. Every output undergoes validation and contextual review, reinforcing the reliability of data during times when market signals conflict or appear directionless.
Industry Outlook
The broader cryptocurrency market currently mirrors Bitcoin’s technical indecision, reflecting a period of consolidation across major assets. After an extended stretch of heightened volatility and directional swings, global markets appear to be stabilising in response to macroeconomic recalibration. Niagarahub’s research identifies this as a mid-cycle normalisation, where liquidity, risk exposure, and sentiment reach a temporary balance before renewed activity resumes.
Across the industry, emphasis continues to shift toward infrastructure, data quality, and analytical precision. Platforms that can bridge traditional and digital asset insights are increasingly shaping market understanding. While Bitcoin’s current structure may seem directionless, it also signifies structural maturity—an ability to sustain equilibrium rather than react impulsively to short-term catalysts.
Historically, such consolidation phases have provided the groundwork for subsequent expansion once external catalysts—such as policy signals or capital flow adjustments—reemerge. In this context, indecision is not a weakness but a necessary recalibration that reinforces market depth and resilience.
Niagarahub’s ongoing analysis suggests that the coming sessions will remain defined by moderation rather than momentum, with traders closely monitoring macroeconomic developments for cues. The correlation between global asset flows and crypto performance is expected to continue guiding sentiment, underscoring Bitcoin’s integration within the broader financial narrative.
Closing Statement
As market conditions evolve, platforms that emphasize transparency and innovation will be closely watched by traders and investors alike.

BTC/USD Awaits Direction From Global MarketsIntroduction
Global Trustnet reports that the BTC/USD pair is currently in a phase of directional hesitation, reflecting uncertainty across broader financial markets. Following a sequence of modest gains and retracements, Bitcoin’s price has stabilised within a narrow range, signalling a lack of immediate conviction among traders. Market participants appear to be awaiting clearer cues from macroeconomic developments and global liquidity conditions before committing to renewed momentum.
This indecisive structure aligns with a broader cross-asset pause driven by mixed signals from equities, commodities, and foreign exchange markets. Bitcoin’s sensitivity to global risk sentiment has remained elevated, with price behaviour reflecting the oscillation between optimism over long-term adoption and caution amid tightening financial conditions. Global Trustnet’s analysis suggests that the current balance represents an adjustment period rather than a structural breakdown—a consolidation phase that often precedes a redefined market direction.
Technology & Innovation
Global Trustnet’s analytical infrastructure integrates advanced algorithmic tools and artificial intelligence to interpret evolving price behaviour across correlated assets. The platform’s architecture is built to process real-time data from global exchanges, deriving insights from both microstructure analytics and broader macroeconomic signals. Its models are designed to evaluate market sentiment through quantitative clarity rather than speculative inference.
At the foundation of this system is a predictive analytics engine that tracks momentum divergence and volatility compression. By analysing liquidity depth, order flow symmetry, and correlation patterns between Bitcoin and key macro assets such as equity indices and the U.S. dollar, the system contextualises short-term neutrality within a larger framework of global capital rotation.
The AI layer functions through a continuous feedback mechanism, recalibrating weightings as new data flows in. This allows the engine to dynamically assess how changes in global monetary policy, commodity flows, or investor sentiment translate into actionable insights for the BTC/USD pair. The goal is not to forecast price direction but to understand the underlying structure of uncertainty—how market positioning adjusts when external catalysts remain undefined.
Visualisation tools within the Global Trustnet ecosystem translate these analytics into multi-dimensional dashboards. Users can observe liquidity clusters, volatility zones, and sentiment gradients in real time, giving a structured view of Bitcoin’s relative stability amid global market indecision. This design philosophy underscores the firm’s emphasis on transparency and accessibility of complex data, reinforcing its analytical neutrality even during uncertain market periods.
Growth & Adoption
Despite the temporary slowdown in Bitcoin’s directional momentum, the digital asset ecosystem continues to expand in depth and sophistication. Global Trustnet’s adoption metrics indicate steady engagement across both institutional and retail sectors, highlighting a growing reliance on structured analytics over speculative behaviour.
Participation trends show that traders are increasingly turning to systematic approaches as volatility compresses. The shift from reactive trading to data-driven analysis reflects the maturation of the digital asset space, where decision-making is now guided more by metrics and market structure than short-term sentiment. This evolution aligns with Global Trustnet’s own expansion strategy—focusing on modular scalability and adaptability across multiple asset environments.
The platform’s design allows seamless integration of additional datasets, including derivatives analytics, cross-exchange liquidity mapping, and macroeconomic overlays. This scalability ensures that the analytical depth remains consistent even as global participation grows. It also allows users to navigate periods of reduced volatility—like the current BTC/USD consolidation—with the same level of clarity and precision afforded during high-momentum environments.
The broader adoption of advanced analytics within the crypto sector suggests a long-term structural shift toward efficiency and accountability. As markets mature, tools that can interpret interconnectedness between digital and traditional assets will continue to gain importance. Global Trustnet’s infrastructure stands positioned within this evolution, bridging data from multiple sectors to create a unified perspective on global market behaviour.
Transparency & Risk Management
Transparency remains at the core of Global Trustnet’s analytical philosophy. Each data-driven insight is derived from verifiable market inputs, ensuring that all interpretations can be traced to quantitative foundations. The platform’s transparency framework extends beyond analytics, incorporating risk management and validation systems that continually monitor for anomalies in liquidity, volatility, and cross-asset correlation.
Risk assessment models within Global Trustnet are adaptive in nature. They continuously evaluate how shifting macroeconomic factors—such as monetary policy expectations, inflation data, or geopolitical developments—impact liquidity positioning within Bitcoin markets. This real-time adaptability ensures that assessments remain current even as market drivers evolve.
The firm’s internal risk mapping tools provide granular insights into market stress points by quantifying potential exposure to systemic shocks. During periods of indecision, such as the current BTC/USD setup, the ability to identify latent vulnerabilities in liquidity or sentiment becomes crucial. By doing so, the platform fosters disciplined risk interpretation without resorting to directional speculation.
Global Trustnet’s methodology emphasises transparency through accountability: every metric visualisation and output is designed for reproducibility. This consistency supports professional-grade analysis across a wide spectrum of participants, aligning with institutional expectations for data integrity and operational rigour.
Industry Outlook
Bitcoin’s current trading posture reflects the broader equilibrium phase that often follows extended directional runs. Global Trustnet’s analysis indicates that while short-term volatility has decreased, the underlying market infrastructure remains resilient. Transaction volumes, network participation, and institutional involvement continue to display long-term stability, underscoring that the current pause represents a recalibration rather than a retrenchment.
The global macroeconomic backdrop continues to exert influence on digital asset dynamics. Shifts in interest rate expectations, inflation trends, and capital flows between risk and defensive assets have collectively shaped the tone of the market. BTC/USD’s present behaviour mirrors a waiting period—a phase where traders seek clarity from central bank policy direction and macroeconomic stability before initiating the next leg of movement.
Historically, such periods of compression have preceded renewed momentum, as equilibrium zones serve to absorb excess leverage and rebalance liquidity. The digital asset sector’s increasing correlation with traditional markets reinforces this cycle, linking Bitcoin’s price structure more closely to global sentiment and policy cues.
Global Trustnet’s position remains that long-term digital asset adoption continues to deepen beneath the surface of short-term uncertainty. The interplay between stability and expansion characterises this stage of market evolution—one where structural improvements outweigh immediate price fluctuation.
Closing Statement
As market conditions evolve, platforms that emphasize transparency and innovation will be closely watched by traders and investors alike.

Bitcoin Momentum Indicators Show UncertaintyIntroduction
Crown Point Capital reports that current Bitcoin momentum indicators reveal a state of indecision among market participants. After several sessions of directional volatility, price action has settled into a zone marked by diminishing follow-through and fragmented sentiment. The fading strength in short-term momentum indicators such as relative strength and directional oscillators underscores a period of consolidation rather than outright reversal.
This moderation comes as traders assess broader market variables, including macroeconomic signals and liquidity flows across digital assets. The compression in volatility and narrowing of intraday ranges suggest that conviction remains limited on both sides of the market. Crown Point Capital’s analysis interprets this as a transitional phase where price equilibrium precedes structural redefinition—an environment often observed before volatility expansion resumes.
As momentum wanes, Bitcoin’s near-term structure reflects an increasingly balanced state between buyers and sellers. This equilibrium has the potential to recalibrate risk profiles across the crypto sector, emphasising observation over speculation until directional clarity emerges.
Technology & Innovation
Crown Point Capital employs a data-centric analytical infrastructure designed to interpret market dynamics through quantitative precision. Its proprietary algorithmic framework integrates real-time market data, machine learning analytics, and volatility diagnostics to capture evolving momentum patterns. The system tracks order flow velocity, liquidity clustering, and price correlation shifts—factors that collectively define the subtleties of market sentiment.
At the core of this framework lies the Momentum Divergence Engine, a module built to detect variations between price action and indicator behaviour. This divergence mapping allows analysts to identify when apparent strength lacks underlying confirmation, a signal often preceding slowdown or consolidation phases like the current one.
Artificial intelligence models within Crown Point Capital’s architecture process continuously feed data from multiple exchanges, refining predictive metrics without introducing directional bias. The goal is not to forecast outcomes, but to contextualise probability structures—clarifying whether momentum patterns support continuation or caution.
Visualisation tools complement this analysis, translating numerical complexity into intuitive interfaces. Heatmaps of liquidity depth, sentiment oscillation, and volatility gradients provide a layered understanding of how energy shifts across different timeframes. This design approach reflects Crown Point Capital’s broader technological philosophy: accuracy through transparency and interpretation through simplicity.
By leveraging these algorithmic and AI components, the firm transforms raw data into structured insights, giving traders and analysts an objective lens through which to view current uncertainty in Bitcoin’s momentum landscape.
Growth & Adoption
While Bitcoin’s short-term technicals reflect hesitation, broader adoption trends in the digital asset ecosystem remain resilient. Crown Point Capital’s internal monitoring highlights that participation among institutional and retail segments has stabilised even as volatility declines. This suggests that engagement within the market is maturing—traders and investors are increasingly focusing on strategic positioning rather than reactive speculation.
The platform continues to observe a steady increase in the use of analytics-driven decision frameworks. This behaviour points to a shift toward sophistication in how participants approach market opportunities, with emphasis on data reliability and cross-asset insight. As volatility compresses, the reliance on structured analytics grows, enabling participants to adapt to calmer trading conditions without loss of engagement.
Crown Point Capital’s system scalability supports this transition. Its modular design architecture allows for the integration of new datasets and computational models, maintaining analytical consistency even as market scope expands. This scalability ensures that as the digital economy evolves—introducing new asset classes, liquidity instruments, and correlation networks—analytical depth remains intact.
Such steady adoption within analytical ecosystems aligns with the natural maturation of the digital asset market. As speculative extremes recede, the emphasis shifts toward infrastructure, governance, and measurable performance. For Crown Point Capital, this phase underscores the industry’s broader evolution from experimentation toward structural legitimacy and operational endurance.
Transparency & Risk Management
Transparency and disciplined risk management form the foundation of Crown Point Capital’s analytical approach. Every output generated by the firm’s system is traceable to a defined data source and methodological pathway. This verifiability ensures that analysis remains objective and reproducible, fostering consistency across varying market conditions.
Risk management processes are embedded within every analytical layer. The firm’s volatility assessment modules continuously monitor liquidity shifts, correlation divergences, and leverage concentrations to anticipate structural vulnerabilities. During periods of momentum uncertainty, such as the current Bitcoin phase, these tools are particularly valuable for identifying potential zones of imbalance before they materialise into price dislocations.
Crown Point Capital’s data-driven methodology emphasises proportional response to market risk rather than reactionary adjustments. The framework evaluates not only market volatility but also contextual factors like sentiment stability and order book density, offering a comprehensive understanding of potential exposure.
This disciplined approach aligns with institutional standards of analytical transparency and accountability. By maintaining methodological integrity and measurable outputs, Crown Point Capital contributes to a more informed and resilient trading environment across the broader digital asset market.
Industry Outlook
The wider cryptocurrency landscape mirrors Bitcoin’s current sentiment—measured, cautious, and introspective. As macroeconomic indicators remain mixed, risk assets across sectors are experiencing reduced directional momentum. Crown Point Capital’s research indicates that such equilibrium phases are not uncommon during mid-cycle adjustments. They serve as natural pauses that allow liquidity to consolidate and sentiment to reset before renewed market direction emerges.
Historically, momentum slowdowns have acted as structural stabilisers, correcting overextended trends and realigning expectations. In this context, the current moderation in Bitcoin’s performance represents a constructive cooling rather than deterioration. The recalibration of momentum indicators often precedes the establishment of more sustainable trajectories, particularly when underlying adoption metrics remain firm.
Across the digital asset sector, the focus has shifted toward building infrastructural and analytical robustness. Data standardisation, exchange transparency, and improved custody mechanisms are gradually reinforcing investor confidence. While near-term uncertainty persists, the structural foundations of the ecosystem continue to mature—a development that bodes well for long-term market evolution.
Crown Point Capital’s ongoing analysis suggests that clarity will likely re-emerge once external variables, including liquidity policy and macroeconomic signals, align with internal market dynamics. Until then, the emphasis remains on observation, data validation, and structural patience.
Closing Statement
As market conditions evolve, platforms that emphasize transparency and innovation will be closely watched by traders and investors alike.

BTC/USD Remains Neutral With Sideways BiasIntroduction
BridgeHold reports that the BTC/USD pair continues to trade within a neutral range, reflecting an ongoing phase of consolidation in the broader cryptocurrency market. After a series of volatile sessions earlier in the quarter, recent price action suggests that Bitcoin is stabilizing between key technical levels as market participants await clearer macroeconomic signals. This sideways behaviour reflects equilibrium between short-term bullish optimism and longer-term caution over liquidity, regulation, and global risk appetite.
The neutrality of the BTC/USD structure underlines a market in transition—neither strongly directional nor decisively reversed. BridgeHold’s analysis focuses on how algorithmic frameworks and data-driven insights can contextualize this phase, identifying potential inflection zones that may shape upcoming momentum.
Technology & Innovation
BridgeHold applies a structured combination of algorithmic analytics, pattern recognition, and AI-driven forecasting to assess BTC/USD movements with precision. Its proprietary models are designed to detect trend exhaustion and volatility compression, two critical indicators during neutral phases. By integrating multi-timeframe data—spanning intraday oscillations to weekly momentum readings—the platform isolates technical thresholds that often precede a breakout or reversal.
Machine learning components within BridgeHold’s system continuously recalibrate based on live liquidity metrics, order-book depth, and funding rate anomalies. This adaptability allows the algorithms to evolve alongside shifting market conditions, refining accuracy as new data emerges. Instead of relying on single-indicator signals, BridgeHold’s analytical suite merges structural chart patterns with volume-weighted metrics, ensuring a holistic view of BTC/USD behaviour.
The platform’s innovation also extends to modular visualization tools, enabling traders to examine volatility clusters and sentiment alignment in real time. Through AI-enhanced backtesting, users can contextualize neutral markets historically—assessing how similar consolidation periods have resolved under comparable conditions of liquidity and macro pressure. This focus on data integrity and adaptive intelligence positions BridgeHold as a reference point for technical objectivity in crypto market analysis.
Growth & Adoption
BridgeHold’s analytics ecosystem continues to evolve alongside broader cryptocurrency adoption trends. The neutral BTC/USD landscape has encouraged a more analytical approach among traders, favouring structured data interpretation over speculative momentum. This aligns with BridgeHold’s growth strategy, which prioritizes clarity, consistency, and institutional-grade insight delivery over reactive trading.
The platform’s expanding user base reflects a shift in market behaviour toward systems that integrate risk-adjusted forecasting. BridgeHold has observed increased engagement from participants seeking to contextualize market phases like the current sideways bias, where emotional trading gives way to strategy optimization.
Internally, BridgeHold’s architecture supports scaling through layered cloud-based processing, enabling real-time computation across high-frequency data streams. This technical scalability ensures that platform performance remains stable, even during market congestion or news-driven volatility. Its modular analytics engine can support additional asset pairs, allowing the system to expand dynamically without compromising speed or analytical depth.
As more institutions and algorithmic funds explore diversified exposure to digital assets, BridgeHold’s data framework serves as a foundation for systematic research and quantitative model validation. The emphasis on precision rather than prediction has allowed the platform to grow organically within both retail and professional trading environments.
Transparency & Risk Management
A neutral BTC/USD phase amplifies the importance of risk discipline, as compressed ranges can precede significant volatility expansions. BridgeHold’s analytical ethos is built around transparency—ensuring that users understand the underlying logic of each model output. Each analytical layer within the platform provides visibility into data sources, weightings, and bias adjustments, allowing traders to interpret results independently rather than relying on opaque algorithmic assumptions.
BridgeHold’s risk assessment modules are designed to quantify exposure under multiple volatility regimes. These include probabilistic drawdown projections, cross-pair correlation tracking, and liquidity stress testing under simulated market shocks. By emphasizing pre-trade evaluation, the system encourages users to frame positions through a risk-to-reward perspective rather than directional bias.
Transparency extends beyond analytics to methodology disclosure. BridgeHold maintains an open documentation structure where model updates and parameter adjustments are logged systematically, allowing for traceability and performance review. This reinforces user trust and ensures analytical consistency even during structural recalibrations.
Such disciplined transparency has proven crucial during periods of market neutrality—where overconfidence and impatience often lead to unnecessary exposure. BridgeHold’s commitment to accountability and systematic evaluation aims to help users maintain objectivity during phases when the absence of direction can be as informative as movement itself.
Industry Outlook
The broader cryptocurrency market currently mirrors the consolidation observed in BTC/USD, as investors digest shifting monetary policy expectations and evolving global liquidity conditions. While short-term trading volumes have moderated, long-term structural adoption continues, supported by advances in exchange infrastructure, regulatory clarity, and technological innovation.
BridgeHold’s analysis situates the current BTC/USD neutrality within a cyclical framework. Historically, extended consolidation phases have often preceded directional expansions aligned with broader macro catalysts—such as monetary easing, technological upgrades, or regulatory developments. The platform’s adaptive systems are designed to monitor these triggers, identifying the intersection between fundamental drivers and technical setups.
Industry sentiment remains cautiously constructive. While reduced volatility may dampen speculative enthusiasm, it also provides a foundation for institutional accumulation and infrastructural maturity. Platforms emphasizing transparent analytics and disciplined methodology—such as BridgeHold—are likely to remain central to this evolving environment, as data-centric decision frameworks gain precedence over sentiment-driven speculation.
Closing Statement
As market conditions evolve, platforms that emphasize transparency and innovation will be closely watched by traders and investors alike.

Bitcoin Struggles to Extend Recent MomentumIntroduction
MetaQuora observes that Bitcoin’s recent price movement has entered a period of consolidation following several sessions of upward attempts that failed to establish sustained traction. The asset’s inability to extend momentum beyond key resistance levels highlights a temporary stall in directional conviction, with both buyers and sellers demonstrating restraint. This phase reflects an environment characterized by cautious sentiment and low follow-through—factors often seen during transitional stages between trend continuation and correction.
Despite maintaining a generally positive structure on higher timeframes, Bitcoin’s short-term chart activity indicates that the market is seeking equilibrium. Declining trade volumes and neutralized momentum oscillators suggest that speculative enthusiasm has cooled after prior gains. MetaQuora’s analysis points to a technically balanced setup—where near-term consolidation could either evolve into renewed accumulation or a retest of lower supports, depending on macro drivers and liquidity inflows.
Technology & Innovation
MetaQuora’s proprietary analytics systems employ advanced AI frameworks and algorithmic analysis tools to interpret evolving market structures with precision. These systems process multi-layered datasets—ranging from real-time order flow to sentiment-weighted metrics—to map subtle shifts in momentum before they manifest in price. The platform’s technology is designed to identify fatigue in directional strength, such as the current slowdown in Bitcoin’s rally attempts.
At the core of MetaQuora’s architecture lies an adaptive inference model that continuously recalibrates analytical weightings based on volatility behaviour and liquidity density. By cross-referencing historical analogs with current order book activity, the model highlights potential inflection zones where market energy either dissipates or re-accumulates. This capability provides a structured understanding of why momentum weakens at certain thresholds, offering analytical clarity amid uncertain market dynamics.
Complementing these systems is the MetaQuora Visualization Engine—a framework that transforms complex data inputs into intuitive heatmaps, trend gradients, and liquidity overlays. These visualization tools enhance interpretation by showing how clusters of market activity evolve around key levels, revealing hidden areas of supply absorption or demand exhaustion.
This integration of AI and market structure analytics reflects MetaQuora’s focus on precision and transparency in technical interpretation. The platform’s design philosophy centers on delivering actionable neutrality—information distilled from data, without narrative bias—enabling traders and analysts to view market phases such as Bitcoin’s current slowdown through an objective, evidence-based lens.
Growth & Adoption
While Bitcoin’s price behaviour signals consolidation, overall participation across digital asset platforms remains steady. MetaQuora notes that investor engagement patterns have shifted toward analytical observation rather than aggressive position building. This change suggests a maturing market dynamic, where traders prioritize structural insights and measured allocation over short-term speculation.
MetaQuora’s internal data shows consistent engagement from institutional and retail segments utilizing analytical dashboards and volatility monitors during periods of reduced price activity. The stabilization in adoption metrics underscores that the slowdown in momentum has not diminished market interest but has, instead, encouraged deeper strategic planning.
Scalability continues to be a central aspect of MetaQuora’s operational design. The platform supports continuous integration of new data sources and analytical modules, allowing it to accommodate rising user demand without latency degradation. As trading ecosystems evolve, this adaptability ensures that users retain access to high-speed, high-fidelity analytics across a widening range of asset classes.
The broader adoption of such data-driven methodologies reflects a shift in market behaviour: participants increasingly depend on analytical validation rather than sentiment-driven impulses. This evolution mirrors the growing maturity of digital asset markets, where informed decision-making and transparency form the foundation of sustainable growth.
Transparency & Risk Management
Transparency and disciplined risk assessment form the cornerstone of MetaQuora’s operational and analytical philosophy. Every market output is traceable to verified data, ensuring analytical consistency across all models. The platform’s risk management systems integrate volatility tracking, cross-asset correlation monitoring, and liquidity mapping to evaluate the health of trading environments during both expansion and contraction phases.
In the context of Bitcoin’s current indecisive structure, MetaQuora’s models emphasize the importance of differentiating between temporary momentum pauses and structural trend reversals. By analyzing intraday liquidity fragmentation and delta imbalances between spot and derivative markets, the system identifies whether price deceleration stems from natural exhaustion or emergent risk factors.
The firm’s transparency framework ensures that conclusions drawn from these assessments remain accessible for verification, reinforcing accountability in analytical interpretation. This structured, data-led approach reduces ambiguity and aligns with professional trading standards, prioritizing clarity and discipline in volatile market contexts.
Through consistent refinement of its AI and risk systems, MetaQuora maintains analytical equilibrium across varying market cycles. The goal is not to forecast price direction but to measure the integrity of market structures—an approach that supports long-term confidence in analysis, even amid short-term uncertainty.
Industry Outlook
From a broader perspective, Bitcoin’s current consolidation phase aligns with cyclical market behaviour observed in prior years. Following strong directional moves, periods of diminished momentum often act as cooling stages where liquidity redistributes and sentiment resets. These intervals, though less dynamic, are essential in sustaining structural stability across the digital asset ecosystem.
MetaQuora’s broader research indicates that this pattern of decelerating momentum is mirrored across correlated assets. As macroeconomic variables—such as interest rate expectations and liquidity cycles—continue to influence crypto sentiment, Bitcoin’s equilibrium zone may persist until clearer external signals emerge. This environment of restraint often precedes renewed volatility once consensus develops around directional bias.
The broader industry continues to demonstrate resilience through diversification of infrastructure and analytic depth. Platforms and participants increasingly emphasize long-term sustainability, transparency, and data integrity over speculative excess. Bitcoin’s temporary struggle to extend recent momentum, therefore, reflects a constructive recalibration rather than deterioration—a process that can ultimately strengthen structural coherence within the market.
Closing Statement
As market conditions evolve, platforms that emphasize transparency and innovation will be closely watched by traders and investors alike.

BTC/USD Bears Lose Momentum in Sideways MarketIntroduction
GoldNX reports that the BTC/USD pair has entered a consolidation phase as bearish momentum begins to wane amid a neutral trading environment. Following a period of sustained downward pressure, recent data shows a clear slowdown in selling intensity, with price action stabilizing around mid-range levels. The compression of volatility and reduction in directional bias suggest that market participants are recalibrating exposure while awaiting fresh catalysts.
This moderation reflects a broader equilibrium in sentiment. The absence of decisive follow-through from bears indicates exhaustion within short-term trends, while bulls remain cautious amid macroeconomic uncertainties. As liquidity distribution flattens across key technical zones, the BTC/USD structure points to a standoff that could define the coming sessions. GoldNX’s analysis notes that this sideways configuration represents a crucial inflection point—either a prelude to renewed volatility or an extended period of consolidation before larger structural moves emerge.
Technology & Innovation
GoldNX leverages a proprietary analytics framework designed to interpret the subtleties of shifting market momentum. The platform integrates real-time data aggregation with algorithmic signal analysis, providing a multi-dimensional view of order flow, sentiment divergence, and trend persistence. Its AI-powered modules process high-frequency data to identify moments where momentum decays, such as the current BTC/USD setup, in which price compression indicates fading bearish dominance.
At the core of this system is an adaptive signal-mapping engine. This mechanism continuously recalibrates based on recent volatility readings, liquidity conditions, and trend velocity. By combining quantitative measures—such as average directional index (ADX) decay, range equilibrium detection, and cross-timeframe confluence—the system isolates early signs of momentum loss before they are visible on conventional indicators.
GoldNX’s analytics suite emphasizes interpretability alongside precision. Visual models highlight cluster formations, imbalance levels, and momentum fractures in real time, enabling a structured understanding of how directional energy shifts within market cycles. These insights allow analysts to distinguish between temporary pauses and deeper structural rebalancing.
The platform’s commitment to technological refinement ensures its algorithms evolve alongside market behavior. By training models on diverse volatility regimes and liquidity patterns, GoldNX maintains analytical reliability across both trending and range-bound environments. The outcome is a data-driven lens that prioritizes clarity over prediction, aligning with the firm’s analytical philosophy of objective observation.
Growth & Adoption
The slowdown in Bitcoin’s directional pace coincides with a steady expansion in analytical engagement across trading platforms. GoldNX notes that market participants increasingly adopt systematic approaches over impulse-driven activity, emphasizing structured data interpretation as volatility normalizes. This trend reflects the sector’s maturation, where stability encourages deeper reliance on analytics rather than speculative reaction.
User adoption metrics within GoldNX’s analytical ecosystem demonstrate consistent growth, driven by demand for contextual understanding rather than directional bias. The current market phase has encouraged traders and institutions to focus on identifying equilibrium conditions, assessing risk exposure, and mapping potential volatility clusters. These behavioral shifts signify the evolution of market participation from short-term speculation toward disciplined, data-informed engagement.
GoldNX’s infrastructure supports seamless scalability to accommodate rising data loads without latency loss. Its modular design allows integration of additional analytic frameworks and external data sources while preserving computational accuracy. This adaptability ensures the platform remains aligned with the evolving needs of traders and analysts operating across multi-asset environments.
The broader growth narrative within the digital asset space reinforces this trajectory. As liquidity pools deepen and market participation diversifies, analytical platforms emphasizing real-time transparency and precision analytics are increasingly central to informed decision-making. GoldNX continues to align its growth model with this structural shift toward methodical, evidence-based trading behavior.
Transparency & Risk Management
Transparency remains fundamental to GoldNX’s analytical and operational structure. All data interpretations derive from verifiable market inputs, ensuring that every conclusion is supported by quantifiable evidence rather than conjecture. This methodological transparency reinforces accountability and consistency—qualities essential in the rapidly evolving digital asset landscape.
The platform’s risk management framework operates through a multi-tiered monitoring system designed to detect volatility anomalies, liquidity fragmentation, and correlation breakdowns. During sideways markets such as the current BTC/USD phase, the ability to differentiate between technical compression and latent volatility buildup becomes critical. GoldNX’s risk models track these shifts in real time, adjusting analytical weightings to maintain balanced assessments.
By quantifying exposure metrics and volatility potential, the platform helps identify zones of structural vulnerability before they escalate into broader risk events. The objective is not to predict direction but to maintain situational awareness—ensuring that risk remains proportional to observed market dynamics.
This disciplined approach to data interpretation aligns with professional trading standards, emphasizing neutral analysis over speculative inference. As markets fluctuate between trend and consolidation, GoldNX’s risk architecture ensures continuity of insight without compromising transparency or analytical integrity.
Industry Outlook
From a broader perspective, the recent slowdown in bearish momentum within BTC/USD underscores the cyclical rhythm of digital asset markets. Historical patterns show that periods of range-bound movement often follow intense directional phases, allowing liquidity to redistribute and sentiment to recalibrate. These transitional structures typically serve as consolidation stages that precede either renewed continuation or reversal, depending on external catalysts such as macroeconomic data or capital flow realignment.
Across the wider crypto landscape, stability is emerging as a defining characteristic of mid-cycle behavior. Market participants appear increasingly data-oriented, emphasizing precision and structure in both execution and strategy formation. GoldNX notes that such developments strengthen the long-term resilience of the ecosystem by reducing reactionary volatility and fostering more consistent market depth.
While the current BTC/USD pattern may appear indecisive, it reflects an underlying stabilization process—one that balances speculative fatigue with long-term accumulation behavior. This equilibrium state, though neutral in the short term, contributes to the maturation of digital asset markets and the refinement of analytical frameworks supporting them.
Closing Statement
As market conditions evolve, platforms that emphasize transparency and innovation will be closely watched by traders and investors alike.

Bitcoin Market Shows Indecision Among TradersIntroduction
Imperial Assets observes that Bitcoin’s recent trading behaviour reflects a state of indecision among market participants. After weeks of directional volatility, current data reveals fragmented sentiment, with traders divided between optimism for a breakout and caution over potential downside continuation. This balance of uncertainty has translated into a tightening range across key price levels, suggesting that market conviction remains muted.
From a technical standpoint, price action has shifted toward equilibrium. Trading volumes have stabilised, volatility indices have compressed, and momentum oscillators indicate neutral bias. Such a pattern is characteristic of markets transitioning between phases—often signalling that participants are waiting for new macro or liquidity cues before committing to stronger directional exposure. Imperial Assets notes that this indecisive period may serve as a foundation for the next significant trend once broader alignment emerges across global risk assets.
Technology & Innovation
Imperial Assets employs an advanced analytical infrastructure designed to interpret complex market structures with precision. The platform integrates algorithmic intelligence, real-time data aggregation, and adaptive learning models that continuously adjust to evolving market conditions. Through this framework, the system detects sentiment divergence, liquidity clustering, and volume displacement patterns—key indicators often preceding significant directional changes.
The technology underpinning Imperial Assets prioritises neutral observation over predictive bias. Its AI modules operate through an ensemble of models that evaluate order flow consistency, cross-exchange depth, and momentum persistence. By combining these layers, the platform identifies inflexion points where trader sentiment transitions from confidence to hesitation. This capacity to quantify uncertainty allows for a clearer understanding of equilibrium zones, particularly when markets exhibit mixed conviction as seen in the current Bitcoin landscape.
The platform’s data visualisation suite enhances interpretability by transforming high-frequency data into contextual insights. Heatmaps, correlation matrices, and volatility overlays enable users to discern structural shifts that may otherwise remain hidden within raw data streams. In the present environment, such analytical transparency has proven valuable for interpreting how conflicting strategies—ranging from short-term arbitrage to long-term accumulation—coexist within the same range-bound market phase.
Imperial Assets continues to refine its algorithmic models to adapt to multi-asset volatility behaviour. These refinements ensure consistency of output during fluctuating liquidity cycles, aligning with the firm’s broader objective of providing clarity in complex market environments.
Growth & Adoption
Despite the indecision characterising current Bitcoin trading, adoption trends across digital asset platforms remain stable. Imperial Assets highlights that steady engagement across institutional and retail segments suggests an underlying resilience within the broader market ecosystem. While speculative activity has cooled compared to high-volatility periods, sustained participation reflects a maturing approach among investors seeking structured exposure over impulsive trading.
The moderation in activity has also encouraged expansion into data-driven strategies. Users increasingly rely on analytics and automation tools to guide portfolio adjustments rather than reactive decision-making. Imperial Assets’ analytics modules have seen consistent utilisation across diverse trading profiles, suggesting that the ecosystem is evolving toward greater sophistication and operational discipline.
Scalability remains a cornerstone of Imperial Assets’ design philosophy. Its architecture supports modular expansion, enabling integration of new data sources and analytical modules without compromising speed or accuracy. This scalability ensures that as adoption widens and market participation diversifies, the system maintains the computational integrity necessary to process high-frequency data across multiple assets simultaneously.
Furthermore, as the digital asset space grows more competitive, platforms emphasising reliability and analytical depth have emerged as central to informed trading infrastructure. Imperial Assets’ focus on precision, scalability, and transparency reinforces its positioning as a platform built for evolving market conditions rather than momentary cycles of speculation.
Transparency & Risk Management
Transparency forms the backbone of Imperial Assets’ operational ethos. Each analytical output is derived from verifiable data, allowing users to trace the origin and rationale of every insight. This methodology minimises ambiguity, fostering greater confidence in the interpretation of complex market patterns.
The platform’s risk management systems are built around the principle of adaptive resilience. Rather than relying on static parameters, the models dynamically adjust exposure frameworks based on volatility shifts, liquidity compression, and correlation realignments. This ensures that risk identification remains timely and proportionate to prevailing market structures.
In the context of Bitcoin’s current indecision phase, risk assessment becomes particularly critical. Fluctuating trader sentiment and uneven liquidity distribution can trigger abrupt yet short-lived breakouts. By continuously monitoring momentum divergence and transaction clustering, Imperial Assets’ models help contextualise whether emerging moves are sustainable or temporary liquidity dislocations.
The transparency in this process aligns with professional trading standards, emphasising consistency and accountability in data-driven interpretation. By maintaining a disciplined and verifiable approach, Imperial Assets contributes to the establishment of higher analytical standards across the digital asset landscape.
Industry Outlook
The broader cryptocurrency market currently reflects a balance between stability and hesitation. While macroeconomic conditions have influenced sentiment across risk assets, Bitcoin’s technical framework appears to be stabilising rather than deteriorating. Historical analysis suggests that phases of indecision often precede renewed momentum once market participants reach consensus on valuation thresholds and liquidity flows realign.
Imperial Assets’ research identifies similar consolidation structures in previous cycles, where volatility compression eventually led to decisive market movement. Such periods often act as transition zones—cleansing excess leverage and recalibrating sentiment before a new trend establishes.
Beyond Bitcoin, the broader digital asset sector continues to evolve in structure and participation. Institutional frameworks, algorithmic trading infrastructure, and data analytics are converging to create more disciplined ecosystems. While near-term uncertainty may persist, these structural improvements underpin long-term stability and maturity within the space.
Imperial Assets emphasises that market indecision is not inherently negative—it can represent a critical pause that allows for recalibration and structural strengthening. As the industry continues to evolve, measured observation and analytical rigour remain central to understanding the next phase of market development.
Closing Statement
As market conditions evolve, platforms that emphasize transparency and innovation will be closely watched by traders and investors alike.

BTC bearSeeing this viscous selling reaction may take BTC to lower levels , I see 107 is a great key , breaking it will take it to 90.000

BitcoinBTCUSD
- Bullish Channel as an corrective pattern in Long Time Frame
- Break of Structure
- Supply Zone
- Completed " 12345 " Impulsive Waves
- Order Block

it’s over for BitcoinBy 2030, AI and automation will erase millions of jobs, driving chronic unemployment and collapsing global demand. Governments will tighten liquidity to stabilize currencies, killing speculative bubbles. Bitcoin, starved of new inflows and stripped of its inflation hedge myth, will fall below $20,000 as deflation, distrust, and mass automation reshape a hollowed-out global economy.

Parabola TimeBTC looks gud.
Trend is your friend.
Bitcoin historically lags gold — once gold confirms the macro shift, capital flows rotate into BTC, which acts as “high-beta gold” and rallies harder.

BTC 1hr levels onlyshown on the 15min timeframe these 1hr levels are the only levels marked in the range both support and resistance.
There are 4 candles which create 6 levels. All six levels are marked.
BackSide candle & level have a strong expectation to price and supports price.
marked on top of the first distribution candle with a dashed horizontal ray. If solid line, its acting as resistance while price is below it,
The last candle of a distribution range is the frontside candle, The top of the FrontSide Candle is the FrontSide level. The Bottom wick of the Frontside candle is the SwingLow.
its expectation is to support price and create a reversal so engulfing accumulation candles (especially. with F.V.G) are expected to create trends or levels where trends originate from. In math, these are called vertices and angles. I mark Origin levels as 2x dotted lines without always marking the trend itself. When trends break, price targets the origin level.
The inverse levels are the exact opposite of the BackSide & Frontside levels so they are resistance and marked Inv.BS and Inv.FS.
