BTC's situation+next targets and expected movementsBitcoin, as you can see, is within a descending wedge. If it breaks down, the price could drop below $100k, but we should wait for the breakout confirmation.
BTCUSD.PI trade ideas


The Surprise of 2025: Silver Beats Bitcoin and GoldEveryone talks about Bitcoin as the next refuge, but in 2025 the biggest surprise is silver.
Here’s how they stack up year-to-date in USD:
🥈 Silver: +62%
🟡 Gold: +46%
🟠 Bitcoin: +30%
That’s right — the “underdog” metal is outperforming both the “digital gold” and the classic safe haven.
In an environment of exploding debt, inflation pressure, and fiscal excess, physical assets are reminding the market why they’re still relevant. Bitcoin hasn’t replaced gold — it’s joined it. And silver? It’s quietly stealing the spotlight.
So why choose only one, when owning all three can make your portfolio stronger?

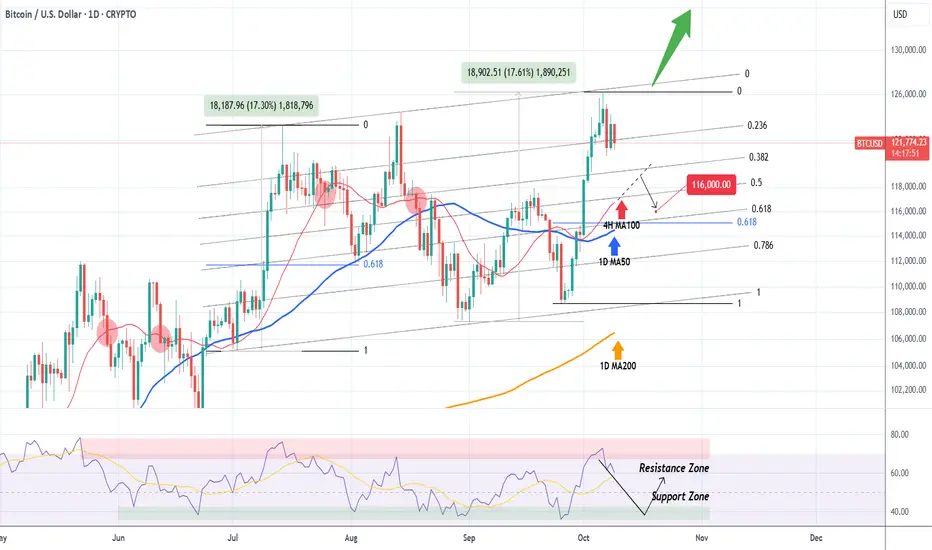
BITCOIN How low can it pull back??Bitcoin (BTCUSD) got rejected on the Higher Highs trend-line we mentioned on our last analysis and is already pulling back. The question is how far can it drop?
Today we expand on that analysis by applying the Fibonacci Channel on the Higher Highs trend-line. Instantly we can see that the Channel Up has two almost perfectly symmetrical Bullish Legs (+17.30% and +17.61% respectively).
The key on this pattern is the 4H MA100 (red trend-line). Every time BTC broke below it since May 29, the decline extended all the way to at least the 1D MA50 (blue trend-line).
Since the 1D RSI also got rejected on its Resistance Zone, we expect a pull-back towards its Support Zone and if the 4H MA100 breaks, further extension towards the 1D MA50. We estimate a potential target to be $116000, which is marginally above the 0.618 Fibonacci retracement level, where the August 02 bounce took place. Needless to say, a break (and 1D candle close) above the Channel's top (Higher Highs trend-line), invalidates any pull-back scenario and, as mentioned previously, constitutes a bullish break-out to a new pattern/ rally.
What do you think will happen next? Feel free to let us know in the comments section below!
-------------------------------------------------------------------------------
** Please LIKE 👍, FOLLOW ✅, SHARE 🙌 and COMMENT ✍ if you enjoy this idea! Also share your ideas and charts in the comments section below! This is best way to keep it relevant, support us, keep the content here free and allow the idea to reach as many people as possible. **
-------------------------------------------------------------------------------
💸💸💸💸💸💸
👇 👇 👇 👇 👇 👇
LONGI'm waiting for the highest price at 130,000, thank you Trump for giving us the correction faster with his words today🌺🌷

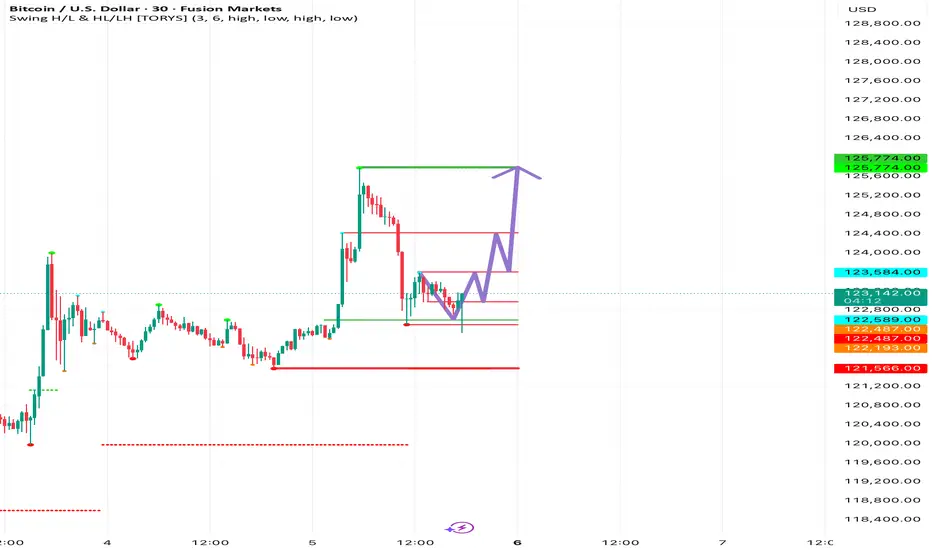
BITCOIN (BTC/USD) TECHNICAL ANALYSIS — BEARISH RETEST SETUPPair: Bitcoin (BTC/USD)
Timeframe: 30-Minute
Current Price: 121,200
Trend: Uptrend inside ascending channel, currently showing bearish correction
📊 Chart Analysis
Rising Channel (Pink Zone):
BTC has been trading inside an ascending channel since early October.
The recent movement shows a rejection at the upper boundary, followed by a pullback to the lower boundary of the channel.
Support Level (Blue Zone):
Identified between 126,200 – 127,400, previously acted as resistance, now turned potential support.
Price might retest this zone before confirming the next move.
Bearish Setup:
The projection suggests that price may retest the support, then reverse downwards toward the target zone near 119,800 – 119,700.
Entry Point:
126,238 – 126,254, ideal zone to enter a short position after a pullback.
Stop Loss:
127,435 – 127,446, above the resistance and previous highs — protecting against false breakouts.
Target Point:
119,812 – 119,795, lower channel boundary and next support area.
📈 Expected Price Movement
Current retracement may continue slightly upward to retest the blue resistance zone.
If price fails to break 127,400, a strong bearish rejection is expected.
Target zone sits around 119,800, completing a channel cycle.
✅ Summary
Parameter Level (USD) Notes
Entry 126,238 Short entry near resistance
Stop Loss 127,435 Above resistance
Target 119,812 Next support zone
Bias Bearish Sell on retest
RR Ratio ~3:1 Good short setup

Bitcoin - The path remains clearly bullish!💰Bitcoin ( CRYPTO:BTCUSD ) remains bullish either way:
🔎Analysis summary:
For the past 1.000 days, Bitcoin has simply been heading higher. Considering that the previous bullruns lasted about 800 days, Bitcoin is ready for a correction. But market structure tells us, that Bitcoin remains bullish, even if we see a short term correction in the near future.
📝Levels to watch:
$50.000, $1.000.000
SwingTraderPhil
SwingTrading.Simplified. | Investing.Simplified. | #LONGTERMVISION

Bitcoin - It is either $50.000 or $1.000.000!🪅Bitcoin ( CRYPTO:BTCUSD ) remains undecided:
🔎Analysis summary:
For the past couple of months, Bitcoin has been consolidating. With the two recent all time highs, we could see a similar pattern to what we saw back in 2021, followed by a bear market. But so far, Bitcoin remains bullish with the underlying trend continuation.
📝Levels to watch:
$1.000.000, $50.000
SwingTraderPhil
SwingTrading.Simplified. | Investing.Simplified. | #LONGTERMVISION

BTCUSDBTCUSD needs correction and further upside to break the ATH again.
Disclosure: We are part of Trade Nation's Influencer program and receive a monthly fee for using their TradingView charts in our analysis.

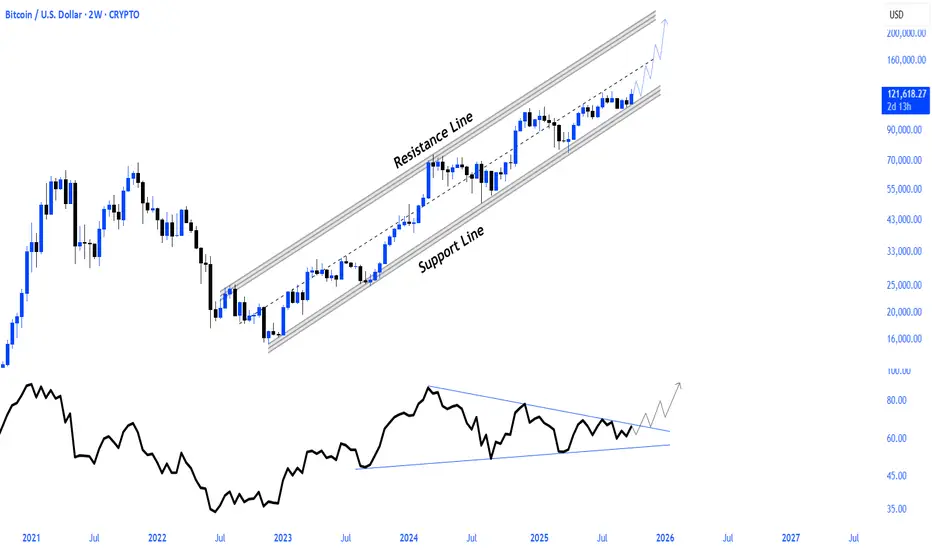
$BTC Preparing for a new run.Bitcoin continues to progress steadily within its long-term rising channel. The price is currently consolidating at the lower band of the channel, gathering strength for the next strong upward wave.
On the downside, momentum has been held by the major descending trend resistance that has persisted for months. A break above this resistance line would signal a strong shift in momentum, as seen in the past.
The technical structure is creating simultaneous bullish potential on both the price and momentum sides, signaling that the bull run will be more intense in the coming period.
The rising channel is being maintained.
Momentum is poised to break out.
Bitcoin: Key Levels and a Crucial Moment AheadBitcoin has been stuck in a sideways range since July 2025, holding a strong support around $108K and facing tough resistance near $124K.
To make things more interesting, the uptrend that started back in 2022 is now converging right at that same support area around $108K, and just a few days ago, we highlighted the potential buy opportunity this could represent.
✅ That opportunity has already delivered +12% gains in just a few days, with very limited risk.
If Bitcoin breaks above $124K , we should look toward the next resistance zones, currently around $142K and $163K . These aren’t random levels; they align perfectly with the long-term pattern Bitcoin has been forming for years, where support and resistance appear roughly every +14% move. You can see all these levels clearly marked on the attached chart, and you’ll notice how consistently they’ve held.
⚠️ However, as I’ve been warning for months, a breakdown below $108K would be a major red flag for the bullish trend. Returning to a previous accumulation zone is one of the strongest bearish signals, which could lead, at best, to months of sideways movement, or more typically, to a sharp correction that would still fit neatly within Bitcoin’s historical cycles.

Bitcoin bottom for next bear market at 32,026$!If you missed this bull run, don't miss the next.
dollar cost average anything below 50,000$.
I can bet my life on this occurring and opening options for this idea.
Time scale it will take ? probably 1 year or so.
if you are smart, you will copy each key level on this chart onto your chart and watch how price just bounces around these key levels.

BTC/USD: Structure Shift Confirmed - Bearish CHoCH Break"The previous analysis highlighted the Minor and Major CHoCH levels as key lines in the sand for the recent uptrend. The market has now decisively broken BELOW both levels.
This action confirms a Bearish Change of Character in the market structure (on the chart), signaling a failure of the current bullish order flow.
1. Minor CHoCH Break: Confirmed the initial weakness and short-term pullback.
2. Major CHoCH Break: Confirms the structural shift, indicating that the corrective move is likely to be deeper than a simple consolidation.
We should now anticipate a shift in price action: making Lower Highs and Lower Lows. The previous support levels may now act as resistance. Looking for the next key demand zones for a potential bounce, but the immediate bias is now BEARISH."

BTC 1W — S/R playbook: tops, bottoms, and the 119k decision lev.BTC 1W — Structural S/R map: 119k is the line in the sand
Thesis
Price is pressing the top of a rising structure on the 1W chart. My S/R map marks 119,000 as the key support. A weekly close below 119k flips the structure from trend-continuation to corrective risk.
Key zones (1W)
Resistance: 150–160k area (rising wedge/diagonal supply)
Active support: 119k (cluster of weekly closes + diagonal base)
If 119k fails (weekly close): 105–100k (prior weekly consolidation) → 92–96k (lower diagonal/box top)
Plan
Bullish bias while weekly candles hold above 119k. Pullbacks into 119–124k = find reaction and reclaim.
Risk flips on a weekly close below 119k. Expect momentum sellers and a slide toward 105–100k.
Invalidation for shorts: reclaim of the broken level on a weekly close (classic “lost → reclaimed” trap).
Invalidation for longs: weekly close below 119k (structure break).
Why these levels
Levels are derived from 1W swing clusters and clean close-based S/R. Diagonals only frame context; decisions are made at horizontal S/R. I trade weekly; no lower-TF noise.

BTC Daily IndicatorsDaily indicators seem to be working well for shitcoin right now while it's in a sideways channel.
I still think cryptos are a giant scam, but so are the stock market and commodities, lol.
Something to watch out for. BTW, I think ETH has more profit potential, but BTC indicators make more sense. I might use BTC as an indicator and trade ETH, lol.

Bitcoin to 7 trillion within the week? There is a pee pee poo poo pattern forming on the third Heidenberg-Pinkman wave.
This combined with Fibbonacci Davinci Liberacci and Donatello Leonardo continuations suggest a new all time high of 500 quadrillion veitnamise dong.
There is also a visible pattern of head and shoulders, but not the traditional one. In this vastly more complex version the chart will take shape into a bottle of dandruff preventing shampoo hence the name head and shoulders
Levels to watch:
-Negative 17 Fafillion
-40
-Infinity plus one

BTC/USD - Bearish Channel, new opportunity (2025.10.10)Great day ahead to all !!!
BTC/USD appears to have developed a Bearish Channel.
Continuously Bearish Trend line
Prices are reversing and retesting the resistance zone
Potential Lead to a continuous Bearish movement
Suggested Set Up : SELL
Entry :Enter at Resistance zone area + a confirmation candle
1st Target : 120780
2nd Target : 119685
Stop Lose : 123820
If this breakdown helped clarify your view, please consider liking, commenting, and following for more updates!
Crucial Reminder: Always prioritize risk management and wait for clear candlestick confirmation before entering a trade.
Disclaimer: This analysis is for educational purposes only and should not be considered financial advice. Trade responsibly and at your own risk.
Thank & Regards,
OneBo Trading
#BTC #Breakout #Analysis #PriceAction #ForexTrading #SwingTrading #TechnicalAnalysis #OneBo_Trading

SELL BTCUSDGetting ready to SELL BTCUSD next week, SELL Entry will be determine once market confirms, riding it back down to 71,000, 58,000, or 40,000 as Profit Targets, Stop Loss will be determine once market confirms!
If anyone likes long mumbo jumbo garbage analysis, than this is NOT for you.
Also, if you are afraid of risk, failure, and want only a 100% sure thing, than
run as fast as you can from the market, because the market is NOT a sure thing,
so it is definitely NOT for you.
WARNING: This is just opinions of the market and its only for journaling purpose. This information and any publication here are NOT meant to be, and do NOT constitute, financial, investment, trading, or other types of advice or recommendations. Trading any market instrument is a RISKY business, so do your own due diligence, and trade at your own risk. You can loose all of your money and much more.

Long with minimal SL Market is bullish a higher time frame, and here, a structure is broken to the upside after stop hunt which mitigate the precedented order block.

BITCOIN HAS BEARISH DIVERGENCEBitcoin continues to build overbought bearish divergences on multiple time frames. The 4-hour and 6-hour both have them (with some hidden bullish divergence on 4), and we are even seeing it potentially on the weekly.
Fundamentals trump charts, so FOMO could kick in and invalidate these quickly. Still, I am being cautious at resistance when there’s euphoria.

This is just momentary, Bitcoin max upward price is 121,107$!Hey, all
take a deep breath, on bigger timeframes bitcoin is still very bearish and downside potential outways upward potential.
I believe the ceiling for this move is 121,107$ and price should plummet once again from this price.
We predicted that SPX would go up this week - see linked ideas, and BTC follows SPX in most cases.
The daily price chart is exhausted from this bull move already, and we should see a massive candle wick that is bearish on the monthly.
I believe we will close this month below 103,792$ and all these perma bulls will go into hiding once again.
just save this chart, play it every week or day and see how price just plays around the key levels on this chart.
