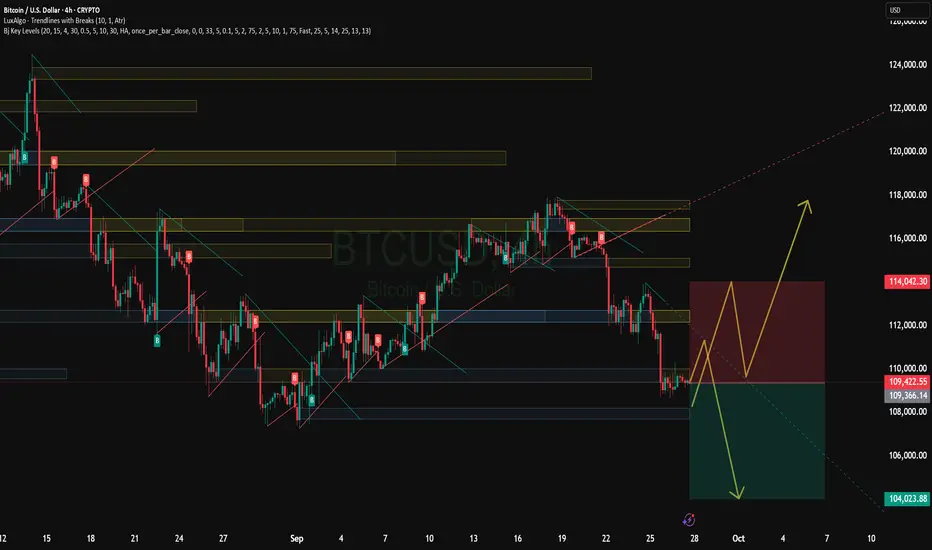
BTC SWING SELL IDEA 🟥 BTCUSD – SELL (SWING SETUP)
🚦 Bias: BEARISH (Short)
🎯 Entry Zone: 109,200 – 109,600 (Current Price ~109,400)
🛑 Stop Loss Options:
• Conservative (tighter risk): 116,465
• Original swing stop: 124,619
🏁 Take Profits:
• TP1: 108,000
• TP2: 101,500 – 100,800
• TP3: 94,000 – 93,200
• TP4: 85,500 – 84,700
• TP5: 75,250 (Final Target)
📊 Setup Notes:
Two stop options depending on your risk appetite.
Larger RR if using the wide swing stop, but the tighter stop offers reduced downside exposure.
Structure remains bearish as long as price stays under 113.5k – 115k zone.
BTCUSD.PI trade ideas

BTCUSD | Wedge Pattern | 1D🔺 Price Structure: Rising wedge formation unfolding in Elliott Wave count.
🔄 Current Phase: Wave (iv) correction → retesting wedge support.
📍 Demand Zone: $100K – $104K (blue box) = key accumulation area.
📈 Bullish Outlook: Holding support = launchpad for wave (v) rally.
🎯 Target Zone: $140K – $160K (potential ATH breakout).
⚠️ Invalidation: Breakdown below wedge base = structure compromised.
🧠 Mindset: Patience. Precision. Profit.

BTC correction is over in area 105k - Target 155kIn my view current BTC correction will find supoprt at 0.618 Fibonacci Level, around 105k area, where bullish trend will resume to complete the bullish cycle startede in 2020 after covid crash.
My final target is around 155k but I see a correlation between BTC and SPX cycle so assuming that my final target for SPX is around 7440 area and considering that usually BTC anticipates SPX inversions I'll close long position when SPX will be in 7300 area.
After bullish cycle completion I see a long term bear cycle starting for SPX and BTC in 2026.
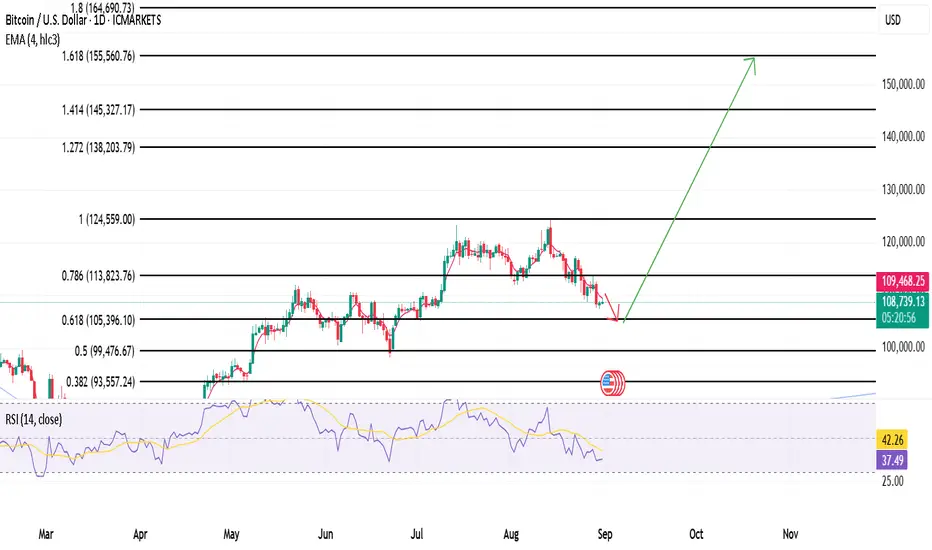
BTC one more probable scenarioBTC is falling from 124,5k ATH , if the falling stops @105k (0.618 fibonacci level) we could see last bullish leg targeting 155k new ATH and the end of bullish cycle

Is is over for BITCOIN or new ATH is next ??Hi everyone.
Here is the summary of what i think about btc.
I expect a dip to mid 90s region. liquidity will be grabbed and then the path to new all time high in Q4 will be set.
I expect 130k - 140k region to be the top of this cycle for bitcoin.
meanwhile some altcoins will print massive pumps too.
I believe bear run can start in late Q1 2026 followed by a dip of a bear run in Q3 2026 where bitcoin can form bottom at 45k - 60k region.
follow me for more analysis and altcoins

Bitcoin To 103,792$ within 10 days - options king!As the title says, you can easily place options trades with my analysis, don't bet a lot though, small amounts for you to hedge your normal portfolio, but you can see great returns from it.
you can also place some 30+ day options for longer term outlooks such as BTC to 80K.
I am the person that has predicted every twist and turn of this market, and more financial meltdown is coming your way.
see my linked ideas for how we predicted the collapse of bitcoin from ATH and we expect further collapse.
You should see BTC at 40k within the next 8-9 months.

BTC Bias - HTF - Plan - 29.09-05.10BTC’s done basically nothing. We had a big reset on Thursday, then sideways into today. From here (Sunday) I’m expecting either more downside or a nasty pump into Monday that doesn’t take the lows - just enough to keep the hopeium alive. End of month and quarter make this tricky.
BitcoinOver the past four weeks, Bitcoin first returned above the local level of 112k before falling below it. Potentially, it could now head toward the 100k mark. The long-term trend remains upward, but a break below 100k would signal a potential reversal to the downside. In light of the above, we are keeping our outlook neutral.
Long-term trend: No
Resistance level: 125000
Support level: 100000

BTCUSD 9/28/2025DOWN GOES FRAZIER!!!! Remember, Price is targeting Lows.... Let's see what Price does....
_SnipeGoat_
_TheeCandleReadingGURU_
#PriceAction #MarketStructure #TechnicalAnalysis #Bearish #Bullish #Bitcoin #Crypto #BTCUSD #Forex #NakedChartReader #ZEROindicators #PreciseLevels #ProperTiming #PerfectDirection #ScalpingTrader #IntradayTrader #DayTrader #SwingTrader #PositionalTrader #HighLevelTrader #MambaMentality #GodMode #UltraInstinct #TheeBibleStrategy

BTCBitcoin is continuing its bearish structure, suggesting further downside pressure in the current wave development. The market remains weak, and unless strong reversal signals appear, the decline could extend toward lower support zones. Traders should maintain a cautious bearish bias and wait for confirmation before entering short positions.

The Last Bitcoin Bear Trap Before Q4 2025Today, let’s face the reality: monthly candles are in distribution. But this is the last bear trap before October. Either take advantage of this opportunity or run away with paper hands. This dip will end very soon, as the Stoch RSI rebounds from the bottom and the RSI completes a hidden bullish divergence from the lows

Bitcoin is ready for a vertical move and a stealthy surgeToday, let's examine why our work in this cycle isn't over yet, and why we haven't seen the peak or the cycle top. Key on-chain indicators still haven’t recognized the top, and we need to wait for its vertical move to begin. Every dip is just the market’s final slope and represents a buying opportunity. We are ready for the final phase of the market in Q4

Bitcoin - MACD SignalLets look at the current bull run in Bitcoin from the Nov 2022 low around 16,000.
Major Support resistance - identified at 16000-20000 and at 66000-70000
Waves - there have been 4 impulsive waves and 4 corrective. The last 3 impulsive moves resulted in roughly 50K rise. The corrective moves have been Rectangles or Bull Flags.
Trendline - a supporting trendline can be identified , that has been touched on 3 occasions to date.
Moving Averages - since price has moved above the 200 period moving channel, the 20/50 MAV has stayed in a golden relationship. Note the more responsive 9 MAV has momentarily crossed below the 20 MAV at the low of the corrective cycle. Price also has tested the 50 MAV at each low.
MACD - The slow/fast signal lines crossed the Zero axis in March 23 and has stayed above for the duration. Each golden cross and dead cross approximates 4 weeks from a high or low in price. Additionally, if price moves outside the bollinger bands (signified by grey bars) , a consolidation soon follows. The bearish divergence of price and MACD signal is noted.
Where are we now ?
Primary Trend - Dow would suggest we are still in a Bull Market.
Signals - The MACD had a weekly dead cross on the 25th August 2025. Price been in consolidation since the 14th July 2025. The 9ema space to 20 ema is contracting, but it has not had a dead cross as yet. The 50 MAV sits at 98000. Trendline support 102000-107000.
Where to next ?
Bull Case - primary trend is up and until it bends down, Bitcoin appreciates. Support likely above 95000 and next leg to 150000. MACD golden cross comes in timely, so waiting for this confirmation would assist.
Bear Case - possibly a major correction if the trendline is broken comprehensively to the downside. MACD signal lines crossing below Zero would be the confirmation . The swing low of 75000 and the major support at 70000 would be the obvious projections.

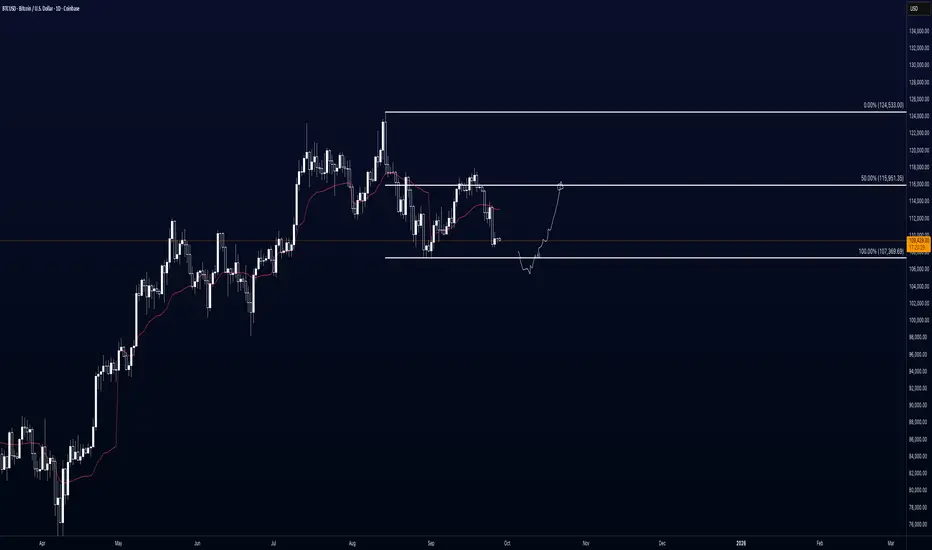
BTC outlookThis is my outlook on BTC, derived solely from technical analysis with no consideration of fundamentals. I identify a potential buying opportunity within the green box area, with the most conservative take-profit target positioned at the 2.618 fibonacci level.

Bitcoin Chart Fibonacci Analysis 092725Trading Idea
1) Find a FIBO slingshot
2) Check FIBO 61.80% level
3) Entry Point > 108,850/61.80%
Chart time frame:B
A) 15 min(1W-3M)
B) 1 hr(3M-6M)
C) 4 hr(6M-1year)
D) 1 day(1-3years)
Stock progress:C
A) Keep rising over 61.80% resistance
B) 61.80% resistance
C) 61.80% support
D) Hit the bottom
E) Hit the top
Stocks rise as they rise from support and fall from resistance. Our goal is to find a low support point and enter. It can be referred to as buying at the pullback point. The pullback point can be found with a Fibonacci extension of 61.80%. This is a step to find an entry-level position. 1) Find a triangle (Fibonacci Speed Fan Line) that connects the high (resistance) and low (support) points of the stock in progress, where it is continuously expressed as a Slingshot, 2) and create a Fibonacci extension level for the first rising wave from the start point of the slingshot pattern.
When the current price goes over the 61.80% level, that can be a good entry point, especially if the SMA 100 and 200 curves are gathered together at 61.80%, it is a very good entry point.
As a great help, TradingView provides these Fibonacci speed fan lines and extension levels with ease. So if you use the Fibonacci fan line, the extension level, and the SMA 100/200 curve well, you can find an entry point for the stock market. At least you have to enter at this low point to avoid trading failure, and if you are skilled at entering this low point, with the fibonacci6180 technique, your reading skill of to chart will be greatly improved.
If you want to do day trading, please set the time frame to 5 minutes or 15 minutes, and you will see many of the low points of rising stocks.
If you prefer long-term range trading, you can set the time frame to 1 hr or 1 day

Patience is Profit: The Unseen Poetry of Forex Risk Management⚠️ Shocking Truth in Forex Trading ⚠️
Most traders lose not because their strategy is wrong… but because they ignore risk management.
🛡️ Mastering Risk Management in Forex Trading
Risk management is the foundation of long-term success in Forex. Many traders spend their time perfecting entries and strategies, but the real edge comes from how well you manage risk, emotions, and capital. Without these, even the best strategy will fail.
📌 Position Sizing
📉 Never risk more than 1–2% of your account on a single trade.
📏 Adjust lot size according to your stop-loss distance.
⏳ Small, controlled risks keep you in the game long enough to let your strategy work.
🎯 Risk-to-Reward Ratio
⚖️ Always aim for 1:2 or higher risk-to-reward.
📊 Even with just a 40% win rate, a positive RRR keeps you profitable.
🔑 Focus on consistency rather than chasing quick wins.
🧠 Psychology of Risk
😨 Fear makes traders exit winning trades too soon.
💰 Greed convinces them to hold onto losing trades too long.
📝 Build a personal rule: “I follow my plan, not my emotions.”
✔️ Accept losses as part of the business—risk is simply the cost of trading.
📉 Drawdown Control
🚫 Avoid over-leveraging—it magnifies both profits and losses.
🛑 Cap your risk per trade to protect account equity.
🔄 Remember: a 50% loss requires 100% gain to recover. Capital protection comes first.
🔄 Consistency Over Perfection
🎲 No strategy wins every time.
🏦 Risk management allows you to survive losing streaks.
🎰 Think like a casino: edge + probability + discipline = profit.
🧘 Trading Psychology Habits
📖 Keep a trading journal to track results and emotions.
🧩 Detach from outcomes and focus on executing your plan.
☕ Trade only when your mindset is calm and focused.
⚖️ Golden Rule
💎 Protect your capital first—profits will naturally follow.
Discipline, patience, and controlled risk are the keys to turning short-term survival into long-term success.
✅ Final Thought: In Forex, your greatest weapon is not predicting every move but mastering risk management and emotional control. The market always rewards patience, discipline, and consistency—not reckless gambling.
📢 Follow me for more Forex insights, strategies, and trading psychology content.

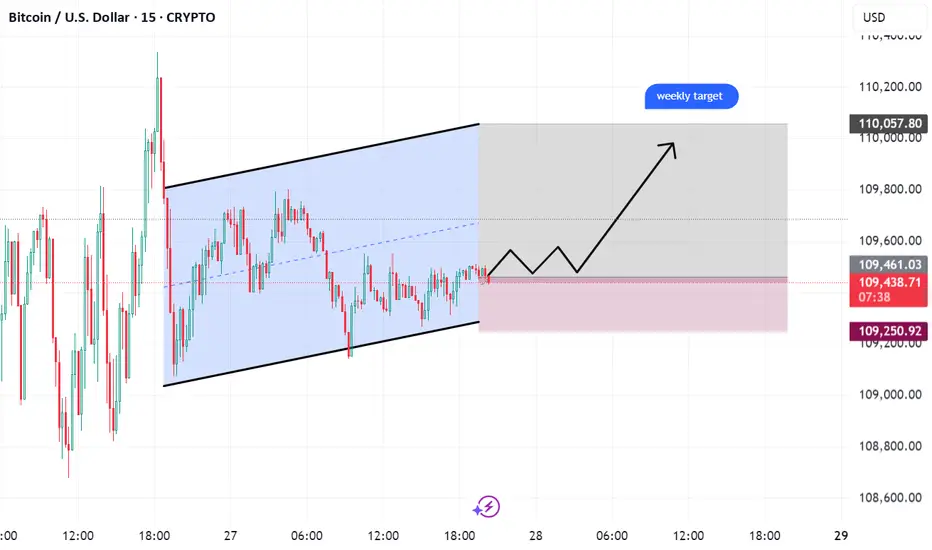
BTCUSDT weekly target get more link in bioBTC/USD | Short-Term Analysis
Bitcoin has bounced off the support zone and is now trading in an upward channel. Bullish momentum is expected in the next few hours after price consolidation.
Key Levels:
Support: 109,250 USD
Resistance / Weekly Target: 110,200 USD
✅ Trading Idea: Consider a buy setup when the price touches the lower channel, with a stop loss below support. Follow the upward trend to the weekly target.
Note: Be sure to apply risk management; the market is volatile.
LONG ON BITCON BTC/USDBitcoin has started its (New Downtrend) after it completed a change of character on the Daily on Aug 25th.
I am looking to catch the pullback to the next key level of supply before turning around and selling bitcoin to the next swing low.
On this buy trade I will be looking to make 5000 points.

$100,000 Bitcoin Might Not Be Far From Reality....“Fed Cut” was Already Expected
The 25bps cut had 99.7% probability priced in, so there was little surprise. Bitcoin needed more dovish forward guidance, not just a single cut.
This led to a “sell the news” effect: BTC jumped ahead of expectations and then hesitated.
Weak Spot Flows / ETF Pullbacks
Futures markets are active and leveraged, but spot volume is lagging, suggesting weaker real demand.
Although ETFs once fueled gains, some weeks show professional asset managers pulling back, slowing the rally.

BTCUSD Short Idea: Bearish Rejection at Former SupportHello fellow traders,
This is a technical analysis of a potential short setup on the BTCUSD 15-minute timeframe.
Analysis:
The chart shows that after a notable downward trend, the price of Bitcoin has been consolidating in a tight range. We are currently observing a retest of the key horizontal level around $110,425. This level previously acted as support, and the current price action suggests it may be flipping into a new resistance level.
The expectation is for the price to be rejected from this resistance and continue the prevailing bearish trend.
Trade Setup:
Based on the short position tool placed on the chart, the parameters for this trade idea are as follows:
Entry: Approximately $110,423.09
Stop Loss: $112,626.92 (This is placed above the recent consolidation high, providing a buffer against volatility).
Take Profit: $103,822.05 (This targets a lower price point, potentially a new swing low).
This setup presents a clear risk-to-reward profile.
Disclaimer: This is a trading idea for educational and discussion purposes only. It does not constitute financial advice. Please conduct your own research and manage your risk appropriately before making any trading decisions.

Saturday Bitcoin analysisSo far, Bitcoin’s trend is bearish, and the price is stuck in a range that seems to be getting tighter by the moment. Of course, in the next day or two we shouldn’t expect much movement because the Forex market is closed — unless some sudden major news comes out.
If the range breaks to the upside, we need to wait for a strong trigger, meaning clear signs of a trend reversal. But if the range breaks to the downside, we can enter a position even without a trigger, as long as risk management is applied. One important point: since the price has already dropped a lot, in case of a downside breakout we shouldn’t expect a high RR, because the trend could reverse at one of the support levels. ✅

UNWINDING WEAKNESS.📉 #Bitcoin 4H Technical Outlook
BTC is consolidating near $109K after a sharp drop, with major support resting around $98K–$100K.
• 🔴 Key resistance: $118K → $124K
• 🟢 Key support: $98K → $100K
• ⚠️ Bias remains bearish below $112K. A breakout from this tight range will define the next major move.
👉 Watch $109K for a decisive break. Below = bearish continuation. Above $118K = bulls regaining control.
#menlikelucid.

BTC Possible Scenarios for the WeekPossible Scenarios for the Week
Bullish scenario: BTC holds support at $110,000, breaks through $120,000, and heads toward $125,000-$130,000.
Sideways/consolidation: Movement between $110,000 and $120,000 without a clear direction.
Bearish scenario: Break below $110,000 — test of $105,000 and below.
Risks and factors to monitor
Fed policy and rate announcements can significantly influence the trend (as a driver for the USD).
Trading volumes: Weak volumes during breakouts may be false.
US macroeconomics, inflation, geopolitics — increased tensions could trigger volatility.