BITCOIN, BITCOIN DOMINANCE, ETHEREUM ANALYSIS 9-14-25Bitcoin has done a nice pullback from the initial sell off from the all time high and found a good support on the 21 EMA on the weekly chart. From the 21 EMA on the weekly chart it's now at a fib resistance level of 0.5 and could potential push up to the 0.618 fib level( 118k) otherwise my expectation is that the pullback is done and another sell off is likely to send price done to the 200 EMA on the daily chart or potential target of $105,530 in the coming week.
Ethereum is also struggling at the 2021 resistance high and more likely to pullback to the 0.382 level ($3,823) before it's continuation to higher high breakout of the 2021 resistance level.
BTC dominance is still in a strong down trend but quite oversold and likely to bounce up a little to the 58% level before continuation of the down trend. I think BTC. Dominance will ultimately reach a bearish Pennant Target of about 55% before a potential reversal.
Thank you for reviewing my analysis and don't hesitated to share your thoughts in the comments section. cheers and I wish you the best of trades this week.
BTCUSD.PI trade ideas

Treasury General Account MAJOR Impact on $BTC PriceI’ll be the first to admit I failed to closely follow and analyze the impact of the Treasury General Account (TGA).
We all know it’s a liquidity suck on ₿itcoin and cryptocurrencies, which are the most highly sensitive assets to liquidity, but have you ever dove into the data to see just how impactful it is?
I went through all the refills and calculated how much it drew down the CRYPTOCAP:BTC price.
Note how TGA refills also marked cycle tops in 2017 and 2021.
This really is something to closely monitor going forward alongside Total Global Liquidity (TGL).
What I have found is when TGA refills are occurring, they have more impact on the price of BTC than TGL.
We can see this in the current state of market, where TGL is at an ATH and the TGA is currently being refilled.
GOOD NEWS: The TGA refill is just about complete 🏁
Moon on brave soldiers 🌛

BTC - about to go full retardo - $135kI think the title says it all. BTC is about to go into a massive rally. We need to finish out the last little bits of this correction, and go all in. $135k is going to be an easy next target before the next area of Consolidation. That level of consolidation is unlikely to give much back, which will then unleash full retardo mode taking us to near $164,200. Time line is about 6-8 months or so as how it is looking to me today. I will update as we climb. Good Luck. Especially to the traders holding short positions. Ouch.

BTC to $100,000 or lower BTC is pretty much out of options. The thicker lines on my chart represent the most likely path. Here in Red. The thinner line represent the counter move. I post these types of charts when the market is at an inflection point, such is the case now. The simplicity is that we must rally now, and not give up any ground at all or the market tanks to $100,000, and then deteriorates further to $85,300. So in a 24 - 48 hour period we will know the direction of the market for the next 6 months. I am seeing this thing breaking down in all kinds of ways, and I am calling a top here to BTC, with the most likely bottoming / consolidation zone coming near $85,300. Well see.

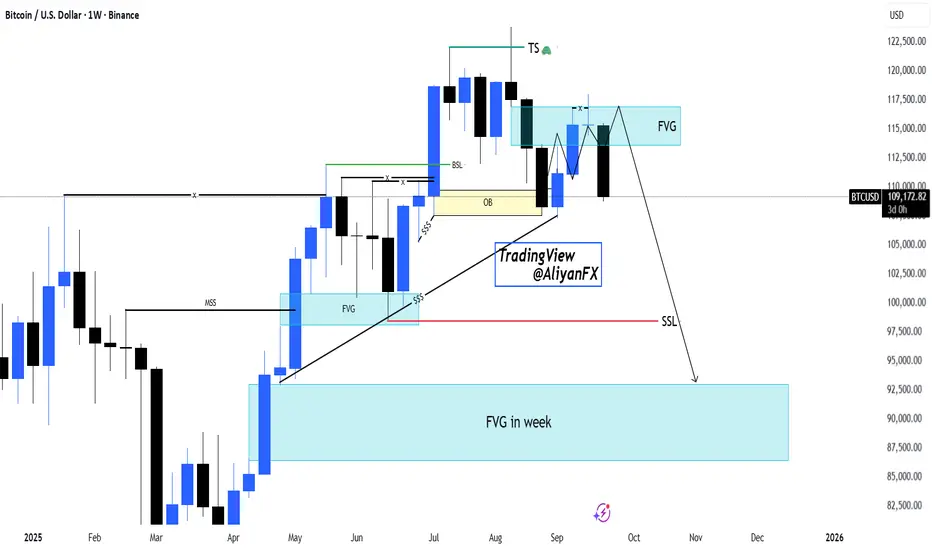
BTCUSD | Weekly FVG Rejection – Bearish Outlook Targeting SSLHello Billionaires!!
We All know that Bitcoin has tapped into a weekly Fair Value Gap (FVG) after sweeping Buy-Side Liquidity (BSL) and reacting from the Order Block (OB). Current price action shows rejection, suggesting bearish continuation.
🔹 Key Points:
BSL swept, confirming liquidity grab.
Price rejected from FVG + OB zone.
Short-term structure break hints at downside momentum.
Targeting Sell-Side Liquidity (SSL) and the weekly FVG demand zone around 90,000 – 92,000.
Outlook remains bearish unless price reclaims and sustains above the FVG rejection zone.
Bearish drop off?The Bitcoin (BTC/USD) is rising towards the pivot which is a pullback resistance and could reverse to the 1st support that lines up with the 100% Fibonacci projection.
Pivot: 111,257.18
1st Support: 107,260.23
1st Resistance: 113,469.79
Disclaimer:
The above opinions given constitute general market commentary, and do not constitute the opinion or advice of IC Markets or any form of personal or investment advice.
Any opinions, news, research, analyses, prices, other information, or links to third-party sites contained on this website are provided on an "as-is" basis, are intended only to be informative, is not an advice nor a recommendation, nor research, or a record of our trading prices, or an offer of, or solicitation for a transaction in any financial instrument and thus should not be treated as such. The information provided does not involve any specific investment objectives, financial situation and needs of any specific person who may receive it. Please be aware, that past performance is not a reliable indicator of future performance and/or results. Past Performance or Forward-looking scenarios based upon the reasonable beliefs of the third-party provider are not a guarantee of future performance. Actual results may differ materially from those anticipated in forward-looking or past performance statements. IC Markets makes no representation or warranty and assumes no liability as to the accuracy or completeness of the information provided, nor any loss arising from any investment based on a recommendation, forecast or any information supplied by any third-party.


BTCUSD update May 22nd, 2025I have returned and here is my updated chart. I'm such a perfectionist sometimes when it comes to lines that it takes my hours to get them exactly how I envision. To start off, yes I am bullish on Bitcoin and believe that this cycle hasn't ended yet but I will admit that I think the end of it is closer than the beginning. With that being said, I will not disappear when the bear market starts, I will simply make updates and try to catch the bottom like I did in the past. So far I am going with history and my bottom target is above 66,800 and I expect the floor to fizzle out around 71-73k; if it ends up being higher than that, great! Overall this idea is just an update for my own personal records and my prediction is based on what has happen that last time this pattern was brought to us.
Stay safe out there, happy trading, and as always--Cheers!

BTCUSD 1D Chart🔎 key levels
• Resistance: approx. 117,971 USD
• Resistance: approx. 111 426 USD -
• Support 2: approx. 108 292 USD - the course is testing this level.
• Strong support: approx. 103 883 USD - strategic defense level.
📈 Trend
• You can see a clear upward trend (orange trend line), but has just been violated by a strong relegation candle.
• It can be a signal of buyers' weaknesses.
📊 oscillator (Stoch RSI)
• It is very low (close to the sale zone).
• This means that a short -term reflection may occur, but there is no confirmation.
🚩 Scenarios
1. Bycza - if the course reflects from 108k and returns above 111k, a possible approach to 117K.


$BTC Situation updateBitcoin doesn't look bullish right now. It seems we will have a couple of weeks of ranging and maybe another ATH (exit liquidity) and then lower targets. this new ATH can happen, but it's not necessary, so don't expect that.

Forming W Bottom on BTCThis charts show clear support levels for BTC.
If we can hold maybe we will see more upside.
It is really hard to tell at this point if the price will drop more or not.
Momentum is trending to the down side.
However on the weekly view still pretty up trending overall I would say.
What do you think?
Comment Below

Support?It appears on the 2 Day chart that our BTC is at a support level 108,713 if it loses that level it may drop further to the 105K level. Stochastic is bearish and RSI is below 50 and it looks we might get a healthy breach of the 50 EMA(in blue), however we are at a support (for now).

"Uptober" hopes tested as Bitcoin and Ethereum slideWhile Ethereum has outperformed Bitcoin in recent months, today’s session shows a reversal of that trend. ETH is down roughly 6.5%, underperforming BTC, which has slipped around 3.8%.
Historically, September has been a weak month for crypto, with a tendency for a recovery in “Uptober”.
Uptober might be helped by further rate cuts from the Fed , the SEC deciding on multiple crypto ETFs and more information about Morgan Stanley’s plans to roll out crypto trading for retail clients through E-Trade in early 2026.

BITCOIN TOP REACHED PREPARE FOR BOTTOMI predicted the exact bottom last cycle check my analysis history. Now im predicting the top and bottom for next cycle either eat with me or dont.
Good luck to all.

Blood in the streets...Is a Bear Market Starting? We discuss the technical obseravtion in the SPX / SPY.
Why was IWM so weak today?
What is happening with inflation & why are yields rallying?
Are tensions with Russia escalating?
Today we closed IWM 241 puts for 150% gain.
We took profits on many other short ideas & entered several new trades today.
Caution needs to be warranted since the Dollar and oil are rallying.

BTCUSD>><>><>><>><SO this is how i think i try to use more price action and levels instead of fvg and others and i like to see your opinion so LEAVE A COMMENT

NastyThis bull cycle has had a very straight-forward trajectory, but this might be the end of the road.

Supported at 110,000–111,000, we stay bullishAnother successful long entry 🚀! As we have repeatedly stated before, as long as BTC does not break below the 110000–111000 support range 🛡️, we will still maintain a bullish outlook 🐂
Buy @111000
TP 112000 - 11300 -113500
Accurate signals are updated every day 📈 If you encounter any problems during trading, these signals can serve as your reliable guide 🧭 Feel free to refer to them! I sincerely hope they'll be of great help to you 🌟 👇
Dominant trend direction called this move 1 week aheadIt's pretty epic being able to call the future before it happens, especially on markets.
With just using market structure laws alone, I called this price action a week ahead of it happening
Once you learn and know the laws, markets really aren't THAT complicated

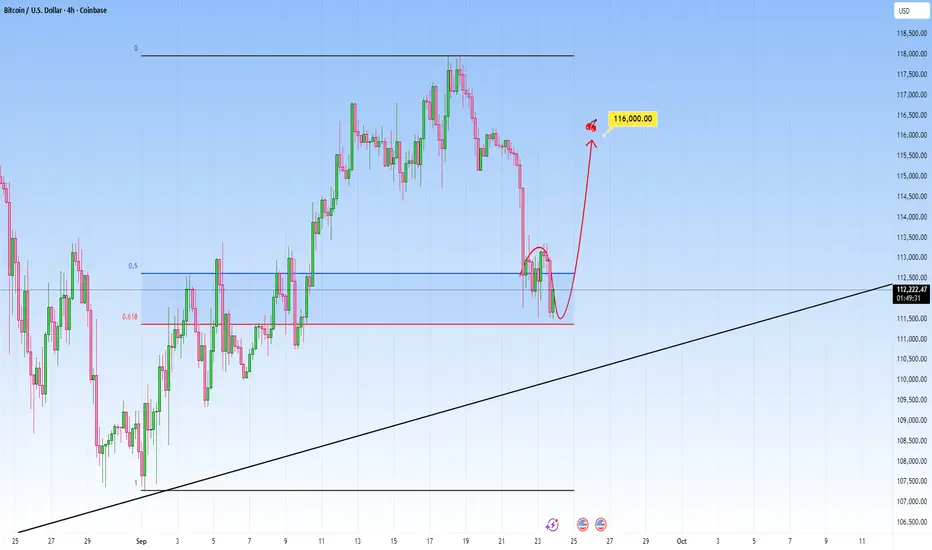
Bitcoin Analysis: Key Level to WatchPrice sold off aggressively, and now it sits within a key reaction area.
We can see price just tapped into the 0.5 and 0.618 Fibonacci retracement level of the last leg up. This is the golden pocket, a place where markets tend to react often.
Now look closely: price is showing early signs of rejection here, with wicks forming and momentum slowing down. If buyers step in here, and hold this zone that is our signals, targeting around the previous high.
But if price breaks clean below it, that invalidates the bullish idea and we could see some more continuation lower.
Bitcoin BTCUSD Possible 50% CorrectionNot pictured, BTCUSD weekly has the tightest Bollinger Band squeeze in history, suggesting a big move is coming soon.
The weekly candlestick pattern is currently an Evening Star. Momentum is pointing down with a bearish crossover.
There is confluence at the 1.618 Fib extension and the 200-week Moving Average that points to a possible correction to $54-56K.

BTCUSD - Bitcoin short?Not easy to be a seller on bitcoin, but this looks really good.
This is not a trade recommendation; it’s merely my own analysis. Trading carries a high level of risk so carefully managing your capital and risk is important. If you like my idea, please give a “boost” and follow me to get even more.
