BTC CLEARS THE 50 MABitcoin is trading back above the 50 MA for the first time since the middle of August. Yesterday’s candle was strong, closing at the daily highs.
There’s a lot to like in the crypto market right now.
BTCUSD.PI trade ideas

Understanding Elliott Wave Theory with BTC/USD If you’ve ever stared at a Bitcoin chart and thought, “ This looks like chaos ”, Ralph Nelson Elliott might disagree with you. Back in the 1930s, Elliott proposed that markets aren’t just random squiggles — they actually move in recognizable rhythms. This became known as Elliott Wave Theory .
So, what is Elliott Wave Theory? In the simplest terms, it’s the idea that market psychology unfolds in waves: five steps forward, three steps back, repeat. Not every chart follows it perfectly, but when you see it play out, it feels like spotting order in the middle of crypto madness.
⚠️ Before we dive in: remember, no single tool or pattern works alone. Elliott wave trading is most useful when combined with other methods.
The Elliott Wave Principle
At the heart of the Elliott Wave principle are two phases:
Impulse Waves (5 waves) : Markets advance in five moves — three with the trend, two counter-trend. This is when optimism snowballs.
Corrective Waves (3 waves) : The market cools off in three moves. Usually messy, choppy, and fueled by doubt.
Put them together, and you get a “5-3“ structure that repeats at different scales. That’s what gives Elliott Wave its fractal character. Again, don’t treat this as a crystal ball. Elliott Wave Theory rules are guidelines, not guarantees. Real-world Bitcoin charts bend, stretch, and sometimes ignore them altogether.
Elliott Wave Theory Explained with BTC
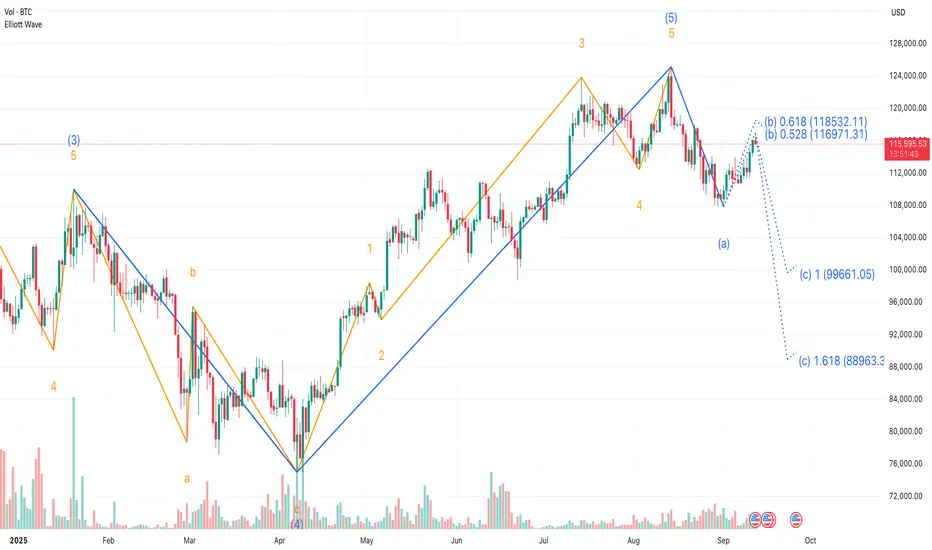
Let’s use an example: Bitcoin’s rally from early 2025 till now .
This downturn marked the first step in a broader consolidation, signaling that momentum was beginning to fade.
The corrective sequence unfolded in a classic A-B-C structure.
❗This three-part move effectively reset the market, washing out excess leverage and preparing the ground for the next impulsive cycle.
From that low, Bitcoin launched into a textbook five-wave impulsive rally.
This initial leg down, labeled wave (a), suggested that a larger corrective phase was now underway, replacing the bullish momentum with profit-taking and distribution.
That’s a textbook case of Bitcoin Elliott wave analysis . But notice: it wasn’t clean. Some traders counted the waves differently. Some saw extensions or truncations. That’s the thing with Elliott — interpretation matters as much as the rules.
Elliott Wave Theory Rules and Flexibility
The classic Elliott wave rules say things like: Wave 2 can’t retrace more than 100% of Wave 1. Wave 3 is never the shortest impulse wave. Wave 4 can’t overlap with Wave 1 in most cases.
But in practice, Bitcoin often blurs these lines. Extreme volatility, liquidation cascades, and macro shocks can distort wave counts. That’s why even seasoned analysts will say, “This is my Elliott count,” not the Elliott count.
The takeaway? Think of Elliott as a lens, not a lawbook.
Tools That Pair with Elliott
Many traders use the MT5 Elliott Wave Indicator or TradingView drawing tools to sketch their wave counts. Despite the waves becoming far more meaningful when tied to other signals:
Fibonacci Retracements: For example, watching how corrections line up with golden pocket levels. Momentum Oscillators: That confirm or contradict the wave structure. Macro Sentiment: Shifts that often align with corrective or impulsive phases.
Elliott Wave Theory trading doesn’t exist in a vacuum. Used alone, it’s like trying to predict the weather with just cloud shapes.
Why Beginners Should Care
If you’re new, you might be asking: “ Okay, but why bother with this at all? ” The answer: Elliott Wave Theory explained the psychology behind price swings long before the existence of cryptocurrency. It captures the human emotions behind markets — fear, greed, doubt, euphoria. And Bitcoin, perhaps more than any other asset, runs on psychology.
So whether you’re sketching waves, testing them on the Bitcoin Elliott wave chart , or just trying to understand why BTC always seems to surge then collapse, this framework helps put the chaos into context.
Final Thoughts 🌊
What is Elliott Wave Theory in trading? It’s not a magic formula. It’s a structured way of looking at markets through recurring patterns of optimism and pessimism.
And just like with every other tool we’ve discussed, it’s not about using it alone. The best insights come when you combine the Elliott Wave principle with other indicators: Fibonacci, moving averages, and even plain old support and resistance.
So the next time someone posts a “ wave count ” on a Bitcoin Elliott Wave analysis, don’t take it as gospel. Treat it as one possible map of where we are in the cycle. Because in trading, it’s never about certainty. It’s about perspective.
This analysis is performed on historical data, does not relate to current market conditions, is for educational purposes only, and is not a trading recommendation.
SELL BTCUSD for bullish divergence trend reversal STOP LOSS: 116
SELL BTCUSD for bullish divergence trend reversal STOP LOSS: 116,945
Regular Bearish Divergence
In case of Regular Bearish Divergence:
* The Indicator shows Lower Highs
* Actual Market Price shows Higher Highs
We can see a strong divergence on the MACD already and There is a strong trend reversal on the 4hour time frame chart.....
The 4 hour time frame is showing strength of trend reversal from this level resistance so we are looking for the trend reversal and correction push from here .....
TAKE PROFIT: take profit will be when the trend comes to an end, feel from to send me a direct DM if you have any question about take profit or anything
Remember to risk only what you are comfortable with........

Bitcoin Bollinger Band ChartThis TradingView chart of Bitcoin combines Bollinger Bands, RSI, and Stoch RSI, giving a well-rounded view of price action and momentum. The Bollinger Bands help identify volatility and potential breakout or reversal zones when price touches or moves outside the bands. The RSI highlights overbought or oversold conditions, signaling when momentum may be stretched. The Stoch RSI adds an extra layer of precision by showing faster shifts in momentum within those RSI levels. Together, these indicators provide traders with insight into both market trend strength and potential turning points.

Playing the Short-Term Setups with Clear Risk/RewardPlaying the Short-Term Setups with Clear Risk/Reward
Is BTC going to rally or are we living the end of a cycle? Would love to read your opinion in comments :)
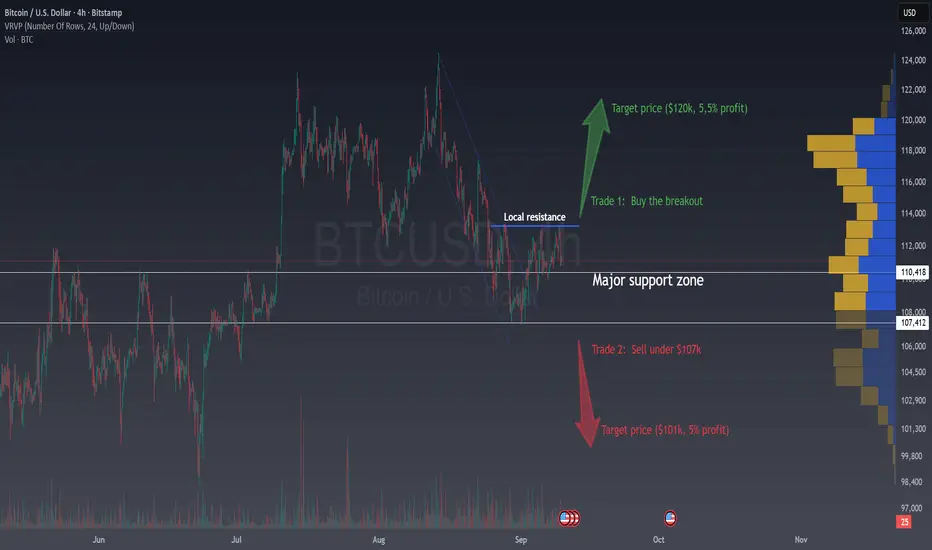
I’ve mentioned before how crucial the $107k level is in the bigger picture, and I still stand by it.
It’s a major support zone and losing it could open the door for deeper corrections, as stated in the previous idea.
But as traders, we don’t need to predict the future months ahead. What makes me smile is finding clear, short-term opportunities with solid margins.
Right now, price is testing a local resistance.
🚀 If we get a clean breakout, I’m looking to go long , aiming for about +5.5% upside with just 1.5% risk (stop loss). That’s the kind of asymmetric setup I love.
📉 On the flip side, if Bitcoin slips below $107k, instead of panicking, I’ll look for the fast and easy short trade.
The idea is to capture a quick 5% downside move with again a tight 1.5% stop loss , knowing that volatility and rebounds in these zones make hard to hold a long term bearish position.
👉 I’m not here to predict the “final direction” for the long term.
I like to focus on trading with safety, confidence, and wide profit margins in the short term. That’s where my consistency is built.
Can Bitcoin still break through the highs?Today, Bitcoin's price has moved upward to test the key resistance level we mentioned earlier as expected, and this trend is fully in line with our previous strategic prediction of "exchanging time for space". Looking back at the previous market consolidation phase, we repeatedly emphasized that "there is no need to rush for short-term operations; let the bullets fly for a while" — this judgment was based on the understanding that the market needs time to accumulate momentum and wait for the trend to become clear. Now, as the price gradually reaches the target resistance level, the strategy of holding positions patiently in the early stage has reached a realization node. Currently, we can prioritize taking partial profits by closing some positions: this move not only locks in the considerable profits already obtained and avoids profit retracement caused by market pullbacks but also retains flexible space for subsequent operations.
From the perspective of subsequent market deduction, if the price is accompanied by significant volume expansionwhen testing the resistance level this time and successfully breaks through it, it indicates that the bullish momentum already has the energy to continuously drive the market. At this time, there is no need to rush to chase the rally; instead, we can wait for the price to retrace to confirm the validity of the breakout before following up to add positions and seize the new round of upward market. If the breakout fails to be supported by volume, we need to be alert to the risk of short-term pullback and maintain the existing positions for observation. In addition, we need to focus on the next resistance level above — around the 118,000 mark. This level is not only an important resistance zone formed by previous transactions but also highly correlated with market psychological expectations, and will become a core node for whether the subsequent market can further open up upward space.
If you lose your direction amid such market moves, you can follow me or leave me a message.

September 11 Bitcoin Bybit chart analysis (CPI)Hello
It's a Bitcoin Guide.
If you "follow"
You can receive real-time movement paths and comment notifications on major sections.
If my analysis was helpful,
Please click the booster button at the bottom.
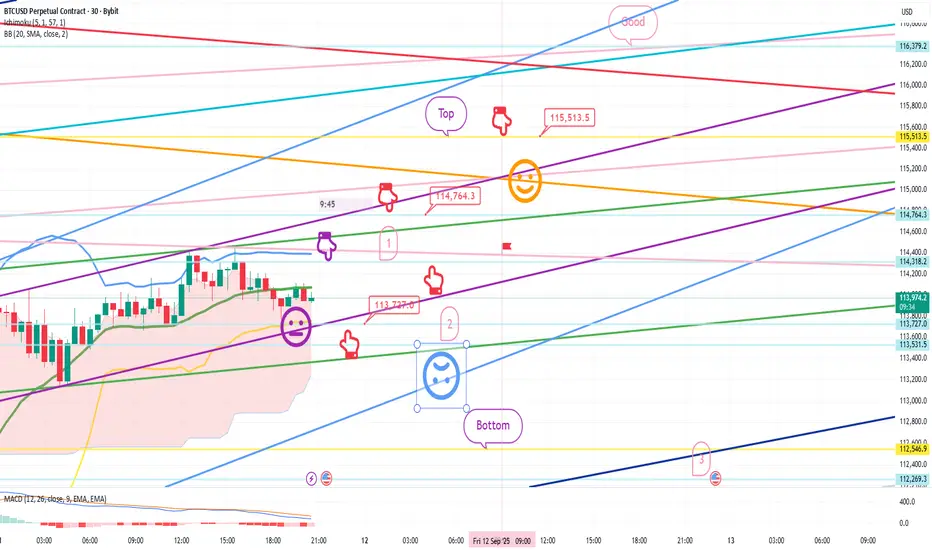
This is Bitcoin's 30-minute chart.
The CPI indicator will be released shortly at 9:30 AM.
I implemented the strategy based on Nasdaq movements.
*When the red finger moves,
Long position strategy
Confirm the upward wave by touching the first section above (autonomous shorting)
1. $113,727 long position entry point / Stop loss if the light blue support line is broken
2. $114,764.3 long position 1st target -> Top 2nd -> Good 3rd target
If the daily candlestick forms before 9:00 AM tomorrow,
you can switch to a short position if the top section is touched.
You can also use the first section shown as a long position switching point.
If the price falls immediately without touching the purple finger at the top, the final long position is at the second level. The strategy was to place a stop-loss order from the breakout of the light blue support line until the possibility of a sideways movement.
From the breakout of the light blue support line, the price opens up to the bottom -> level 3, so long positions should be cautious.
Please use my analysis to this point for reference only.
I hope you operate safely, adhering to principled trading and a stop-loss order.
Thank you.
Precise Prediction and Forecast for BTCUSD MarketYesterday, we accurately predicted that BTC would rally to around 116,000 USD and face certain resistance. Today, after breaking through 116,000 USD as expected, the price retraced to hover around 115,000 USD.
Looking ahead, if BTC can stabilize near the 115,000 USD level, it is highly likely to continue its upward trajectory, with the potential to retest the 120,000 USD mark. For upper resistance, the focus remains on the 117,000–118,000 USD range
Buy 114000-114500
TP 115000-116000-1175000
Daily-updated accurate signals are at your disposal. If you run into any problems while trading, these signals serve as a reliable reference—don’t hesitate to use them! I truly hope they bring you significant assistance

Short-term analysisAs mentioned in the previous analysis, the price reached the **116** level, and now, due to the prevailing weakness, if confirmed, there is a possibility of a correction down to the **114.160** area.However, at the time I’m posting this analysis, trading volume is very low, so the likelihood of fake moves is high.

BTCUSD 4-Hour Chart AnalysisLooking at the BTCUSD 4-hour chart, the price has recently exhibited a dynamic trend. After a prior upward movement, it underwent a pullback. Now, it has found solid support at the 112,500 level. This support zone appears reliable, as the price has stabilized above it, indicating that buying interest has emerged here to prevent further declines.
In terms of resistance, the 116,000 level is a key hurdle to watch. If the price can successfully break through 116,000 with strong momentum, it would open the door to further upside potential. Before that, the 115,000 level could act as a near-term resistance to test the bulls' strength.
For traders, the strategy could be to monitor the price action around the 112,500 support. If the support holds and there are signs of a bullish reversal , it may be an opportunity to consider long positions with a target towards 115,000 and then 116,000. Conversely, a breakdown below 112,500 would shift the bias to the downside, with the next support level to watch at 110,640
Overall, the near-term trend hinges on the price's interaction with the 112,500 support and the subsequent attempt to challenge the 115,000 - 116,000 resistance zone.
Buy 112500 - 113500
TP 114500 - 115500 - 116000
Daily-updated accurate signals are at your disposal. If you run into any problems while trading, these signals serve as a reliable reference—don’t hesitate to use them! I truly hope they bring you significant assistance

Btc levels We hit the 116,353 with a high of 116358
We are currently at the 115,484 level looking to test the 116,353 again im looking for 117001 if we break lock in profits at levels

possibility of uptrendIt is expected that a trend change will form within the current support level and we will see a continuation of the upward trend to the resistance trend line. If the price crosses the support level, the downward trend will continue to the next support levels.

"Bitcoin Bulls in Control | Key Targets Ahead"Bitcoin is currently trading around 115,000 – 115,300, holding strongly above the trendline support. The overall structure is bullish, and buyers are pushing momentum higher.
✅ Entry Zone (Buy Area): 115,000 – 115,300
🎯 Target 1: 119,000 (first bullish target / short-term resistance)
🎯 Target 2: 124,000 (extended bullish target / major resistance)
🛑 Stop Loss: Below 113,800 (if price closes under trendline support)
Price bounced after a corrective move and is now moving inside an upward channel.
Both Ichimoku and volume action confirm bullish momentum.
As long as price holds above 113,800, buyers remain in control and the market has strong potential to reach 119k – 124k.
⚖️ Risk–Reward Ratio: Attractive upside potential with a safe stop-loss level, making it a solid bullish setup.

BTC Today’s Elliott Wave outlook for Bitcoin points to the continuation of its current wave structure. Traders should track the wave count carefully and wait for confirmation before taking positions


Bitcoin to Face Heavy Resistance Ahead?BTCUSD is approaching a strong supply zone 🔴 around $118K – $120K, where sellers previously stepped in. If price rejects here, we could see a sharp drop back toward the $102K – $104K support line.
📊 Current Price: $115,997
⚡ Bias: Bearish rejection at resistance
📍 Key Levels:
Resistance: $118K – $120K
Support: $102K – $104K
🔎 What I’m Watching:
Reaction once BTC hits the red zone 🔴.
Any bearish candlestick patterns confirming rejection.
Possible swing trade short opportunity targeting $104K.
❓ Do you think Bitcoin will break through $120K or dump hard to $104K? Share your thoughts 👇
