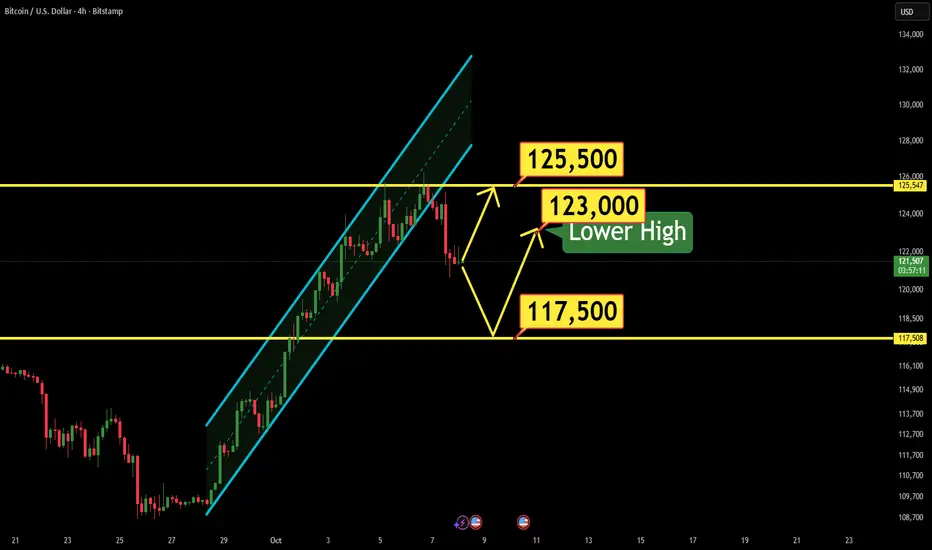
For Bitcoin, what matters isn’t the direction — it’s the timing.Bitcoin has moved outside of its upward channel, signaling potential weakness in the current structure. The first significant support lies around $117,500, though there is a minor level near $120K — its strength remains uncertain. On-chain data indicates that large holders have been transferring BTC to exchanges to take profits around all-time highs, adding selling pressure. Even if price rebounds from $117,500, the move is likely to result in a lower high formation. For the broader uptrend to regain credibility, Bitcoin must reclaim the $123K level with strong volume.
BTCUSD.PI trade ideas
BTC LAST 3-DRIVE EFFORT TO 127-128K TARGETMorning folks,
So, we're done with 2-3 weeks journey of reverse H&S patterns as BTC has hit our 126K target. Unfortunately we haven't got another chance to enter on last Thu, as we hoped, but now it is done already...
Since we have all-time BTC AB=CD target around 127.10K, we suggest that price could try to make a last upside effort via 3-Drive pattern to complete it.
Thus, if you have longs, you could try to hold them until target will be met. In fact, if you want to could initialize a new intraday setup, with tight stop, somewhere below 122K area.
We consider no shorts by far. Situation slowly is preparing for the pullback, but not yet. Major target have to be done first.

SEND IT !!!!! BITCOIN LONG ALERT !!!!!!!This reminds me of COVID crash , chart looks similar to 2019 2020 covid period.
LONG AND STRONG

BTC/USD - High Volume Control🚨Price travels from one Institutional high-volume area ➡➡️
🚨To the next Institutional High-Volume area: POC- Points of Control✅🎯
❌Avoid chasing between levels.
✅In some cases where key volume areas are far apart - draw a 50% line.
✅This may act as an interim support, resistance and/or consolidation areas
---------------------------------------------------------------------------------------------------
🎯 KEY PIVOT
📍 Zone Type: ATH SUPPLY/RESISTANCE
📊 Price Range: 123,000-124,500
📏 Distance: 296-1,796 pips ABOVE current price with strong rejection history
📊 MAIN BIAS
🔴Bias: NEUTRAL-BEARISH
📌 Context: Multiple rejections from ATH resistance zone
💎 DIAMOND EDGE - Primary Setup
🎲 Direction: BEARISH from 123,000-124,500 WHEN PRICE RALLIES TO IT
🔍 Confirmations:
⚠️ NOTE: Wait for price to rally back into supply zone before shorting
✅Bearish rejection wicks forming AT 123,000-124,500 zone
✅Volume expansion on sell-off AT resistance zone
🎯 Targets:
T1: 117,000-118,500
T2: 109,000-110,500
T3: 104,000 area - in case liquidity is required
🔄 BIAS FLIP SETUP🟢
⚡ Trigger: Decisive 4H close above 124,500
🎲 Direction: BULLISH from 123,000-124,500 ON breakout reclaim
🔍 Confirmations:
✅Strong bullish breakout close above 124,500 with volume
✅Successful retest of 123,000-124,500 holding as support
🎯 Targets➡️➡️DISCOVERY:
📈Breakout extensions:
T1: 129,000+
T2: 137,000+
⚠️ SESSION RULES
🕐 Trade high-volume sessions
📰 Monitor crypto market catalysts and regulatory news
💡 Respect multiple rejection history at resistance zone

This month is likely the BTC cycle topWhat do you guys see in this chart? This month could really be the top. 35 Months bottom to top for the last 2 cycles.

BTCUSD POSSIBLE MOVEMENT MUST READ CAPTIONHello traders here is my first idea about BTCUSD please share your thoughts on it and dont forget to comment
Key Points
Current price 125400
Target area 1 122000
Target area 2 116000
Follow us for more updates on BTCUSD and share our ideas with your friends and family

Do I have a crystal ball or what ?As the title says….. please see linked ideas for context.
Both SPX and BITCOIN are dumping as expected.
I’m on vacation, so can’t give the analysis you’re usually use to but in all honesty, see you all at the next stop for bitcoin (see chart) and eventually to sub 104k.

BTCUSD NEXT POSSIBLE MOVE BTC is showing potential weakness around key resistance.
If price fails to hold above this zone, a correction move can be expected toward lower levels.
Currently, the market structure suggests sellers might gain short-term control — but confirmation is still required before any strong move.
⚠️ This is only a possible scenario — wait for clear breakout and confirmation before entering.

Bitcoin 1470 dayish cycle coming to an endFall to $50k-$60k unless some kind of government policy changes the narrative. It doesnt look that price will increase past the end of the of the year. Historically followed by a 350 dayish fall of maybe 70%.

don't FOMO and chase the high price for BTCUSDMarket would have you believe that you are LATE in the game and need to get in asap! We can see that this is the 3rd attempt to break above and a current bearish pin bar is evident that near term , prices should pull back.
Be patient and wait for the pull back unless of course you still believe BTCUSD could goes up to 500k as some gurus predicted.

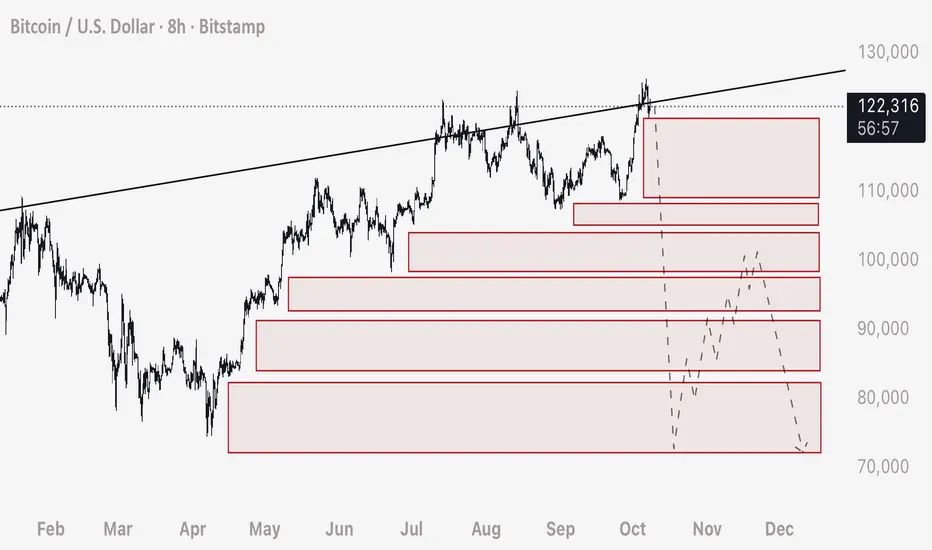
Using Order Blocks to Predict Price Movement on HTFExpanding on my previous post, we can apply this technique to predict price movement on the higher time frames (8 Hour in this case).
Step 1 - Drawing the Boxes
- Fundamentally what we want to do, is look at the price movement and figure out where clusters of stop loss would be contained.
- To do this, we want to look for the areas of upwards (in this example) consolidation that hasn’t dropped down to trigger the orders.
- I have drawn boxes here close to the candle set, and extended them out past where price currently is to prove that these areas have not been reclaimed or had the stop loss orders triggered.
PLEASE NOTE: Stop Loss orders and Liquidation Orders are very unique. Unlike limit orders that will automatically fill if price is above or below, these orders do not fill unless price CROSSES the exact price of the order. In essence, it’s important to understand that looking back on the chart we can understand there are limit orders for sells (in this example) that’s below the current price. If a limit sell order was to be placed at a lower price, it would fill automatically if price is above.
- We can anticipate a take profit (locally in this example) at 74,000. SHORT entry should be where the orders begin to set off to a large degree, in this example, entry would be BELOW where price currently is, at 122,200. We want to make sure that the stop loss orders will be enough to carry the price through these blocks. Stop loss can be places above the local wick high (where the SHORT stop losses have already been filled) at 123,900.
Step 2 - Predicting and Understanding Wick Speed
- To predict how fast the movement will complete, we need only evaluate the amount of TIME allowed for positions to be placed (longs in this example). Very simply because the more time provided to traders in an upwards consolidation, the more positions and consequently stop losses and liquidations will be placed below the price.
- More TIME = More Orders = Faster Wick Speed. To understand this another way, imagine there was 2 scenarios where regular limit buys were placed. Scenario 1 has 100 people placing buy orders, Scenario 2 has 10,000 people placing buy orders. Scenario 2 would move price higher at a faster speed, and to a greater distance. In other words we are predicting VOLUME of STOP LOSS ORDERS.
PLEASE NOTE: Stop Loss orders move price at a greater volume compared to the position entry. If Trader A uses $1,000 to open a Long, and uses a leverage of 10x - his Stop Loss or Liquidation order is to close the entire leveraged position size. While he is injecting $1,000 of liquidity into the market with his order, he is consequently leaving a sell order underneath his entry for $10,000 (leveraged position size).
PLEASE NOTE: The placement and amounts contained in stop losses or liquidations are not available to the public. Exchanges do not need to disclose that information, and you can assume it’s only shared with the market makers or liquidity providers. Heatmap Platforms such as Coinglass have disclaimers that state it’s not based on true date and is only a prediction.
SUMMARY:
I hope this serves you with a practical demonstration of how we can use Stop Loss analysis to predict price movement.
I also hope that you can understand you’re able to do this yourself by developing the vision to quickly see it in the chart. We are blessed in that we simply need to look backwards to see where we will be going next, as the orders that move Bitcoin are previously embedded in the chart.
Yours truly and all the best,
- DD
If you have any questions or want further clarifications - please ask in the comments and I will answer you.
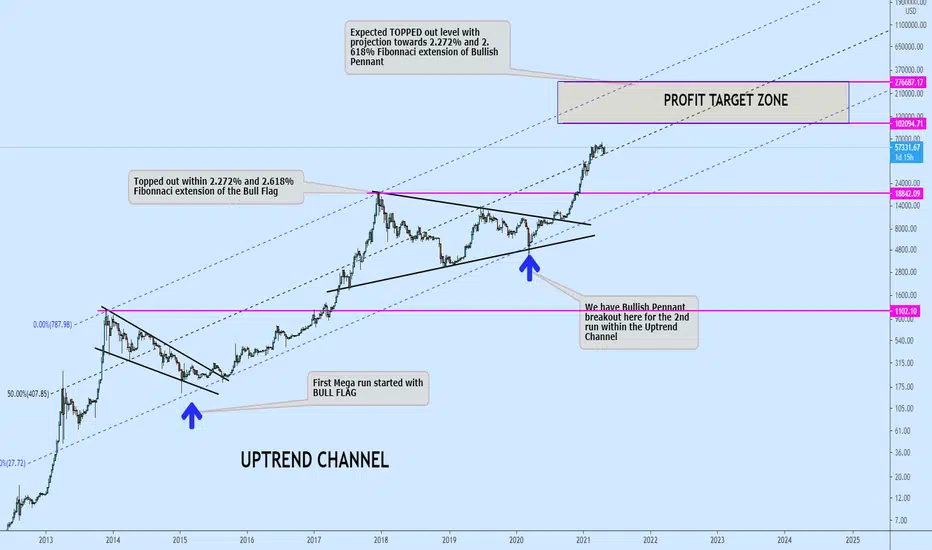
Bitcoin channel targeting 100k-250k rangeHello guys,
Its been a while on here, today I decided to bring my latest research for everyone to have a look at. Well, as we all know BTC has been holding up within Rising or uptrend channel, this channel is very promising with huge potentials. If you are familiar with my previous post where I talk about the rising channel, the post is shared here:
We are currently trading above the median of the channel which mean the next priority is testing on the upper line of the channel and is coincidence to one of my previous idea of bullish pennant which have target towards the top of the channel.
This is not a trading signal but just a potential decision making idea to know the most dangerous zone to watch for.
Thanks.
BTCUSD : It is never different this timeAs anticipated, $108,800 proves to be the line to watch. Price bounces upward in a strong momentum, to fulfill its destiny to meet F at the appointed time.
It seems that everything I read nowadays is saying BTC is a sure bet.
Please exercise caution.
Good luck.

BTC/USD – 15m Symmetrical Triangle SetupPattern: Symmetrical triangle after a strong bullish impulse. Market is consolidating inside narrowing support & resistance. A breakout is likely soon.
Bullish Scenario
• 📈 Entry: Buy above 123,000–123,100 (confirmed breakout)
• ⛔ Stop-Loss: Below 122,500
• 🎯 Take-Profit 1: 123,892 (major resistance)
• 🎯 Take-Profit 2: 124,500+ if momentum continues
• 🔄 Option: Wait for retest of 122,750 zone before entry
Bearish Scenario
• 📉 Entry: Sell below 121,700–121,800 (confirmed breakdown)
• ⛔ Stop-Loss: Above 122,300
• 🎯 Take-Profit 1: 120,764 (major support)
• 🎯 Take-Profit 2: 120,000 psychological round number
Break up = aim for 123,892+
Break down = aim for 120,764

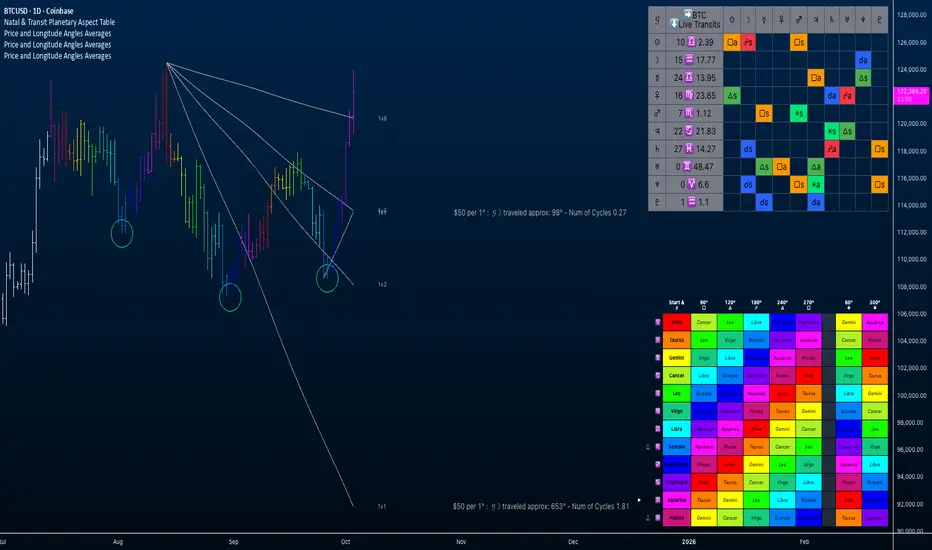
Bitcoin - Lunar Cycles and Price & Longitude AnglesEducational Idea
This chart integrates lunar cycles with price and longitude angles to illustrate how Bitcoin reacts to cyclical patterns. The purpose is educational: to show how these tools can be organized and analyzed, not to recommend taking long or short positions.
1. Bar Coloring by Lunar Cycle
* All bars begin as **white**.
* Once you anchor the price–longitude angles, the bars are colored based on the Moon’s longitude (0°–360°).
* In the indicator settings, you can toggle “Show/Hide Orbital Color” to switch this on or off.
*The colors correspond to the Longitude Relationship Table , specifically the first column , where the anchor sign is indicated alongside the start/conjunction symbol.
* This enables you to visually track the current bar alignment with the Moon’s progression through the zodiac.
* The table is read from the anchored bar, which establishes the starting reference.
* The white pointer tracks the Moon’s progression in relation to the anchor.
How to Read the Longitude Relationship Table
Anchor Sign (first column): Wherever you set your anchor bar, the anchor emoji will appear here next to the zodiac sign along this column.
Reading Across: Move across the row of that anchor sign to see the angular relationships it forms with other signs.
Color-Coding: Each aspect is color-coded to match the bar coloring (same scheme as the orbital coloring).
Example:
If the anchor is at Aries (♈︎) →
Cancer (♋︎, light green) is a 90° square from Aries.
Leo (♌︎, orange) is a 120° trine from Aries.
And so forth across the row.
This adds a layer of analysis that will be discussed in the future.
Observations:
* Over the last three swing lows, Bitcoin has dipped during the Scorpio → Sagittarius ingress. (Light blue to Dark Blue)
* Several pivot highs have appeared near the Pisces → Aries ingress.
* At present, the Moon is in Aquarius , placing us between these repeating zones.
---
2. Price–Longitude Angles
* $50/degree Moon angles from the all-time high (ATH) with price breaking over the 1 x 8 angle.
* A new fan anchored from the September 25th low, offering a second active set of angles.
---
3. How to Read the Natal vs Transit Aspect Table
Columns (across the top): Bitcoin’s natal planet positions from the Jan 3, 2009 first trade chart.
Rows (down the side): Current transit planet positions.
Cells (where row + column meet): Show the aspect between the transit planet and the natal planet.
Example: Today, Venus (transit row) is applying a conjunction to Bitcoin’s natal Saturn (column) — this is displayed as a blue cell with the conjunction symbol (☌a).
To read the table: follow left to right across the row of the current transit planet, and compare against the natal planet columns.
---
Takeaway
* The Moon’s cycle(~27–28 days) has coincided closely with recent highs and lows.
* Anchored price–longitude angles give additional structure, tying price back to both historic (ATH) and more recent (Sept 25) pivots.
* Bar coloring provides a direct visual cue for where the price sits in relation to the Moon’s orbital cycle, guided by the longitude relationship table.
* These methods are not directional calls — they’re tools for understanding cyclical context in the market.
BTC/USD: Danger Zone Ahead—Here’s What I’m Watching Take a close look at what’s happening now. BTC/USD is on the edge at 111,060, and if that breaks, the next major levels are 106,470, 103,200, then possibly even 100,000. Markets can shift fast; are you prepared with clear levels and a plan, or will you get caught reacting?
If you’ve ever felt unsure about how to spot big moves before they happen, or wondered how some traders seem to always stay one step ahead, you’re not alone. What’s the one thing you wish someone had told you when the market started moving fast? What’s your biggest struggle when the price gets volatile?
Drop your thoughts or questions in the comments
Or if you want to dig deeper, my inbox is always open for a real conversation. Sometimes the right question is all it takes to unlock a breakthrough. What do you want to see covered next?

BITCOIN Will Go Higher! Long!
Please, check our technical outlook for BITCOIN.
Time Frame: 1D
Current Trend: Bullish
Sentiment: Oversold (based on 7-period RSI)
Forecast: Bullish
The market is approaching a significant support area 116,693.38.
The underlined horizontal cluster clearly indicates a highly probable bullish movement with target 123,791.64 level.
P.S
Please, note that an oversold/overbought condition can last for a long time, and therefore being oversold/overbought doesn't mean a price rally will come soon, or at all.
Like and subscribe and comment my ideas if you enjoy them!

BTCUSD Setup You Can’t MissHey everyone, Kilian here!
The Bitcoin market keeps showing positive signals as the uptrend holds steady. On the technical chart, a double bottom pattern is gradually taking shape, with the first low followed by a higher low, a clear sign that buying pressure is building. At the moment, price is trading just above the neckline, a critical level that many analysts see as the key decision point for the next move.
If price holds above the neckline and confirms the breakout, the bullish scenario aiming toward 124,625 becomes stronger. But if the market slips back below this level, it could signal buyer weakness and raise the risk of a reversal.
As always, traders should wait for clear confirmation before entering, and stick to strict risk management rules in this volatile environment.
Trade safe and stay disciplined.

Bullish Wolfe WaveA textbook bullish Wolfe wave has formed with equal timing on the waves. This could be an entry with the target being the previous high

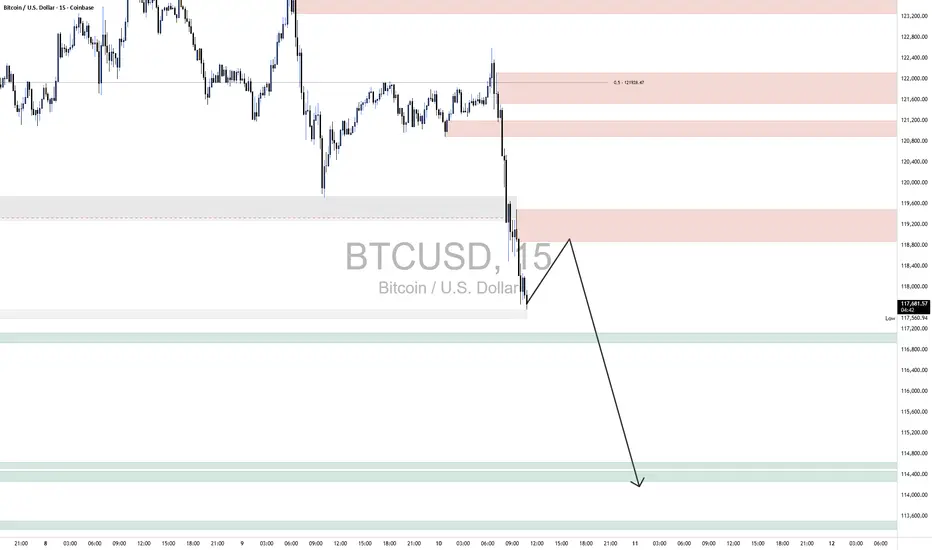
BTCUSD ShortThe broader market structure on BTC/USD (15-minute) is firmly bearish, confirmed by a decisive Change of Character (CHoCH) around 119,400, where price broke below a prior higher low and initiated a structural shift. This was followed by strong impulsive downside movement, confirming that sellers are now in control. The previous bullish structure has been fully invalidated, with clear lower highs and lower lows forming as price continues to respect supply levels while failing to hold at short-term demand zones.
The upper supply regions between 121,000–122,000 and 119,200–119,600 remain strong, as each time price reached these areas, sellers reacted with high momentum and wide-bodied bearish candles—evidence that institutional orders are likely resting there. In contrast, the nearby demand levels between 117,200–116,800 and further below at 115,000–114,400 are untested zones from prior consolidation. While buyers may attempt to defend these regions, the sharp downward momentum suggests the upper demand may not hold if retested quickly.
Within the marked region, price is consolidating slightly after a steep selloff, showing small-bodied candles with lower wicks but no strong bullish follow-through. This suggests temporary absorption before another leg lower. A minor retracement toward 118,400–118,600 (a re-test of the broken structure and lower supply) is possible before continuation to the 116,400–115,000 demand range. If that deeper zone is reached, a more meaningful bullish response could occur as short sellers begin to take profit.
Footprint analysis (if observed here) would likely show heavy sell imbalances and stacked negative delta at the lows, confirming aggressive market selling pressure. Volume tapering slightly on this decline would indicate temporary exhaustion, but until clear absorption or a delta flip appears near demand, buyers remain weak.
Trade bias: bearish continuation, with potential short entries on pullbacks to 118,400–118,600.
Key invalidation level: sustained break and close above 119,600, which would signal a structural shift and invalidate the bearish bias.
Momentum: strongly favors sellers; no divergence or reversal pattern visible yet.
There’s no major macro catalyst driving this move at present—price action remains purely technical, guided by order flow and supply dominance.
BTCUSD-SELL strategy Monthly chart GANN SQIt has been impressive moves till now, and we hear clearly what the forecasts are, i..e. $ 500k by 2030 etc. Happy for those longs, if it does. Technically we are very overbought for a long-time now, and also the chances are for a solid correction is there. the GANN SQ surely suggest ther higher side still could be $ 130k or so, but the return level $87 k and $ 63 k seems very possible from a correction stand point of view. for the medium-term. Markets are very long adding to that, and if they start unloading in large quantities, moves down will be extremely sharp. Anyway, this is my personal view, and let's see what will happen next.

BTC / USD Yeni Rekor Geliyor Mu?Hello everyone,
Dear investors, my analysis indicates that Bitcoin could reach 133,000 within the next week. I believe profits will be realized again at this point.
This is not investment advice; I wish you abundant profits.

BTC WeeklyBitcoin has always moved in repetitive cycles: a strong bull run, followed by a correction phase, and then starting a new rally from the lows. If we look at its price history, we can clearly see that these cycles repeat every few years with very similar patterns.
Right now, Bitcoin is in a position that looks very similar to the past cycles. When we align these patterns, it suggests that another correction could be ahead.
🔹 In my opinion, based on these cycles, Bitcoin could see a deeper pullback over the next year and even drop to around $47,000.
Of course, this is just a personal view based on past market behavior and not a guarantee — but history shows Bitcoin has repeated this path many times.
