BITCOIN IS GOING NUTSit's very common to see this happening in crypto the big candles and the sudden trends are just how we make big money let's go for another trade
BTCUSD.PI trade ideas

Bitcoin At All-Time-High... And ResistanceBitcoin looks bullish on high time frames. We have a weekly close right at resistance, so we want to see some follow through.
Remember, it make a new all time high on a weekend, so we really want to see a sustained push. We are at the range highs, which means at resistance as well.

SELL BTC TO 75k*I am in no way a financial advisor and you should always do your own due diligence before placing any trade. Do not trade what you are not comfortable with losing. No trade is guaranteed.
Sell with stop loss above structure , Take profit at 78,000

$BTC / $GOLDCRYPTOCAP:BTC / TVC:GOLD 🔃
2013 | 1 Btc = 1 Gold
2017 | 1 Btc = 16 Gold
2021 | 1 Btc = 37 Gold
2025 | 1 Btc = 31 Gold \ More is coming
In December 2024, 1 Bitcoin was worth 41 gold, but there was no monthly close above the 2021 ATH level.

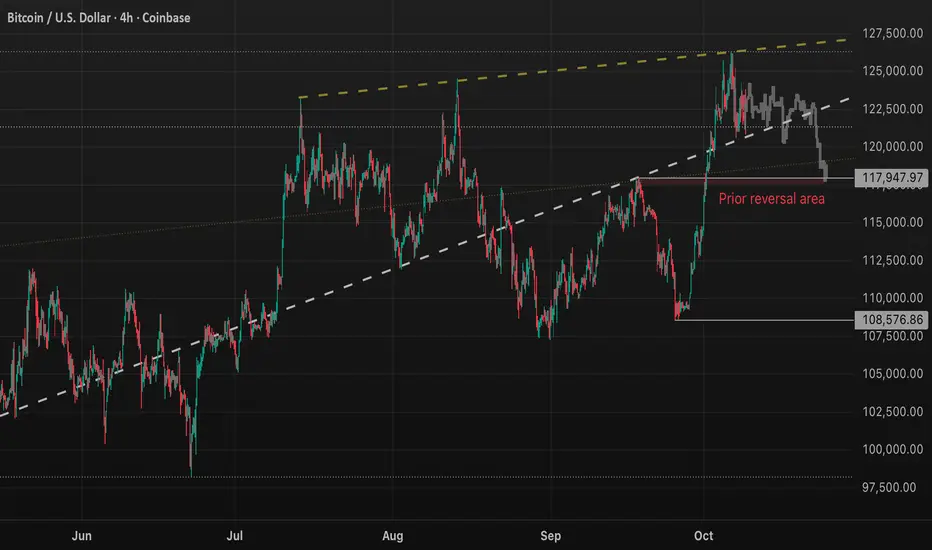
Could we see another July-type ATH-reversal play out?Current post-ATH price action has been bearish. Though we have entered another area of low volatility.
I cloned then reduced the volatility of the July ATH-reversal by fitting to the most recent ATH-reversal price action. The reversal low is set to an area ~117k that has prior been an area of resistance/support and trend reversal.
Gold Showed the Way... Is Bitcoin Next?Gold began a parabolic run after breaking through the Fibonacci 1.382 – 1.414 zone.
Now Bitcoin is gathering strength at the same threshold...
Historical similarity in setup
Gold broke through and became parabolic.
Next up Bitcoin
History often maps out the future.
Bitcoin, the “digital gold,” is preparing for its own run.
CRYPTOCAP:BTC Vs. TVC:GOLD 🔃

BTC - Thought experiment The red vertical lines indicate 24hr periods.
I'm visualizing order flow & liquidity at these levels of interest with the risk and take profit target perspectives for different types of traders.
I've added fib levels to help target the upside highs and see the correlation between then lower fib levels and my 4 candles I look for which create 6 types of levels. I mark all 6 levels, usually just the greediest ones that minimize risk or which are telling the strongest story.
Lets see if this tug of war gives us a good chart replay in few days.

BITCOIN Are we going to see 'UPTOBER' this time??Bitcoin (BTCUSD) has historically seen incredible rallies during the month of October and even more so those Octobers of the last years of Bull Cycles, like the one we are at now. Those rally phases have been very accurately called 'Uptober' rallies.
More specifically, the last three such Octobers (2021, 2017 and 2013) have been massively bullish, all starting after September corrections (Channel Down patterns). In 2013, October reached the 2.382 Fibonacci extension from September's correction, in 2017 and 2021 it reached the 1.786 Fibonacci ext.
As a result, if 'Uptober' is repeated again, this historic price actions gives us an optimistic Target at $132k (Fib 2.382) and a less optimistic one at $125.5k (Fib 1.786).
Do you think we will get such Uptober one more time? Feel free to let us know in the comments section below!
-------------------------------------------------------------------------------
** Please LIKE 👍, FOLLOW ✅, SHARE 🙌 and COMMENT ✍ if you enjoy this idea! Also share your ideas and charts in the comments section below! This is best way to keep it relevant, support us, keep the content here free and allow the idea to reach as many people as possible. **
-------------------------------------------------------------------------------
💸💸💸💸💸💸
👇 👇 👇 👇 👇 👇

PUMPTOBER: History Repeats Faster (x1.25 in 30 Days?)🚀 PUMPTOBER: History Repeats Faster (x1.25 in 30 Days?)
Bitcoin doesn't break the pattern — it compresses it.
We've now transitioned from mania to maturity, and the chart says it loud and clear:
⏱️ The Compression Pattern:
📍 October 1st, 2017 — x5 gain in 60 days
📍 October 1st, 2021 — x2.5 gain in 45 days
📍 October 1st, 2025 — x1.25 potential in 30 days?
(Current price: $114,000 → +25% pattern target: $142,750 )
This isn't speculation — it's rhythm.
The cycle continues, but it's compressing: faster timelines, tighter gains, greater capital efficiency.
🔍 Current Structure:
BTC/USD opened October 2025 at $114,000 .
It's currently sitting just under key short-term resistance, with support around $107,851 and Fib confluence at $112,927 .
Professor's roadmap shows:
→ Primary Target : $138,888 (my technical target)
→ Extended Target : $174,840 (if euphoria returns)
→ Macro Support Zones : $107,851 → $100K → $89,313
📊 Chart Elements:
→ Three vertical cyan lines mark each October 1st cycle start
→ Yellow circles highlight the exact price level each October 1st
→ "WE → ARE → HERE" progression visually aligns the cycles
→ Clear visual anchors: 2017 (x5), 2021 (x2.5), 2025 (x1.25?)
📈 The Maturity Thesis:
As Bitcoin matures, its market cap expands — and explosive gains give way to efficient moves .
A 25% rally at this level isn't small — it's a $29,000 gain in 30 days.
In 2017, that required chaos.
In 2025, it might only require structure.
The chart doesn't scream anymore. It whispers. But the message is still bullish.
💡 Thought of the Day
"Cycles don't die — they evolve.
x5 was hype.
x2.5 was influence.
x1.25? That's adoption speed.
Same heartbeat. Just faster...
oh! and Trump needs Jesus to take BTC higher so the debt seems smaller."
📌 Disclaimer
This analysis reflects my personal market observations and is not financial advice. I am not a licensed financial advisor. All trading carries risk. I am just the best you will find in Provlepsis through Prognosis. Just remember to follow the levels: I buy over and I sell/short under all major levels on my chart.
One Love,
The FXPROFESSOR 💙
→ I know you want to know about Alts... we will get there too in the days to come.

Bitcoin (BTCUSD): Bearish Short SetupHello everyone, Kilian here.
Let’s take a closer look at BTCUSD with a logical and structured approach.
Currently, the market is showing a classic bearish formation. The price has broken through a key support level and the first signs of dominant short-side pressure are already visible. This is not just noise but a signal that short positions are gaining control.
After the breakdown, the market is pulling back to retest the broken area. In technical analysis, such a retest often confirms that the bearish momentum is intact and that short traders remain in charge.
Given this context, it is unlikely that BTCUSD will recover the old support, which now acts as resistance. A rejection from this level could trigger the next short-driven move, with a projected target around 118,200.
Unless a strong reversal emerges, the probability remains in favor of continued downside pressure.
Stay disciplined, follow the signals carefully, and remember that in trading, logic and risk management always outperform emotions.

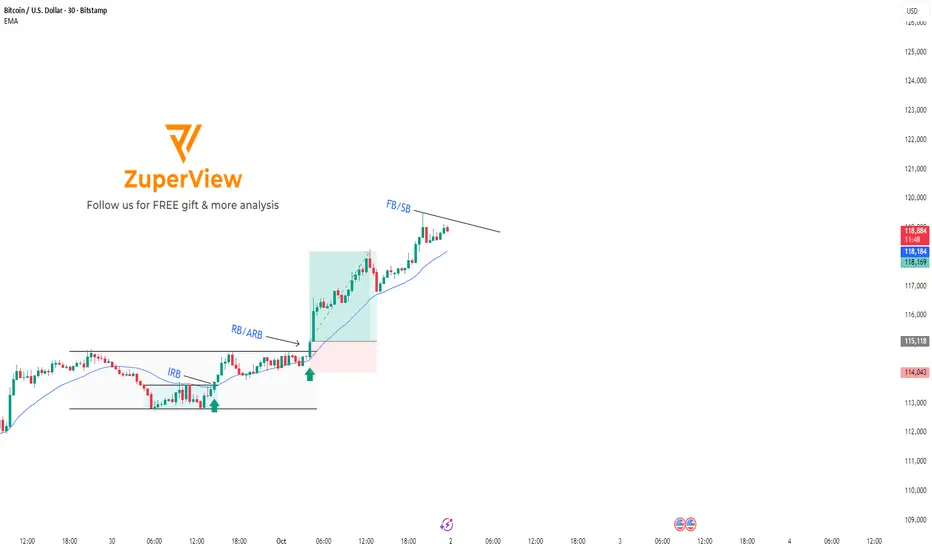
BTCUSD: Breakout played out, focus on EMA retestOverview
Yesterday’s Breakout Plan played out correctly, with BITSTAMP:BTCUSD continuing its bullish move.
The market remains in an uptrend, with no clear signs of reversal.
However, price is currently trading far above the EMA, so it’s not ideal to chase entries here.
Trading Plan for Today
Primary Scenario:
Wait for BITSTAMP:BTCUSD to retrace closer to the EMA and form a momentum consolidation zone.
If confirmation appears (e.g. breakout through the short-term trendline), consider long entries in line with the trend.
Alternative Scenario:
If BTC closes below the EMA with strong bearish momentum, a deeper correction is possible.
In this case, stay cautious and wait for a new structure to form before re-entering.
You can refer to my previous analysis here:
Please like and comment below to support our traders. Your reactions motivate us to do more analysis in the future 🙏✨
Daniel Miller @ ZuperView
BITCOIN making a bullish break-out similar to July'sBitcoin (BTCUSD) just broke above the Lower Highs trend-line of its August 14 All Time High (ATH). This was implemented after a bottom on the 5-month Higher Lows trend-line as well as the 1D RSI Support.
The last time all those conditions were fulfilled was on the July 02 Lower Highs break-out, after which BTC completed a +25.33% rally from the Low, almost touching its 1.786 Fibonacci extension.
Ahead of another 4H Golden Cross, just like then, we expect Bitcoin to make another +25.33% Bullish Leg and reach at least $136000 on the medium-term.
Do you think that's reasonable to expect within October? Feel free to let us know in the comments section below!
-------------------------------------------------------------------------------
** Please LIKE 👍, FOLLOW ✅, SHARE 🙌 and COMMENT ✍ if you enjoy this idea! Also share your ideas and charts in the comments section below! This is best way to keep it relevant, support us, keep the content here free and allow the idea to reach as many people as possible. **
-------------------------------------------------------------------------------
💸💸💸💸💸💸
👇 👇 👇 👇 👇 👇

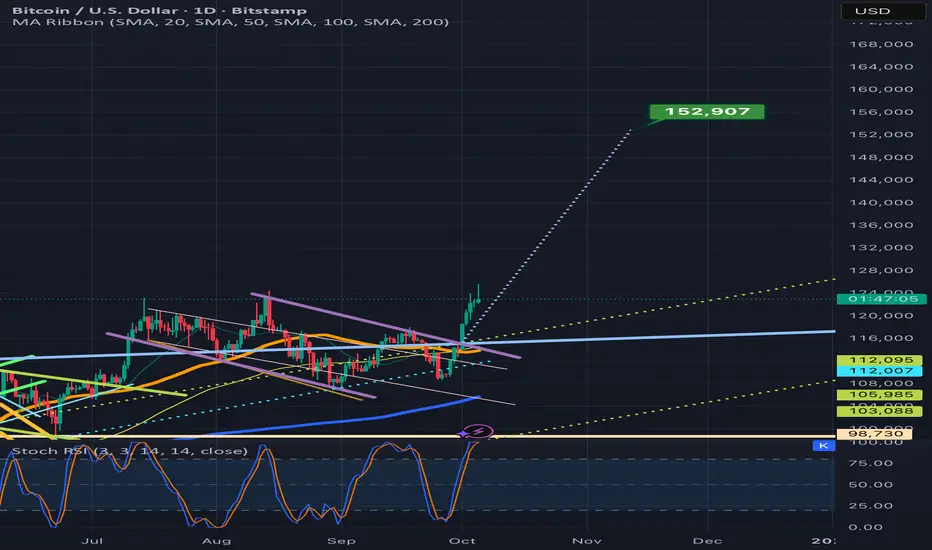
BTC just achieved a new all time high on its way to 153kFeels like it may be validating the breakout above the blue line as it also seems to be climbing up the dotted measured move line here on the last few candles. So probability is quite good that we validate the breakout on this impulse. If so the full measured move target is around 152.9k or more or less 153k. *not financial advice*
BTC - LONG SET-UP BITSTAMP:BTCUSD
119.5k Strong Support as of now
BTC Long Set-up 📈
EntrY Between 112.6k - 114.8k
SL below 110.8k
Target above 119k
Lev & Margin as per your risk capacity

BTCUSD: 1R secured, looking for next short signal📊 BITSTAMP:BTCUSD Analysis – October 10, 2025
🔁 Current Position Update
The Sell position from October 8 remains active and profitable.
The trade is currently up around 1R.
Traders can move stop-loss to breakeven to secure profits and eliminate downside risk.
📈 Market Outlook & Trading Plan
Trend bias remains bearish.
The main plan for today: continue looking for short entries in line with the trend.
On the H2 timeframe:
Price has closed below the EMA, confirming ongoing bearish momentum.
Wait for DD (Double Doji) or SB (Second Breakout) setup as confirmation for the next Sell opportunity.
For traders already holding positions, consider DCA add-on entries to compound profits if the downtrend extends further.
⚙️ Position Managemen t
The current trade remains safe and in profit.
Monitor price reaction near the H2 EMA for possible re-entry setups.
Avoid impulsive entries – focus only on clear signals with a proper R:R structure.
🎯 Summary:
The active Sell trade has reached 1R – stop can be moved to breakeven.
Continue monitoring for DD/SB setups on H2 to scale in or add new short positions in line with the trend.
You can refer to my previous analysis here:
Please like and comment below to support our traders. Your reactions motivate us to do more analysis in the future 🙏✨
Daniel Miller @ ZuperView

the market has shifted above the comfort zone of this forecastit's been a good run of accurate forecasts, this may be the first one that doesn't work out
this could be due to the higher timeframe trying to pull the market up...I'll take another look at it in a few hours
sometimes BTC does some silly things, then jumps back into form. thus I'm going to let this play out before updating pushing out another forecast

BITCOIN Is Bullish! Long!
Take a look at our analysis for BITCOIN.
Time Frame: 1h
Current Trend: Bullish
Sentiment: Oversold (based on 7-period RSI)
Forecast: Bullish
The market is approaching a key horizontal level 123,044.94.
Considering the today's price action, probabilities will be high to see a movement to 125,510.67.
P.S
Overbought describes a period of time where there has been a significant and consistent upward move in price over a period of time without much pullback.
Like and subscribe and comment my ideas if you enjoy them!

Bitcoin analysisAfter the strong support we identified earlier — which we expected to hold — Bitcoin managed to climb to 125,000. Currently, the price is in a correction phase. If it reaches the 121,500 support and fails to hold there, we can expect a deeper correction toward the 118,000 zone. However, if it finds support at that level, we can anticipate a stronger upward move.
Also, keep in mind that with the Forex market opening tomorrow, higher volume will enter the market, and we may see completely different price behavior. ✅

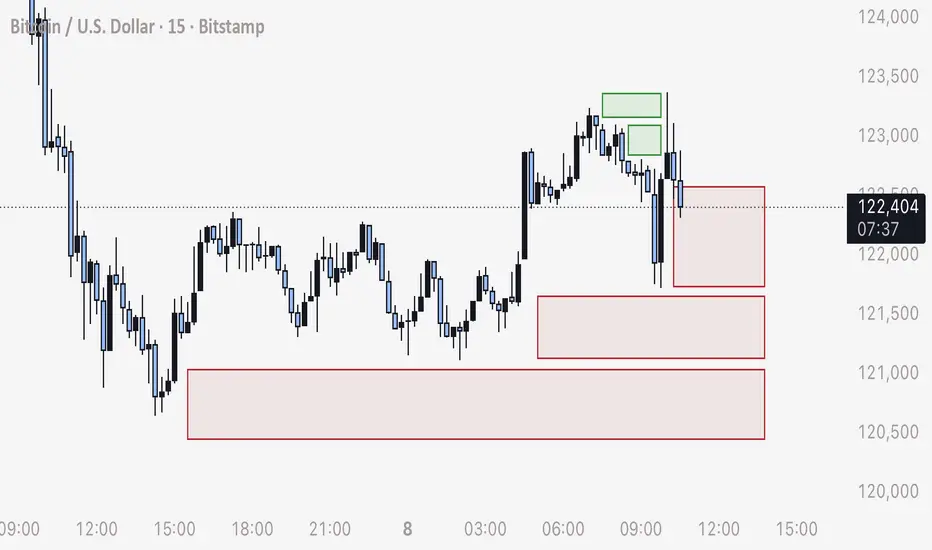
BTC - Practical Example of Trading Order Blocks / Stop HuntsHere is a very practical, recent example of trading the reaction of BTC hitting stop loss order blocks and how price moves.
Green Boxes:
- Note that price moves in a slow, downwards consolidation
- This slow drop allowed time for traders to enter shorts, consequently leaving stop loss orders for the entire position size
- The price movement when these cascading blocks of orders are triggered always moves exponentially faster than the consolidation. Slower the move in a direction = faster the wick in the opposite direction. More orders ( buys or sells ) equals greater speed and distance.
- These orders being triggered (stop losses and liquidations) trump any pattern, support or resistance. It all becomes irrelevant as the order chains will always execute and set off, ignoring any technical pattern.
Predicting this Wick to 123,300:
- Notice the downwards consolidation followed by a faster drop in the end.
- Price quickly moved higher
- From this point we can anticipate that the high leverage stop loss orders for shorts will be triggered, at this point you can scalp a long, take profit slightly above where the consolidation started.
Red Boxes:
- The red boxes are sell orders created from long positions being opened and consequently their stop loss and liquidation orders
- Mark and extend boxes from the open zones that price has not reclaimed
- When price moves down low enough, to start filling these sell orders, you may short to slightly below the beginning of the upwards consolidation
- I’d anticipate when price moves below 122,200, that’s when the wick will form and land at a minimum of 120,100 (if not setting off more sell orders as we look at higher time frames than the 15 M)
- Looking at the slowness and time allowed for the upwards consolidation, we can anticipate a larger amount of longs have been opened, and this can be translated to an increased speed of a wick down and faster movement.
In Summary:
I hope this serves you as a good, practical example of the method of trading stop losses hunts and order blocks, which in my experience is the only reliable way to predict the price of Bitcoin.
Yours truly,
- DD
BTCUSD H4 | Potential Bullish Continuation SetupBitcoin (BTC/USD) is falling towards the buy entry at 118,647.96, which is a pullback support that is slightly above the 50% Fibonacci retracement and could bounce from this leve lto the upside.
Stop loss is at 114,705.13, which is a pullback support that lines up with the 61.8% Fibonacci retracement.
Take profit is at 125,444.07, which is a swing high resistance.
High Risk Investment Warning
Trading Forex/CFDs on margin carries a high level of risk and may not be suitable for all investors. Leverage can work against you.
Stratos Markets Limited (tradu.com ):
CFDs are complex instruments and come with a high risk of losing money rapidly due to leverage. 65% of retail investor accounts lose money when trading CFDs with this provider. You should consider whether you understand how CFDs work and whether you can afford to take the high risk of losing your money.
Stratos Europe Ltd (tradu.com ):
CFDs are complex instruments and come with a high risk of losing money rapidly due to leverage. 66% of retail investor accounts lose money when trading CFDs with this provider. You should consider whether you understand how CFDs work and whether you can afford to take the high risk of losing your money.
Stratos Global LLC (tradu.com ):
Losses can exceed deposits.
Please be advised that the information presented on TradingView is provided to Tradu (‘Company’, ‘we’) by a third-party provider (‘TFA Global Pte Ltd’). Please be reminded that you are solely responsible for the trading decisions on your account. There is a very high degree of risk involved in trading. Any information and/or content is intended entirely for research, educational and informational purposes only and does not constitute investment or consultation advice or investment strategy. The information is not tailored to the investment needs of any specific person and therefore does not involve a consideration of any of the investment objectives, financial situation or needs of any viewer that may receive it. Kindly also note that past performance is not a reliable indicator of future results. Actual results may differ materially from those anticipated in forward-looking or past performance statements. We assume no liability as to the accuracy or completeness of any of the information and/or content provided herein and the Company cannot be held responsible for any omission, mistake nor for any loss or damage including without limitation to any loss of profit which may arise from reliance on any information supplied by TFA Global Pte Ltd.
The speaker(s) is neither an employee, agent nor representative of Tradu and is therefore acting independently. The opinions given are their own, constitute general market commentary, and do not constitute the opinion or advice of Tradu or any form of personal or investment advice. Tradu neither endorses nor guarantees offerings of third-party speakers, nor is Tradu responsible for the content, veracity or opinions of third-party speakers, presenters or participants.

BTCUSD Currently in an H4 Demand Zone. NEW ATHs LOADING!Until I see very convincing signs of a reversal, I remain bullish in this market.
Price has currently retested a demand zone on the H4 TF and I will be using this zone to validate my longs to New ATHs.

BTC/USD Buy PullbackBTC/USD is currently in a correction phace after beginning the day with a strong bullish impulsive push, with our candlestick behavior and evident bullish strength, we can go bullish as we target nearest level of resistance above.

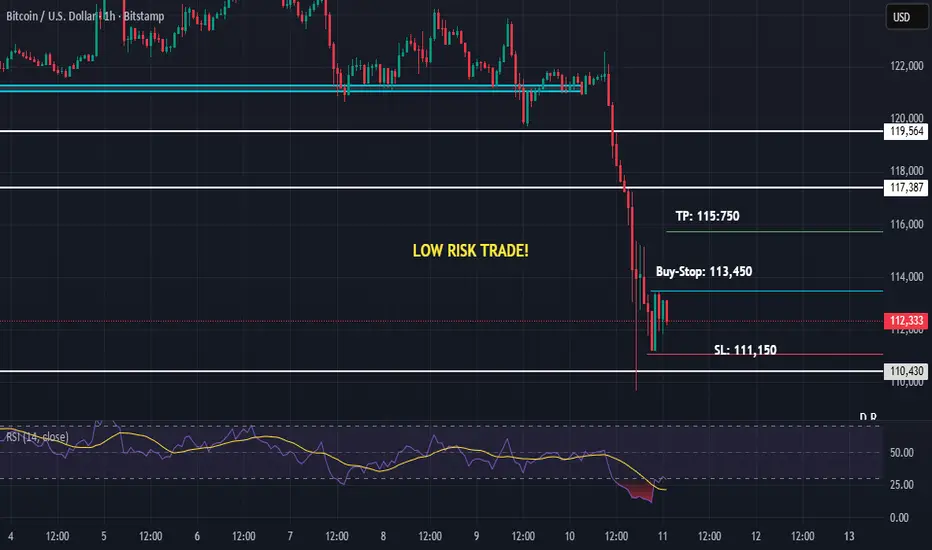
Bitcoin Price Stables After a Good Correction...It looks like a market crash on smaller timeframe but on higher timeframe, it's just a correction. Bitcoin price has stabled after this correction but it can very well go further down.
However, at this point, it can see a recovery towards the upside. Let's try to take a low risk trade here. Just 1:1 would be fine as more US vs China news can come at any moment. No need to hold the trades for long and DO NOT TAKE LEVERAGE!