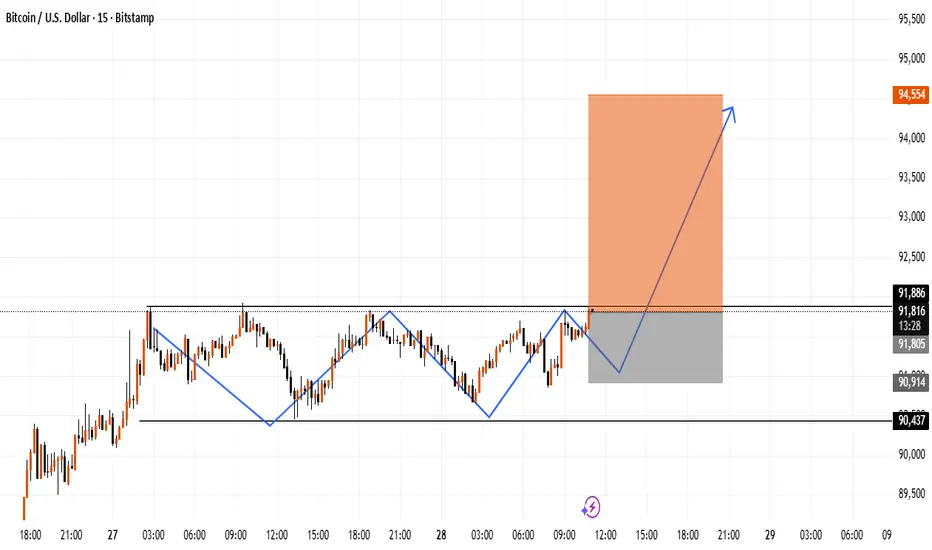
BTC Short-Term Structure Break With Potential Upside ExpansionThis chart highlights a short-term range on BTC where price has been reacting around the same horizontal zone multiple times. A clear internal structure shift can be seen, followed by a deeper pullback into the recent demand area. If price maintains support above this zone, it may open room for an upside continuation toward the next liquidity level.
The marked move is a possible price scenario, not a certainty.
This idea is shared for market observation and educational analysis only.
Trade ideas
uptrend The price is expected to change direction at the current support area and start an uptrend. If the price breaks through the support area, a downtrend is likely.

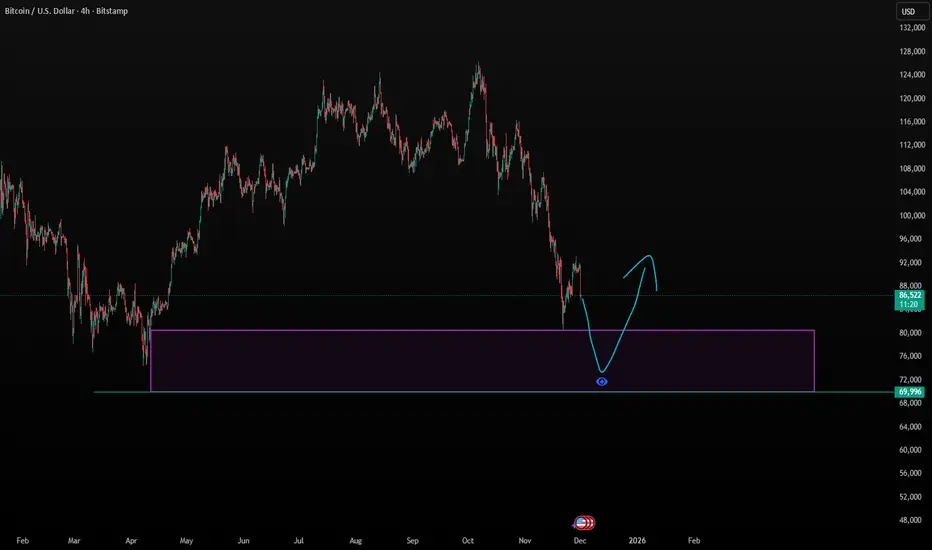
#Bitcoin Mini Update $BTC is back above 92K#Bitcoin Mini Update
CRYPTOCAP:BTC is back above 92K. Last time it failed to stay above this level and later fell below 88K. If 92K holds now, price can move toward 95K to 96K. It might even try for 99K, but that area is still strong resistance and hard to break.
The main level to watch is 88K. If price breaks below it and gets rejected, the drop toward 80K, 77K, and maybe 72K can start again. The green box near 72K is the only good area for spot buying. Using leverage there is too risky.
Nothing has changed. The market is moving exactly the way we expected. The structure is still weak. We’re seeing lower highs, slow momentum, and big players quietly selling into every bounce. Nothing here suggests strength. Until we see a real shift, every move up should be viewed with doubt.
I’m still holding my short for more than three months, and my plan stays the same. If Bitcoin can push above 99K with real strength, then I’ll think about adding more shorts. Until that happens, nothing changes on my side. This whole move still looks like a controlled liquidation game.

BTCUSD LOOKNG IN LONG DIRECTION AT 92850$🚀 BTCUSDT / BITCOIN ANALYSIS & FORECAST
Over the last two weeks, Bitcoin has been falling continuously, but the decline has finally slowed down as price found strong support near the $82,500 zone. From this level, BTC has formed a strong bullish pattern, signaling potential reversal momentum.
If buyers continue to hold above the support, Bitcoin is positioned for a significant upside move.
🔑 Key Levels
Support Zone:
$82,000 – $82,500
Resistance Zone:
$95,000
🎯 Technical Target
$108,000
📌 Market Outlook
BTC respecting the $82k support and forming a bullish structure suggests a strong possibility of continued upside. A clean breakout above $95k may trigger the next major rally toward $108k—its current technical target.

Bitcoin trading strategyConcentrated Release of Bearish Factors + Policy Expectation Adjustments: Bitcoin Rebound Gains Momentum
Concentrated Release of Bearish Factors
The three core bearish drivers that previously suppressed the market—Fed hawkish expectations, PBoC risk warnings, and USDT rating downgrades—have been fully digested during the sharp sell-off on December 1-2. Bitcoin has rebounded over 10.7% from its low of $83,786, demonstrating the characteristics of a "technical recovery after the exhaustion of bearish factors."
Subtle Shifts in Policy Expectations
Although market divergence persists regarding the probability of a Fed rate cut in December, the extreme earlier expectation that "the rate cut probability would fall below 50%" has marginally eased. Coupled with the long-term support from the Trump administration’s "Strategic Bitcoin Reserve" policy (institutional lock-up of 200,000 BTC), this provides the underlying logic for the rebound.
Improved Cross-Asset Correlation
U.S. tech stocks have stabilized and rebounded, with risk appetite marginally recovering. The correlation between Bitcoin and the Nasdaq 100 Index has returned to 0.75, as Bitcoin benefits from the reset of capital risk preferences.
Bitcoin trading strategy
buy:91000-92000
tp:93000-95000
sl:90000

BTC? Buy time
Hi,
I see discount on BTC
My target is 118k area.
My risk is if it drops below 80k
All the best
Not a guru

Bitcoin: Reversal or Deeper Lows?BITSTAMP:BTCUSD attempt to break above $90,000 after rebounding from the $80,000 support failed, sending price back toward $85,000 and weakening bullish momentum. A continued decline below the $80,000 zone would shift focus to the $70,000–$75,000 support range as a key reaction area. A strong bounce there could revive medium-term bullish structure. However, if this zone breaks decisively, a deeper move toward the $50,000 region would not be surprising, signaling a broader trend reversal.
BTCUSD : What can happen soonRemember, it did NOT reach F.
I think the market maker will still squeeze the price further for more supplies to be forced out.
@ 18/12/2025
@ 15/1/2026
Good luck.

$BTC should as least go to $70K zone. Why? :In 2023 #Bitcoin tested the 2018 high. When we retest a major break out zone once then we will likely do it again in the next leg, especcially when a trend already has been streched.
Check back history, any market, any timeframe and see it yourself.

December 4 Bitcoin Bybit chart analysisHello
It's a Bitcoin Guide.
If you "follow"
You can receive real-time movement paths and comment notifications on major sections.
If my analysis was helpful,
Please click the booster button at the bottom.
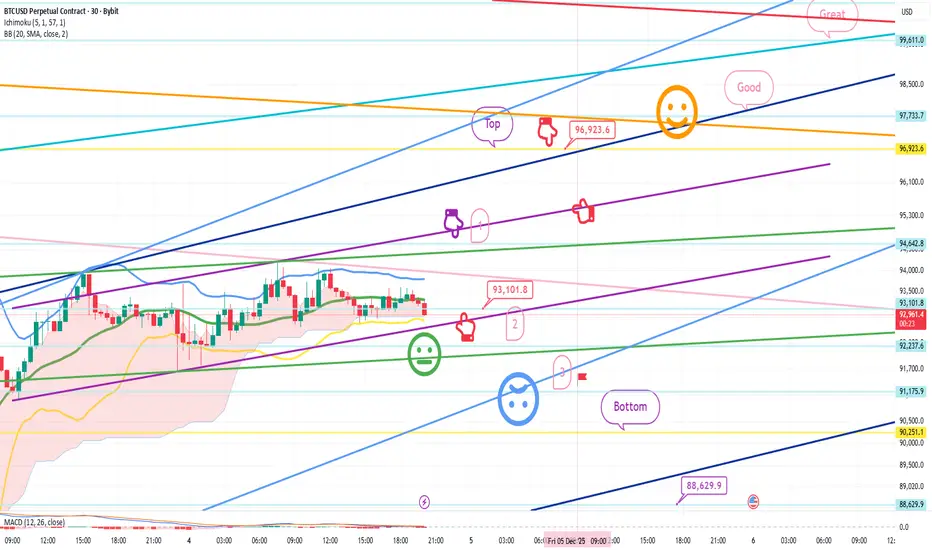
This is a 30-minute Bitcoin chart.
It's not visible on the screen due to limited space,
but at the bottom, it touched the long position entry point of $83,495.4 on December 1st,
and continues to rise.
The Nasdaq indicators will be released shortly at 10:30 AM,
and I developed today's strategy based on the Nasdaq and Tether dominance patterns.
*Conditional long position strategy based on the red finger's path
1. After touching the purple section once at the top (autonomous short)
Switch to a long position at the red finger at the bottom at $93,101.8
/Stop-loss price if the green support line is broken
2. First target for a long position at the top section at $96,923.6 -> Target prices in the order of Good and Great
Before tomorrow's daily candlestick is created,
if the top section is touched alone,
since it is a resistance line on the Bollinger Band daily chart,
a strong correction is likely.
If the Good section is touched at once,
it is highly likely to be ignored and continue to rise.
If the price drops immediately without touching the first section at the top,
it's a final long strategy in the second section,
and the stop-loss price remains the same.
The third section below is a sideways movement.
If the green support line holds today, a vertical rise is possible after tomorrow.
If the price holds today's light blue support line,
it could lead to a strong upward movement after tomorrow.
Below the bottom, the price is open to 88.6K, the lowest point today.
Please note this.
Please use my analysis to this point for reference only.
I hope you operate safely, adhering to principled trading and a stop-loss price.
Thank you.
Can BTCUSD sustain its recovery? Fundamental perspective:
Bitcoin (BTCUSD) is attempting a cautious rebound, but subdued ETF flows suggest investors remain wary. The Fed injected 38.5 bln USD in liquidity through repo operations, one of the largest boosts since 2020, sparking renewed optimism across risk assets. With quantitative tightening ending, expectations of a looser financial environment are rising, providing a potential tailwind for crypto.
Technical perspective:
BTCUSD bounced off the 85,000 support and is now testing the ascending channel’s upper bound and resistance at 94,000.
A breakout above 94,000 may extend bullish momentum toward the psychological resistance at 100,000.
Conversely, a move below 85,000 may trigger further downside toward the subsequent support at 81,000.
By Li Xing Gan, Financial Markets Strategist Consultant to Exness

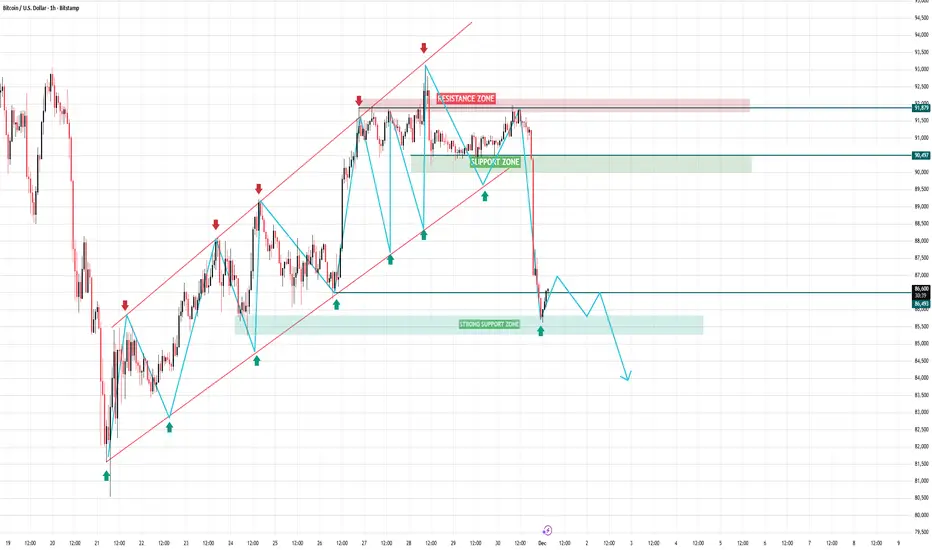
#bitcoin sell@High strategy in this level#btc recent Lower High has been hit at 93k and creating #doubletop, and this is the perfect sell@high strategy with a solid resistance level.
If this Lower high reaches the recent lower low, then we could see the #crypto #btcusd below 80k in the upcoming weeks.
#BTC #forex #supportortandresistance #tradinging #swingtradingstrategies #buy #sellll #EURUSD #goldd #niftyy #s&p #etf #qqq #iwm #future #options #longterm #btc #forex #etf #option #money #earning #dollars #bitcoin,#btc,#spy,#forex,#bitcoin,#supportlevel,#RESISTANCELEVEL,#TESLA,#S&P500,#NVDIA,#APPLE,#AMAZON,#NIFTY,#META,#RSI,#STOCKMARKET,#SHAREMARKET,#GOLD,#OIL,#SILVER,#INTRADAY,#SWINGTRADE,#LONGTERM,#INVESTMENT,#SELL,#BUY,#BID,#ASK,#MARKET,#INVESTORS,#IWM,#OPTION,#FUTURES,#US,#ALIBABA,#CASH,#CASHFLOW
nifty50, rel,sbi,buyside liquidity,ict,ict ob,ict fvg,ict hindi, FVG, OB, false order block, nifty order block, bank nifty order block, why stop loss hit, nifty sl, nifty tgt,n ifty options,banknifty options, Nifty vix, nifty and bank nifty, Day trading ict, Liquidity ict, BOC, COCH, Breaker Block, ICT BREAKER BLOCK, nifty in discount price, ICTBITCOIN, BTCUSD,#btc,#bitcon, gold, silver, buy, sell,btcusd, spy,iwm,qqq, tesla,appl, google,nvda, amazon,etf, bond,ibkr ,margin,moneymanagment

Watch Round levels Only In BTc.1) The Big Picture (Major Trend): The overall trend for Bitcoin is still "quite Bearish" (meaning the price is generally expected to go down. 👍 But right now, the short-term chart is moving "sideways" (meaning the price is chilling and not going strongly up or down).
* 2) The Price Is Super Sensitive: The price is really tuned into "Round Levels"—think of these as big, easy-to-remember numbers like $90,000, $91,000, etc.
* Right now, Bitcoin is trading around $90,784.
* The $91,000 Level: This is a "Round Level" that acts as a weak "Support" (a price floor that holds it up) and also a good "Resistance" (a price ceiling that stops it from going higher). It's a key spot!
* The $90,000 Level: The notes say that trading below this level is a good "Support" for the price.
* 3) The Price Walls:
* $92,000 is seen as a good "resistance" for the price. (Resistance = a price wall that keeps it from climbing higher 🧱).
* $93,000 is the "hard resistance" for the price. (This is the toughest wall to break! 🛑).
🔥 Quick Summary for the Trading Game:
Bitcoin is bullish overall, but it's playing ping-pong between some key numbers ($90,000 to $91,000). The biggest challenges to a massive price jump are the $92,000 and $93,000 walls!
🧠 The Trader's Plan: Bitcoin's Round Level Game
The writer is super confident that Bitcoin is "strictly following round levels." This is the core idea they are building their whole strategy around.
📉 A Quick Look Back (The Last Trade)
* Yesterday's Win: They were in a trade and "captured almost $2,000 in profit." That's a huge win! 🏆
* The Flop: But they didn't keep an eye on their trade (didn't "monitor their position"). When the US markets "sold off" (prices suddenly dropped), they had to close the trade quickly with only $0.69 profit (!!). That's a classic trading mistake—letting a huge profit disappear.
* Risk vs. Reward (R:R): They mention achieving a 1:3 R:R in their "last long trade." This is a key trading term: it means they were risking $1 to try and make $3. That's a great ratio for a profitable plan.
🎯 The Plan for Today (The Next Trade)
* The Strategy: The plan is to watch the price when it hits those "round levels." They will then decide to enter a trade, either "long or short," based on what the price does there. (Long = betting the price goes UP, Short = betting the price goes DOWN).
* The Target: Their profit goal (Target) for the trade is $1,000.
* The Levels Refined: They update their opinion on the key Round Levels:
* $91,000 is NOT a good Support.
* $92,000 is ALSO NOT a good Support.
* $90,000 is FIRM Support. This is the strongest floor, and if the price bounces here, the trader expects to get "higher targets" (bigger profits) from this level!
🔥 Bottom Line: The plan is simple: only trade when the Bitcoin price hits a major "round level" like $90,000 because that's where the biggest buyers/sellers hang out and cause the strongest price moves. CME:BTC1!

BTCUSD: Bearish Sequnce Not Finished,Unless It Breaks 100kA lot of traders are wondering when Bitcoin will complete the pullback from the highs, but if we are really in a higher-degree retracement then keep in mind that the big pullbacks on Bitcoin usually lasted around 12 months, and right now we are only one and a half months away from the recent highs. That’s the first thing. The second thing, and the most important for me, is always the Elliott wave structure itself. I simply cannot ignore it, because it helps me identify the key levels that must be broken before we can confidently look for a turning point.
If you look closely at the price drop from the 116515 level, you can clearly see that this is a strong decline without a completed five-wave sequence yet. So even if we assume this is wave C rather than wave four, it still has to be structured by five waves. That means the current rebound from the 80k zone could easily be just a fourth wave, maybe stopping around 90k, which is an important swing level for this week.
Based on Elliott waves and price action, this weakness can still resume. The key level for a bullish turn is very clear: a push back above 99k, or better said 100k, which is a strong psychological pivot. Below it we stay in bearish mode with risk for one more drop.

BTCUSD: Bulls Aim for Recovery Toward $92,000 Resistance ZoneHello everyone, here is my breakdown of the current Bitcoin setup.
Market Analysis
BTCUSD continues to move within a clearly defined Downward Channel, respecting both the descending resistance line and the lower support boundary. After a prolonged bearish continuation from the major Range structure seen earlier, Bitcoin broke several intermediate support levels before reaching the Support Zone around $84,000, where strong buyers stepped in. A Fake Breakout below the channel support triggered aggressive buying activity, sending the price back above the Support Zone and forming a short-term recovery structure. From this point, BTCUSD made a corrective bounce and even managed to break above a minor descending resistance, confirming a temporary shift in momentum.
Currently, price is approaching the Resistance Zone near $88,000–$90,000, which aligns with the upper boundary of the Downward Channel. This area has previously generated strong sell-offs and remains the key obstacle for buyers. A clean breakout above $90,000 would signal bullish continuation and may lead to a deeper recovery toward the next liquidity cluster near $92,000–$94,000. As long as BTCUSD holds above the $84,000 Support Zone, the short-term structure supports a bullish correction. However, if price gets rejected from the $90,000 resistance and fails to stay above support, sellers may regain control and push the market back toward the lower channel boundary.
My Scenario & Strategy
From my perspective, BTCUSD maintains a bullish corrective outlook while respecting the Support Zone around $84,000. The first target remains the $90,000 Resistance Zone, which matches both horizontal resistance and the channel’s upper boundary. A confirmed breakout above $90,000 would open the path toward $92,000–$94,000, where the next reaction levels are located. I will look for long opportunities during pullbacks toward the Support Zone or along the rising minor trendline that formed after the fake breakout.
If BTCUSD breaks back below $84,000, the bullish scenario becomes invalid, and a continuation of the major downward trend may follow. For now, price action supports a bullish recovery setup as long as buyers defend the Support Zone.
That's the setup I'm tracking. Thank you for your attention, and always manage your risk.

BTCUSDT: Bearish Rejection Loading — Eyes on $90,500 and $87,000BTCUSDT is showing strong potential for a deeper correction after tapping into our marked selling zone. If price rejects from this area, we can expect downside targets around $90,500 and $87,000 as highlighted on the chart.
This zone remains critical for identifying whether BTC continues its bearish structure or attempts another recovery. Please use proper risk management while trading cryptocurrencies.
For further analysis please like and comment.

BTC Is Heating Up — The Next Big Move Is Closer Than You Think!1. Market Analysis (Updated)
Bitcoin has just touched $89,000, aligning perfectly with the recovery structure we expected earlier. After the deep drop toward the $80,000–$85,000 zone, buyers stepped in aggressively, creating a clean rebound and pushing price back into momentum territory.
Today’s move coincides with a strong rally in U.S. tech stocks, shifting overall sentiment toward risk-on assets — a boost that often strengthens crypto markets.
However, the sharp drop earlier this week triggered over $200M in long liquidations, exposing how fragile leveraged positions are in current conditions. This volatility shows that while buyers are present, the broader market still carries elevated risk.
ETF inflows are slowly returning, supporting Bitcoin’s liquidity and helping stabilize short-term price swings. Yet several analysts warn the recent bounce could still be a “dead-cat bounce” if BTC fails to reclaim key structural levels.
In short:
Momentum is back — but conviction is not yet confirmed.
2. Technical Structure Update
The chart shows:
- A major Support Zone at $85,000–$86,000 — recently tested and respected.
- The current rally brings BTC back toward the $89,000–$90,000 Resistance Zone, which previously acted as a pivot and rejection point.
- If price stabilizes and breaks above this zone with strength, the bullish recovery could expand toward higher targets.
- If price gets rejected here, downside pressure can quickly return.
Right now, BTC is trading at a decision point.
3. Scenarios & Trading Strategy
🔸 Main Scenario – Bullish Continuation (Higher Probability)
If BTC holds above $89,000 and successfully breaks through $90,000, price may aim for:
Target 1: 92,500
Target 2: 94,000+
Why this matters:
- Tech-stock rally boosts risk appetite
- ETF inflows returning
- Liquidations flushed weak long positions → cleaner market structure
Strategy: Buy dips above $89K, wait for breakout confirmation.
🔹 Sub Scenario – Bearish Rejection (Caution Required)
If BTC fails to hold $89,000, and especially if it breaks below $86,000, the structure turns bearish again.
Downside targets: 83,000 - 80,000
Why?
- Market still fragile
- Heavy liquidation clusters below
- Risk sentiment turns quickly if buyers lose strength
Strategy: Expect lower highs → potential short setups toward support zones.
4. Summary & Personal View
- Overall Trend: Neutral → Slightly Bullish
- Short-Term Bias: Bullish above $89K; Bearish below $86K
- Momentum: Returning, but not fully confirmed
- Opportunity: High volatility = high reward if risk is managed
- Caution: Market still sensitive to macro news & ETF flows
BTC is entering a decisive phase — the next move will shape the rest of the week.

"Precision Zones: The S&D Approach That Works for Me"My Supply & Demand Framework (Multi-Timeframe & Trend-Aligned)
This is the structure I use to trade Supply & Demand across all timeframes, from swing trading down to scalping. The logic stays the same — only the lens changes.
“I'm using ICMARKETS:BTCUSD latest 4H chart as an example, I’ve marked key demand and supply zones based on the last candle before significant moves, some refined on the 1H timeframe, with entries considered on 15M rejections or order blocks.”
⸻
🔹 1. Trend Comes First
I only look for:
• Demand setups in an uptrend
• Supply setups in a downtrend
This applies on every timeframe.
I never force countertrend trades — direction is the foundation.
⸻
🔹 2. Identifying Zones (4H Core Logic)
My main zone selection starts on the 4H chart.
I mark the last candle before a strong impulsive move:
• Strong move up → Demand zone
• Strong move down → Supply zone
• High probability zone must create Fair Value Gap
That origin candle can be:
• Bullish
• Bearish
• Indecisive
The shape doesn’t matter — the impulse does.
⚠️ The same logic can be applied to any timeframe:
Daily, 1H, 15M, 5M — structure doesn’t change.
⸻
🔹 3. Refining (Optional) on the 1H
Once the zone is marked on 4H, I zoom into 1H:
• If 1H gives a cleaner origin → refine
• If it adds noise → keep the 4H zone as it is
Sometimes i'm even using multiple candles. Refinement is a tool, not a requirement.
⸻
🔹 4. Execution on the 15M
Entries are taken on the 15-minute timeframe.
I wait for two conditions when price returns to my zone:
A. Strong rejection
Examples:
• Sharp wick rejection
• Strong displacement
• Clear shift in short-term order flow
B. A fresh 15M order block
Once rejection creates an order block in the direction of the trend,
that becomes my trigger.
⸻
🔹 5. The “Instinct Entry”: Limit Order at the Zone
Sometimes, when everything aligns strongly, I skip confirmation and place a limit order at the start of the zone.
I only do this when:
• The trend is extremely clear
• Momentum is clean and one-sided
• The zone originated from a very strong displacement, FVG formed
• Structure fully supports continuation
This is not mechanical — it’s experience and flow.
If I’m deeply bullish and the demand zone was the engine of a massive move,
I’m comfortable taking the risk.
Same idea for supply in a strong downtrend.
It’s high-confidence, high-conviction — but optional.
⸻
🔹 6. Fully Scalable Across Timeframes
This system works like a staircase:
• Daily → 4H execution
• 4H → 15M execution
• 1H → 5M execution
• 5M → 1M execution
- Higher timeframe defines the zone.
- Lower timeframe gives the entry.
- Trend ties everything together.
⸻
🔹 7. Entry & Risk Management
• Enter at the beginning of the marked zone.
• Place stop loss at the end of the zone.
• Primary target: fixed 1:3 risk-to-reward (RR).
• Consider liquidity areas, nearest support, or resistance levels for profit-taking.
• I usually take partial profits at 1:3 RR and let the remaining position run toward internal/external range liquidity or key support/resistance levels.
⸻
🔹 8. What This Gives Me
• Strong HTF structure
• Clear LTF triggers
• Cleaner entries
• More confidence
• Less noise
• A consistent, repeatable process
• Flexibility when conviction is extremely high
Thank you for reading! 💛 Show some love, and I hope I can bring real value to your trading journey.

BTC : Broadening Wedge Trade with Possible 107k/115k Targets A Descending Broadening Wedge is visible on the BTC 12 hour chart.
This can offer a quick trade opportunity as these patterns typically break upwards more often than not.
The wedge shows expanding price action with lower highs and lower lows.
Points A and B mark where price touched the wedge boundaries.
Right now price is testing the lower trendline support.
Trade Plan:
Stop Loss: Must be set at 81k (bottom of the wedge). If it breaks below this, the pattern is invalidated.
Target 1: 107k
Target 2: 115k (top of the wedge/measured move)
Things to Watch:
Wait for a breakout above the upper trendline for confirmation
Volume should pick up on a real breakout
81k is critical support - a clean break below kills the setup

BITCOIN Will Go Higher From Support! Buy!
Take a look at our analysis for BITCOIN.
Time Frame: 4h
Current Trend: Bullish
Sentiment: Oversold (based on 7-period RSI)
Forecast: Bullish
The market is approaching a key horizontal level 86,080.52.
Considering the today's price action, probabilities will be high to see a movement to 92,932.85.
P.S
Overbought describes a period of time where there has been a significant and consistent upward move in price over a period of time without much pullback.
Like and subscribe and comment my ideas if you enjoy them!

BTCUSD Relief rally before another drop.BTCUSD is currently completing 5 wave bearish structure, I'm expecting a wave 4 retracement before another wave down.
Sell Zone: $92,150 – $96,700
I expect BTC to continue climbing into this zone before distribution begins. Beware that BTC's bullish momentum is exhausted and it might not reach that high. Reaching this sell level might be a complex correction not a simple one.
Buy Zone: $72,100 – $75,990
If this analysis plays out well, and market starts showing bullish signs, I'm expecting it will be the local low for this bearish bitcoin move. Otherwise, price might continue dropping to $62,000 area.
I will update this idea later.
Good Luck!

$BITCION ANALYSIS BULL Come Back for Hitting (READ CAPTION)hello Traders! New month, New Week Strat 02 December 2025 and here is my $Bitcion Analysis chart please read it and send me your ideas for more Analysis.
$Bitcion work around $87000 and its hit his Bearish targets. Now $Bitcion showing a strong bullish trend, buying the dip around $86000- $85900 with targets at $88000, $90000, and $92000, potential for further gains if $Bitcion breaks above $92000 and maintains its bullish momentum.
$Bitcion make bullish spen lines and make bullish candles if market break its rejection point then its going more further upside.
Some Analysts predict $Bitcion will reach $112000-$116000 by the end of December 2025, while others forecast $130000-$140000 or even $150000
Bullish Scenario:
Pivot Point: ($87000)
Target 1: ($88000)
Supply zone: ($90000)
Resistance: ($92000)
Support Area: ($85000-$84000)
Strong Resistance zone: ($96400-$95500)
Please dont forget like & comment for more latest updates.
This Analysis for informational Purposes only. Trade is own your risk
