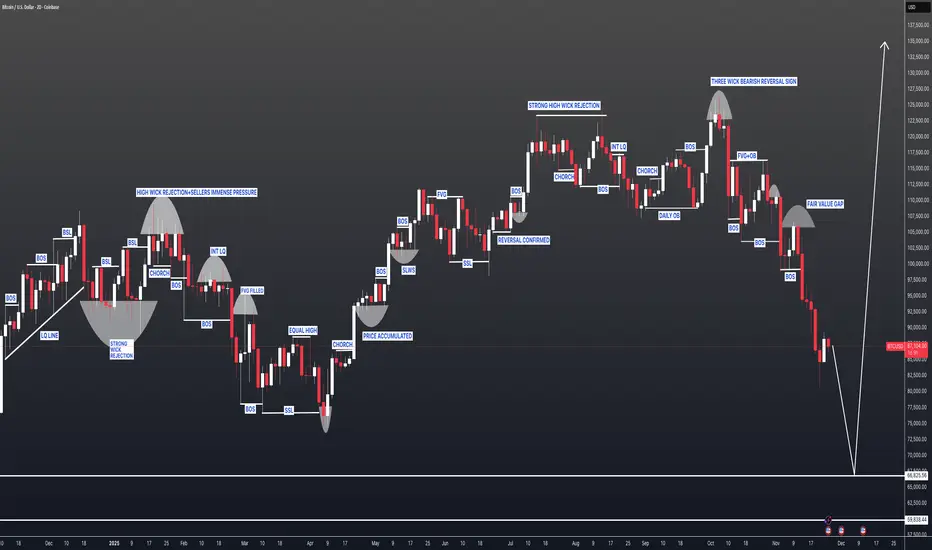
Bitcoin cycle symmetry? Timing-based overviewThe chart highlights three major BTC cycles:
2017 → 2021 → 2025.
Each spans roughly 1064 days from peak to peak.
This pattern has repeated twice, and the current cycle aligns within the same time window.
🔍 Key observations:
The 2017 cycle ended → correction + long accumulation.
The 2021 cycle mirrored the structure.
The current cycle reached a new ATH (~126K), aligning with historical cycle endpoints.
BTC is now trading inside a zone where previous cycles showed strong pullbacks and base formation.
Further movement may develop as corrective waves rather than trend continuation. Historically BTC offered solid bounces after topping out.
Altcoins
Upside still exists, but it depends on BTC holding support.
Stability above key levels = potential alt impulse.
Breakdown = elevated risk for alts.
Summary
BTC cycles ≈ 1064 days each.
Current outlook fits the end-cycle window.
Likely corrective structure with bounce scenarios.
Alts need BTC stability to shine.
The market isn’t emotional it’s geometric.
Cycles aren’t guarantees, but they’re signals worth respecting.
Trade ideas

BTCDO YOU KNOW WHATS BEHIND THIS OR OTHER IDEAS?? in bio..
Preferably suitable for scalping and accurate as long as you watch carefully the price action with the drawn areas.
With your likes and comments, you give me enough energy to provide the best analysis on an ongoing basis.
And if you needed any analysis that was not on the page, you can ask me with a comment or a personal message.
Enjoy Trading ;)

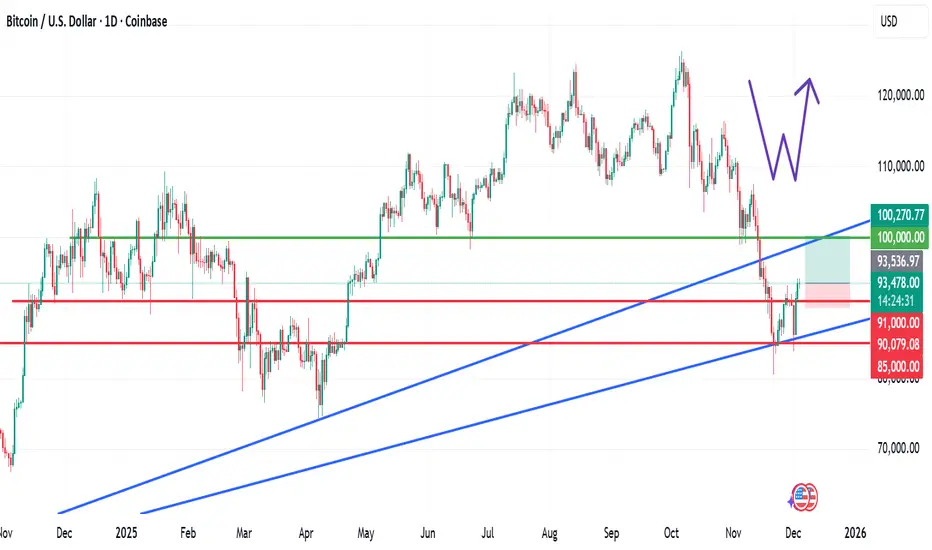
Bitcoin and the Double Bottom Reversal PatternBitcoin and the Double Bottom Reversal Pattern: Is This a Key Turning Point?
Following the previously outlined technical levels that played out successfully, Bitcoin has now formed a double bottom (W) reversal pattern, a widely recognised signal in technical analysis indicating potential bullish momentum.
Price action has also broken above the $91,000 level, which previously served as resistance and aligns with the neckline of the pattern.
A sustained hold above this zone may confirm the reversal structure and support further upside movement.
If the $91,000 support level remains intact, the next logical target based on pattern projection is the $100,000 zone and potentially beyond, depending on market sentiment and volume continuation.
Trade Plan
Entry 1: Current market price (aggressive positioning)
Entry 2: $92,000
Take Profit: $100,000 and above
Stop Loss: $89,900
Ensure your risk management remains balanced and aligned with your strategy.
If you found this analysis useful, feel free to like, share, and drop a comment below.
I am looking forward to engaging with you here on TradingView.
Buy Bitcoin.Bitcoin is bouncing back and showing its teeth.
We should stay cautious around these levels.

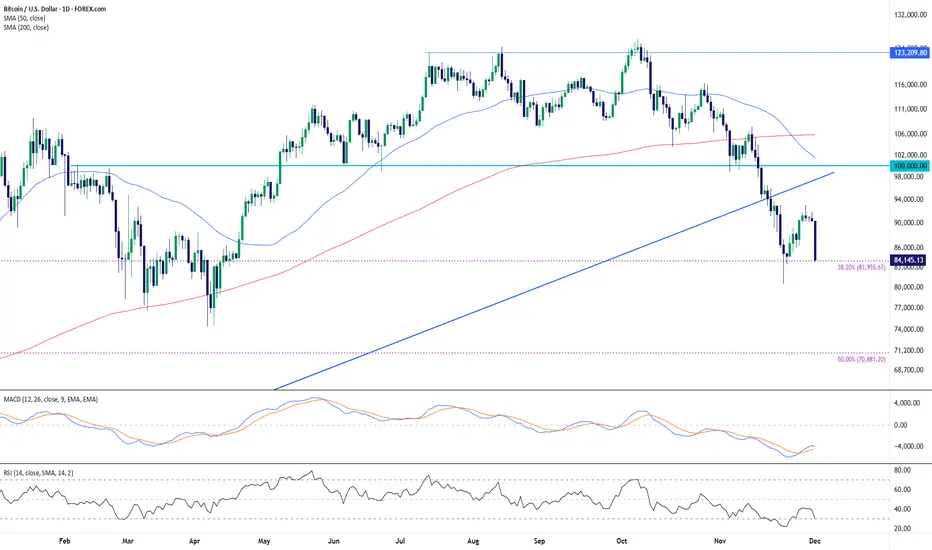
Bitcoin Extends Decline Toward Fibonacci Support as Momentum RemBitcoin continues to trade under clear downside pressure after breaking beneath its long-standing ascending trendline in November. The recent rebound attempt stalled near the underside of that same trendline—now acting as dynamic resistance—and price has since rotated lower again.
The broader structure shifted bearish once price fell below the 50-day SMA and 200-day SMA, both of which are now flattening or turning lower. This places the market in a momentum-cooling environment where sellers remain in control unless a sustained recovery develops above key moving averages.
The chart also highlights confluence around the 38.2% Fibonacci retracement level drawn from the major swing low, which sits near the latest reaction zone. The initial bounce from this area shows that participants are aware of the level, though the follow-through remains limited for now.
Momentum indicators reflect persistent weakness. The MACD remains in negative territory, with both signal lines tracking below zero and only modest signs of stabilization. RSI recently dipped into the 30-zone before attempting to lift, indicating oversold conditions were tested but broader momentum has not convincingly recovered.
Overall, the chart continues to lean bearish as long as the market holds below the broken trendline and the major moving averages. Price behavior around the Fibonacci region will be an important gauge of whether this decline matures into a deeper corrective phase or begins to base out.
-MW
Welcome to BEAR SEASONAs the timeline clearly indicates, we've entered bear season. Good luck to everyone. I've opened my Short, lit a cigarette, and sipped my cappuccino, watching with pleasure as the stoves go out.

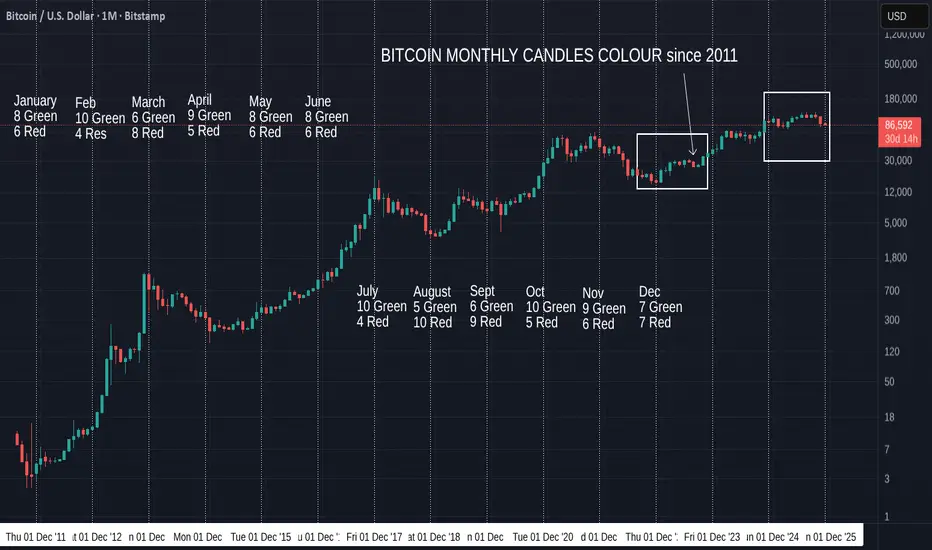
Bitcoin Monthly Candle Close Color since 2011 and patternsNovember closed RED as expected and so we have continued to follow Sequence in the left Box, mentioned in the October post.
The left Box shows the only similar monthly Candle sequence, similar to the one we currently have. If you look closely, it is also a very similar "Curve" shape. Descent to low, rise, flatten out.
The Candle Sequence to see is Red, Green. 2 Red. 4 Green, 1 red, 1 Greeno 1
red
That Sequence was followed by a larger Red Candle, which we have just also done.
The Thin down facing arrow in the left Box, points to the equvilant candle to the one we just closed, thought the month was August and not a November.
The left box starting in September 2022 and the Right Box starts in December 2024.
These Sequences run for 11 Months so Far..
This is the only 2 occasions this sequence has ever happened in Bitcoin history...and they are Both in the same "Bull Run"
And I will just mention that the Left Box was the recovery period after the 2022 Bear market.
A Very positive period.
If we continue this Sequence, we should see a Green Candle in December, though maybe not a large one. Some charts point to a Red start to December, so remain cautious.
We should also remember that a pattern workss untill it Stops...but the longer it runs, the higher the chance of that point being reached.
Just to Recap from the October post of this Series.....
"The Red November in 2011 was the bottom and was the start of Bitcoins 2 year push to ATH.
The Red one in November 2022 marked the Bottom of the Bear, though December was red but a small candle.
Nearly half of the Red Novembers called the Bottom of a Bear, a turning point in market behaviour." (There had been only 5 Red Novembers at the time of writing)
What is also very interesting is how the November 2022 Red candle was approx -27% draw down. (Wicks included) -> the following December in 2022 closed a small Red candle.
The Red November we just closed was also approx -27%
However, To follow the Color sequence, we will expect a Green December.
Of the Previous Red NOVEMBER closes, we have only ever had ONE Green December, way back in 2011,
The Odds do point to a Red December close....but hopefully a small one.
If this happens, the color sequence gets broken but I will look at what happened in early 2023 as a possible follow on. The November, December, January candles for sure....
Looking Forward. Previous December closes.
7 Green to 7 Red - A 50 - 50 mix.
Of the previous 7 Red December Closes, 4 were followed by a Green January, the last one being in December 2022 and was followed by a Lovely Green January, marking the start of the current push higher by Bitcoin from 15K usdt low to over 120K usdt.
That January Candle was over 50% rise.
Only one Red December led us into a Deep Bear market, the others signalled change.....
So, While the odds, technically, point to a Red December close, to follow previous moves and sentiments, this may not be a bad thing.
A Red December would break the sequence we have been talking about, as the next in sequence is a GREEN candle. And so were the next 6 Months.
So, December Close will answer Many questions and is, once again, a pivotal month. The Sentiment for the entire year to follow will be set by this months Candle Close..
We currently have a number of pointers suggesting this is an End to a "Bear"....and this Draw back right now has seen PA fall below a number of Key support levels but interestingly, we have got no where near the "traditional " - 80% Bear draw down.
Very confused signals, hinting at moves in either direction.
We have to wait......as ever.... But I am VERY BULLISH
As it stands, a Red or a Green December has the potential to be Good, providing that, obviously, a BEAR market is not confirmed.
My preference is fr a small Red candle this month........
BTC real buy zone 48K - 32K $. Price should retest this zone... 2024/2025 bull market, thanks to buying power of Bitcoin's ETFs, has taken off very quickly.
For first time in Bitcoin's history, price reached a new all-time high even before Bitcoin halving. From a purely technical and analytical perspective, price should recapture zone between $48,000 and $33,000. This zone is crucial, as it has not been recaptured so far throughout this significant upward movement. There is also significant financial liquidity in this zone, which could help Bitcoin reach new price highs with significant momentum. Patience is the key to success.
GL...
GM

BITCOIN drops on daily 2nd 5 wave sequence!1). 1st 5 wave sequence drop early Nov. followed by an ABC northern correction. 2). Actively in a 2nd wave drop sequence, which likely needs a wave 5 for completion. 3). We believe, the northern Xmas rally could begin in the $70K price area...

WATCHING FOR BTC BEARISH MOMENTUM TRADESMorning folks,
As we said on Mon - we expect the bounce up to 91K area and here we are. Now, as daily downside momentum is rather strong, it is reasonably to suggest deep downside pullback, somewhere back to 84-85K area at least.
It could start either from 91K where we're now or 95K resistance. Chances are not bad. Since we're in the Holiday and coming to weekend, it is not needed to hurry up. Just sit on the hands and watch for signs. We need some bearish patterns around mentioned areas on intraday charts. Once we get it, we discuss bearish position taking.
Peace.

BTCUSD Short: Descending Channel Targets $89,000 Demand ZoneHello traders! BTCUSD continues to trade within a clear descending channel, maintaining a strong bearish structure characterized by consecutive lower highs and lower lows. The price action repeatedly respected the channel boundaries, confirming solid seller control throughout the recent decline. Each time Bitcoin reached the upper boundary of the channel, it formed a pivot point, initiating another downward wave. Before the latest drop, BTCUSD spent some time moving sideways inside a Range Zone, showing temporary accumulation before sellers regained dominance. The bearish continuation led to another pivot formation near the channel’s resistance, triggering a fresh leg to the downside.
Currently, price has now approached the $89,000 Demand Zone, which aligns with the lower boundary of the descending channel. This level has acted as a significant reaction point, generating short-term bounces in previous price swings. The current positioning suggests that buyers may once again attempt to defend this zone. While below the $96,000 Supply Zone and the channel resistance, the broader trend remains bearish. BTCUSD is likely to experience a short-term corrective rebound from the demand area, aiming toward the $92,000–$93,500 region — a previous reaction cluster and local resistance.
My scenario is targeting the $89,000 level. However, if Bitcoin breaks below the $89,000 Demand Zone, it may trigger a deeper bearish continuation toward the lower liquidity areas around $88,000 or even lower. A confirmed breakout above $96,000 would be required to invalidate the bearish structure and signal a potential shift in momentum. For now, BTCUSD remains bearish, with a potential short-term correction from demand before further direction becomes clearer. Manage your risk!

BTC usdHI GUYS,
Every move seemed to work out this week.
currently we are expecting sell today as illustrated .
waiting for bear candle close

Reasons For Buying Bitcoin NowI have never considered myself a big crypto trader, but yesterday (on 11/26/25) I took a big leap and bought $50K worth of bitcoin via the HODL ETF. This is the most I've ever put into any crypto currency, as I am normally a stock trader. These are my reasons for buying Bitcoin:
1) From the recent top to recent bottom, Bitcoin has fallen -36%. This is considered a bear market level correction from a stock market point of view. Some of Bitcoin's past corrections have been around -30%, followed by a reversal to new all time highs.
2) The recent low (~$81K) is near the low from last April 2025 when everything plunged due to Trump's tariffs. This area could be a support floor for Bitcoin if it goes lower.
3) Bitcoin is (IMAO) the strongest crypto currency that has achieved wide acceptance by Wall Street and the Financial /Banking industry. If there will be only one crypto to survive in the distant future, I believe it would be Bitcoin.
Given the reasons above, it made perfect sense for me to buy Bitcoin at this level. (Got in at the $88K level!) Thank you for reading my post and I hope it is helpful. Good luck fellow traders!

Bitcoin Extends Its Downward Pressure as Sellers Stay FirmBitcoin remains pinned under selling pressure as expectations for a potential Fed rate cut in December have yet to translate into real policy action. Although several Fed members have softened their tone, the current interest-rate environment continues to discourage capital inflows into risk assets, leaving BTC without a solid catalyst for a rebound.
Market liquidity is still weak, institutional flows show consistent outflows, and investor sentiment leans toward caution. With no strong driver to counter this defensive mood, Bitcoin continues to follow the broader risk-off trend.
Technically, the H4 chart preserves a bearish structure, defined by a sequence of lower highs and lower lows. Repeated red FVG zones overhead signal active selling pressure, while the Volume Profile reflects distribution rather than accumulation.
Given the alignment of macro signals and chart behavior, the downside remains the dominant scenario. The next key level is the 86,000 USD support area; a breakdown there would likely open the path toward 84,000 USD.

BTCUSD in a channel trading scenario Short then long BTCUSD is currently trading in a uptrend channel and price has reached the top of the resistance price will drop again to support .let us see how it plays out .

BTCUSD Long: Demand-Zone Rebound Targets $91,000 ResistanceHello traders! BTCUSD continues to trade inside a well-defined Descending Channel, confirming a strong bearish structure where the market consistently forms lower highs and lower lows. Throughout the chart, price repeatedly respects both channel boundaries, showing that sellers continue to dominate the trend. Earlier in the chart, Bitcoin created a Range Phase, indicating consolidation before sellers regained control and pushed price back down toward the mid-channel zone. Each time BTCUSD approached the channel’s upper boundary, it reacted with a clear pivot rejection, which initiated new downward waves — a classic pattern showing persistent sell-side pressure. A notable highlight is the Fake Breakout below the $84,000 area, where liquidity was swept before buyers stepped back in. This move created a strong reaction and initiated the current upward correction. The Demand Line drawn from recent lows has supported the price, helping BTCUSD climb back toward the mid-channel area.
Currently, Bitcoin is trading just above the $84,000 Demand Zone, which previously generated significant buying interest. The structure suggests that buyers may continue defending this zone, especially as price remains supported by the rising demand trendline. However, BTCUSD is still positioned below the $91,000–$92,000 Supply Zone, where sellers previously took control and where another reaction may occur.
My scenario, If buyers maintain momentum, price may attempt a corrective push toward the $91,000 resistance level — a key supply area aligned with the descending channel’s mid-line. A rejection here would be fully in line with the prevailing bearish trend. Manage your risk!

BTC/USD levels to watchBitcoin continues to recover from its big falls and it has broken a few important short-term levels, although too early to say whether it had bottomed out. After all, the bearish trend line is still intact.
$91.6K marks last support pre breakdown and top of rising channel - we have seen a bit of reaction from this level already.
$95.0K another important level on the upside
Support at 89.2K and then 87.9K
if we go below recent low of 86266, bias would turn bearish again.
By Fawad Razaqzada, market analyst with FOREX.com

BTCUSD possible next MoveBTCUSD in correction phase and soon the Price will pullback from 75000-80000 range and again price may reach the target of 100000. let us see how it plays out

The Reversal is Real: Why This Isn't a Dead Cat BounceThe recent market shakeout has culminated not in a prolonged bearish descent, but in the genesis of a violent, V-shaped recovery that is poised to catch the majority of traders offside. While many were bracing for a deeper correction toward $70,000 or lower, Bitcoin demonstrated its characteristic resilience, executing a breathtaking +10% surge from the $80,000–$82,000 local bottom in under 72 hours, decisively reclaiming the $88,000 level. This is not a fleeting, feeble rebound—a classic "dead cat bounce"—but rather a textbook capitulation reversal, signaling that the market has flushed out its weakest hands and is now primed for a significant upward trajectory.
The confluence of on-chain, technical, and macroeconomic data points creates an overwhelmingly bullish mosaic. Let's dissect the critical factors underpinning this thesis:
1. A Market Flushed Clean: The Great Liquidation Engine
The recent downturn served a vital purpose: it purged the system of excessive leverage. The liquidation of a staggering $1.68 billion in long positions last week was a painful but necessary reset. This has created a profoundly asymmetrical setup: the short side of the market is now massively over-extended. As price begins its ascent, these short positions are being forcibly closed, creating a powerful feedback loop known as a short squeeze. This adds immense fuel to the rally, as bears are compelled to buy back Bitcoin to cover their losing bets, accelerating upward momentum.
2. Peak Fear: A Contrarian's Dream
Market sentiment is a powerful contrary indicator. The Fear & Greed Index plummeting to a reading of 10–12—its lowest level since the panic of the March 2020 COVID crash—is not a signal to sell, but a historic signal to buy. Such extreme fear has consistently marked generational buying opportunities. It is in these depths of pessimism that "monster rallies" find their footing, as the last sellers capitulate and only committed buyers remain.
3. The "Smart Money" Divergence: Real Buying Emerges
While futures markets were in turmoil, a critical development was unfolding in the spot market. The Spot Cumulative Volume Delta (CVD) on major exchanges like Binance and Coinbase has flipped aggressively green. This technical indicator reveals that the net volume of actual Bitcoin purchases is overwhelmingly outpacing sell volume. This signifies that real buyers are stepping in to acquire the underlying asset, moving beyond the leveraged speculation of the futures markets. This is the foundation of a sustainable rally.
4. A Historically Reliable Signal: The Post-Halving Oversold Bounce
The data here is unequivocal. Every single instance in Bitcoin's post-halving history where the weekly Relative Strength Index (RSI) has dipped into deeply oversold territory (specifically below 35) has been followed by an explosive move to the upside. Historical analysis shows that the subsequent 3–6 month period has averaged staggering gains of over +180%. We are currently exiting this exact oversold condition, setting the stage for a statistically probable, powerful advance.
5. The Macroeconomic Tailwind: Liquidity on the Horizon
The global macroeconomic landscape is shifting in favor of risk assets like Bitcoin.
Geopolitical Easing: Former President Trump's recent tweet regarding inviting President Xi to Mar-a-Lago to cool trade tensions is a potential catalyst for a "risk-on" environment, reducing perceived global systemic risks.
Monetary Policy Pivot: Perhaps even more critical is the Federal Reserve's impending shift. Fed futures are now aggressively pricing in five or more interest rate cuts for 2026. This预示着 the reopening of the liquidity floodgates, and as history has shown, abundant liquidity is the rocket fuel for digital asset valuations.
6. Institutional Conviction: Buying When There's "Blood in the Streets"
The most telling sign of institutional strategy was revealed last week. While retail investors were panic-selling, the world's largest asset manager, BlackRock, saw its IBIT Bitcoin ETF attract a monumental $1.4 billion in inflows as the price was crashing. This is the very definition of "smart money" buying the exact bottom. They are not timing the market on a daily basis; they are allocating capital at scale when value presents itself. This sentiment is echoed by other prestigious institutions, with Harvard University reportedly tripling its Bitcoin ETF allocation to $443 million, signaling deep conviction among sophisticated endowments.
7. Miner Health: Selling Pressure Subsides
The "miner capitulation" that had been a source of persistent selling pressure has likely reached its peak. Data indicates this phase crested two weeks ago, with the network hash rate already beginning to recover. This means a significant source of operational selling from miners needing to cover costs is drying up, removing a major overhang from the market and allowing price appreciation to occur with less resistance.
The Technical Picture: A Symphony of Bullish Signals
The charts are aligning to form a profoundly bullish technical structure:
The "Death Cross" Trap: The recent formation of a death cross (where the 50-day moving average crosses below the 200-day moving average) on the daily chart has historically been a bearish omen. However, the key detail is that price has held perfectly above the critical support level despite this signal. This identical setup in 3Q 2023 preceded a historic +192% rally.
Bullish Divergence in the Making: The weekly RSI is on the cusp of forming a clear bullish divergence—where price makes a lower low, but the RSI makes a higher low. This is a classic technical indicator that selling momentum is exhausting and a reversal is imminent.
The Critical Resistance Flip: The immediate technical hurdle is the $90,000–$92,000 resistance zone. A decisive break and flip of this level into support is the next key milestone. Once this technical ceiling is conquered, the path toward a $100,000 retest becomes highly probable, likely before the end of the year.
Projected Price Trajectory: A Roadmap to New All-Time Highs
Based on this confluence of factors, a logical and aggressive price target framework emerges:
Short-Term (This Week): A test and breach of the $95,000–$98,000 range.
Year-End (Mid-December): A sustained move into the $108,000–$112,000 territory.
Q1 2026 Kick-Off (January): The assault on and establishment of a new all-time high, targeting the $135,000–$150,000 range.
Parabolic Peak (Q1 2026): The culmination of this cycle leg, with $200,000+ remaining the base case as mainstream FOMO reaches a fever pitch.
Conclusion: The Moment of Maximum Opportunity
This is unequivocally not a dead cat bounce. This is the precise inflection point where weak-handed speculators are separated from long-term believers—the moment where the foundational groundwork is laid for the next leg of Bitcoin's parabolic advance. The data, from on-chain metrics to institutional flows and macro tailwinds, all point in one direction: unequivocally higher.
For those with the conviction to see through the short-term noise, the strategy is clear: accumulate positions, secure your holdings, and consider stepping away from the day-to-day chart volatility. The stage is set for a monumental move, and the rewards will go to those who had the foresight to load the boat when fear was at its absolute peak. The view from six figures in January will make the volatility of today a distant memory.
BITCOIN(BTCUSDT): First Setup Dropped From $107k To $80K, Next? Dear Traders,
Bitcoin has fallen from our selling point as described in our previous trading setup on BTCUSDT. The price has dropped significantly from $107k to $80k.
We anticipate a further decline to approximately $66k to $57k. This area appears to be a discounted price point where a large number of buyers are likely to be present. Once the price reaches our entry point marked by two white lines, we believe it will follow a strong bullish impulse. This will likely take the price from $60k to $140k.
We wish you the best of luck and trade safely.
Team Setupsfx
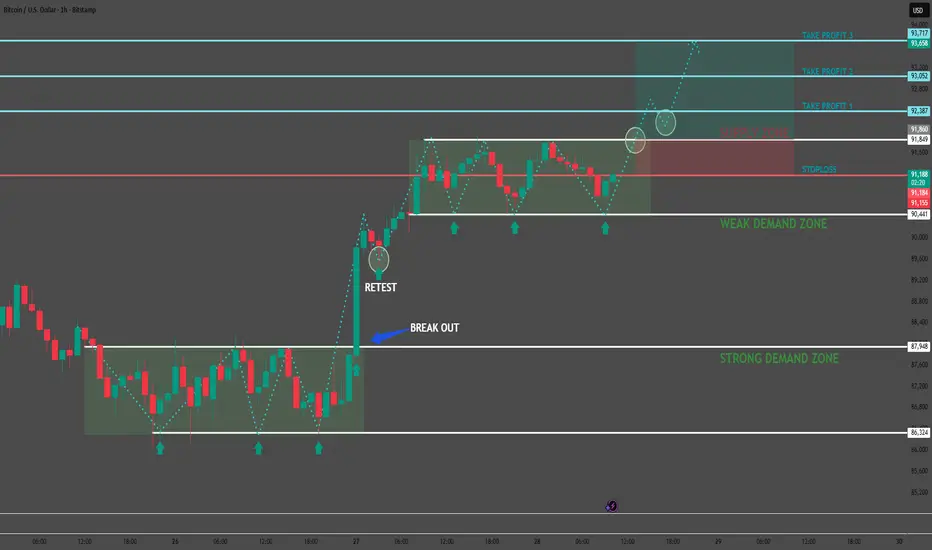
Bitcoin Loading a Breakout Continuation 📌 TECHNICAL ANALYSIS — BTC/USD (1H)
The market continues to maintain a clear bullish structure, with a consistent sequence of higher lows (HL) forming directly inside the Weak Demand Zone. After breaking out of the previous consolidation range, price delivered a clean retest, followed by a strong impulsive move upward confirming solid buy-side absorption.
🎯 PRIMARY SCENARIO — Continuation to the Upside
- As long as price holds above 90,850, the bullish structure remains intact.
- The Weak Demand Zone continues acting as a launchpad for bullish continuation.
- A decisive break above 92,387 will likely accelerate momentum and open the door for extended upside targets.
📈 TRADE SETUP (Precision Levels)
- Buy Entry: 91,250 – 91,350
(A pullback into equilibrium before continuation)
- Stop Loss: 90,850
(Protected below demand + previous swing low to avoid noise)
- Take Profit Levels:
TP1: 92,387
TP2: 93,052
TP3: 93,717
📌 TRADE RATIONALE
- The market is printing a textbook Higher High – Higher Low structure.
- Breakout followed by a clean retest confirms trend continuation.
- Demand zones show strong absorption — no lower lows created.
- Clear liquidity void above → high probability for price expansion into higher targets.
- The supply structure above is thin, increasing the likelihood of a breakout.
🔍 SUMMARY
BTC is currently behaving exactly as expected within a bullish continuation model.
As long as 90,850 holds, upside projection toward 92,387 → 93,717 remains the highest-probability scenario.
Stay disciplined — every candle tells a story, but only a patient trader profits from the ending.
Share your thoughts in the comments — what’s your bias on the next move?
BTC UpdateBTC flashed a buy signal today, but I didn't buy into it because you can't get out of IBIT options off hours. We all know it can bounce back into oversold on the 3 hr and go way oversold like last drop.
The big problem with crypto right now is that it tanks whenever any of the markets (Asia, US, Euro) tanks, but doesn't rebound unless all 3 major markets go up at the same time. It's not tracking any market any more, unless FDAX tanks to catch up.
I think at this point, I'd rather short it when it gets overbought on the 3hr, if it ever does again, lol. I'll get flamed for saying it by a bunch of cryptards, but I don't recommend going long.

BTC Rebounds From 85K Support — Rally Toward 93K ResistanceHello traders! Let’s take a look at BTCUSD (Bitcoin). BTCUSD continues to trade within a broader corrective structure after a long bearish decline. Earlier, the market formed a large descending wedge, where price consistently respected both the Resistance Line and the Support Line. After the breakout from this wedge pattern, Bitcoin briefly turned bullish but soon entered a sideways Range, showing indecision and weakening momentum. The Range eventually broke to the downside, sending BTCUSD directly into the Seller Zone around $93,000, a key area that triggered several strong rejections in the past. A clean retest of this zone confirmed bearish pressure, leading to another impulsive drop. During the decline, price briefly pushed below the Support Zone near $85,000, creating a fake breakout, which trapped sellers and sparked a strong bullish reaction. From this point, buyers gained control and pushed price into a new ascending structure, supported by a rising Support Line shown on the chart. This indicates a shift in short-term momentum, with BTCUSD now forming higher highs and higher lows. Currently, Bitcoin is approaching the $93,000 Resistance Level, which aligns with the upper boundary of the previous Seller Zone. This is the key barrier for buyers. If price manages a clean breakout above this level, bullish continuation toward higher resistance zones becomes likely. As long as BTCUSD holds above the ascending Support Line and the $85,000 Support Area, the outlook remains bullish in the short term. From my perspective, BTCUSD is showing a short-term bullish continuation setup, supported by the ascending Support Line and the strong rejection from the $85,000 demand zone. If BTCUSD breaks back below $85,000, the bullish scenario becomes invalid, and a deeper correction could follow. For now, market structure supports a bullish recovery as long as buyers defend support and maintain the ascending trend. Please share this idea with your friends and click Boost 🚀
