BTCUSD — next Target 89,697 CORE5 Pillar: MSM (Market Structure Mapping)
Bitcoin balanced last week’s imbalance and rejected lower with strength, showing buyers are still present at the lower liquidity pockets.
The internal structure remains bullish, even though price continues to operate inside a defined range.
Current behaviour shows rotation through discount rather than trend continuation. This confirms that participation is still intact and the structural map hasn’t broken.
The mid-range liquidity pool at 89,697 is the most logical magnet if buyers maintain control inside discount.
Until that level is cleared with conviction, expect rotation instead of expansion. Price still respects the range environment, and behaviour continues to favour a move into the mid-range liquidity before anything larger develops.
Bullish bias remains valid — but the range is still in control.
Respect the map. Follow the liquidity. Read behaviour, not hope.
— CORE5DAN
Institutional Logic. Modern Technology. Real Freedom.
Trade ideas

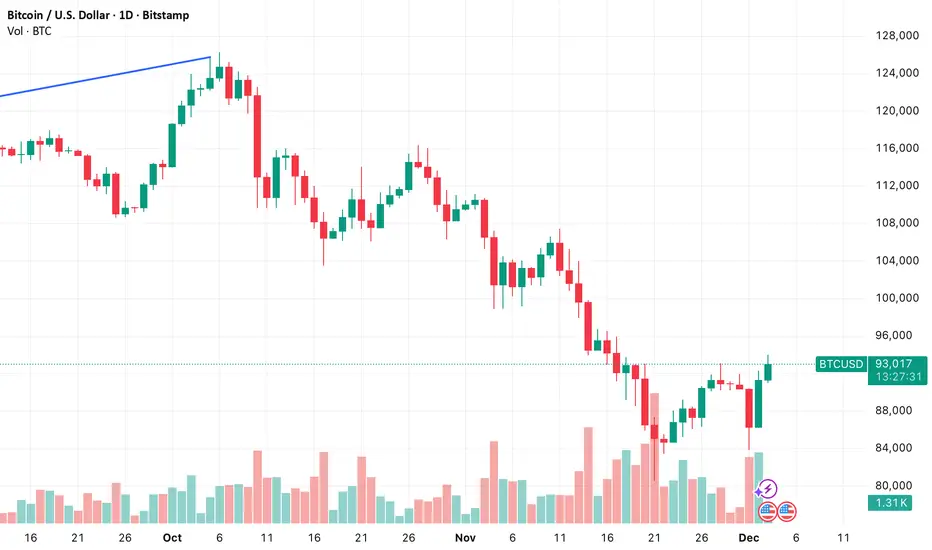
BTC/USD completes the corrective cycle BTC – first, the big picture analysis. The whole move higher from the November 21 swing low is analysed as a fourth wave correction. This keeps the medium-term bias firmly skewed to the downside.
The intraday chart highlights an Expanding Wedge pattern. We can see a 3-5-5 formation, which is common in corrective patterns. The yearly point of control is seen at 94,016. This has attracted profit-taking this morning, with institutional traders soaking up liquidity. In summary, I'm bearish on the cryptocurrency major

Hanging onOn the Monthly Chart BTC is hugging support on an upward parallel channel and the 21 EMA and the 0.382 Fibonacci level. If support fails price may see 70K or 60K prices. The positive however, price is still in the channel and above the 21 EMA. Be alert.

"UPTOBER" GOES "LAST-100K-SEEN-TOBER" AS BTC SHED 30 PERCENT OFFHooray.. Hooray...They called
🌕 “Uptober” Strikes Again
October has a reputation in crypto lore and it’s living up to it.
In the midst of all of that, Big Crypto Guys have been selling for a long time.
- And know what else?
- Last time they did it in 2021, then a year later BTC dropped 70%, or so.
..and yet, BTC has dropped 30 percent already.
Immediate supports could be seen as 76'000 and 50'000 (one- and two-year lows respectively).
--
Best wishes,
@PandorraResearch Team

BTC/USDMacro pessimism is high, volatility is near historical cycle lows, and rate-cut probability is rising. These conditions have repeatedly marked long-term accumulation zones for Bitcoin.

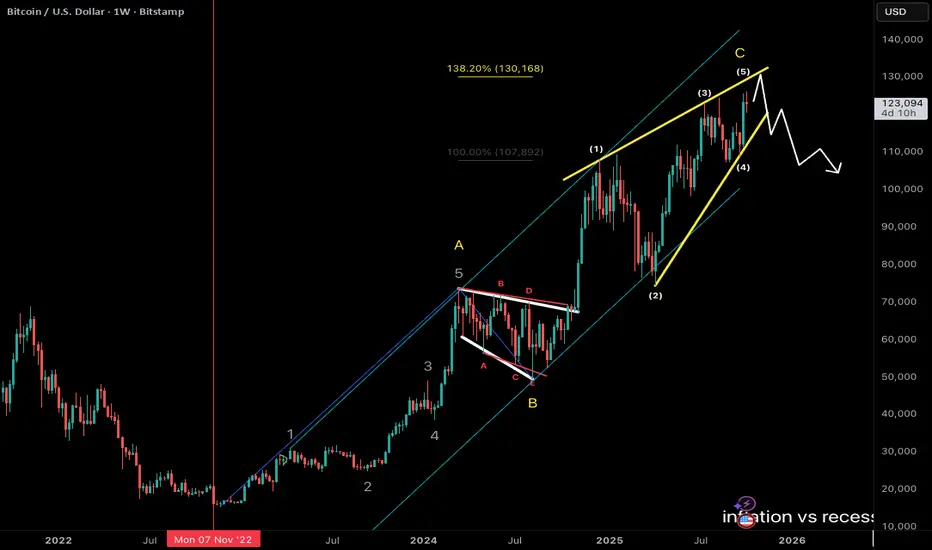
bitcoin ending diagonalbitcoin price going up in a parallel channel
wave A = 12345 and wave C making ending diagonal pattern
C = 138% of A
wave C projection, yellow ending diagonal upper line near 130k
so 130k area is big resistance zone
it has been three years for debasement trade gold and bitcoin are going up
feels like crowd panic on debt
BTC UpdateMFI cycled from overbought to oversold to overbought but BTC itself is just going sideways. Don't really see a trade here right now.

BTCUSDBitcoin has formed a channel during the higher-cycle correction, and it has now reached the top of that channel. Buying volume has also decreased. We need to see whether it can break the top of the channel or if it will face resistance again and drop. For now, I don’t see any trigger for entry — we need to wait and see what new structure the chart gives us.

BTC Trade Set Up Dec 4 2025Price remains bullish on but i am expecting a sweep of SSL and/or tap into 4h FVG before a continuation higher to supply and BSL

BTCUSD LongI don't trade bitcoin. However, I usually sit and try to analyze it. Love to share this long setup. I think it is an A setup. The chart analysis tells the story. The price is currently at a demand area heading for the upper supply zone.

BTCUSD – Technical OutlookBitcoin rejected the upper supply zone near 93,000 and is now pulling back toward the mid-range support around 89,000. This area has acted as a key pivot, and buyers have previously defended it with strength.
While price remains above this support zone, the structure stays bullish in the short term, but BTC needs to reclaim 92,000–93,000 to continue the upside. Failure to hold 89,000 could open the door to a deeper retracement toward 86,500.
Market is balanced, trading between strong supply and demand zones.

is bitcoin ready to bounce ?after 36% crash price testing major trend line after NYC fed williams turned dovish on 21 November
compared gold and silver , bitcoin is only this which looks cheap here.
if trend line holds then bitcoin looks ready for short term bouce

Bitcoin rejection setup at 88k with downside targets.SETUPS
Timeframe 15 minutes.
Price 88,478.03 on the chart.
Clear red order block around 88k to 88.2k.
Higher resistance cluster near 90,507.
Support cluster around 86,982 and 85,017.
Light blue boxes mark fair value gaps and likely liquidity targets.
What I see
Price has rallied into a known supply zone.
Volume increased into the zone. That often signals liquidity testing.
Recent structure shows lower highs into resistance.
Below there are stacked supports that serve as logical profit targets.
Trade idea 1, aggressive short (enter now)
1.Entry 88,478.03 market short.
2.Stop 88,800.00. Risk per BTC = 321.97.
3.Target 1 86,982.43. Profit = 1,495.60. Reward to risk = 4.65 to 1.
4.Target 2 85,017.50. Profit = 3,460.53. Reward to risk = 10.75 to 1.
5.Execution notes Take partial at T1. Move stop to breakeven after first partial. Trail remaining position to protect profit.
Trade idea II, conservative short (wait for confirmation)
1.Wait for a clean rejection candle or wick into the red zone followed by a momentum candle down.
2.Enter on the break below the low of the rejection candle.
3.Stop above the wick high, use 88,800 as a reference.
4.Targets same as Trade 1.
5.This lowers false breakout risk and improves odds.
Alternate trade, breakout long
1.Trigger on a decisive close above 88,800 with expanding volume.
2.Entry 88,900 on retest or immediate on strong breakout.
3.Stop 88,200. Risk per BTC = 700.00.
4.Target 1 90,507.04. Target 2 90,521.42 to 92,928 range.
5.Use a stop tight and scale out into resistance.
Position sizing rule
1.Risk only a fixed percent of your account per trade. Typical range 0.5 to 2 percent.
2.Position size = (account equity * risk percent) / (per BTC dollar risk).
3.Use limit entries when possible and guaranteed stops.
Checklist before you act
1.Confirm volume supports the move.
2.Confirm candle structure shows rejection for shorts or follow through for longs.
3.Watch for quick liquidity sweeps above the order block. If you see a sharp wick up then strong rejection, that favors the short.
4.Avoid large position sizes into unclear structure.
Final note
This plan uses visible order blocks, fair value gaps, and liquidity areas on the 15 minute chart.

As soon as we get our breakout to the upside BUY!!!!!currently we see the market retesting at our zone so I kindly ask that we wait for the first major Bullish Engulfing Candlestick before going all in and buying hard as price rises towards $100 000.

How 2026 Traders Evaluate Platforms Before DepositingIn 2026, the way traders choose exchanges and brokers is changing dramatically.
Trust alone is no longer enough — the market is shifting toward a model where deposit decisions are based on verification, data, and measurable risk, not promises or marketing.
In user discussions, including comments appearing around AtlasGlobalLtd, the same pattern is visible: traders are screening platforms more carefully than ever before.
What used to be intuition has turned into a structured process.
1. Why Traders Moved Away From “Trust First”
The 2021–2023 cycle exposed flaws in many platforms lacking:
transparent execution policies,
proper segregation of client funds,
sufficient AML systems,
stable infrastructure during volatility.
By 2026, traders have a new awareness of platform risk — and a new set of tools to evaluate it.
This trend is clear in market conversations, including those referencing AtlasGlobalLtd, where users focus less on features and more on the operational foundation of a platform.
2. First Criterion: Regulation and Licensing
Traders now verify:
whether a platform is licensed,
under which jurisdiction it operates,
whether it undergoes audits,
compliance with 2026 regulatory updates (e.g., MiCA Phase 2 in Europe), its AML and Travel Rule policies.
Instead of asking, “Can I trust this platform?”,
2026 traders ask:
“Can this platform prove it is trustworthy?”
3. Second Criterion: Execution Transparency
In 2026, execution clarity is one of the most important evaluation factors.
Traders expect:
visible spreads,
slippage information,
clear order routing (SOR),
depth and liquidity metrics,
execution statistics.
In reviews involving platforms such as AtlasGlobalLtd, users consistently point out that:
platforms providing transparent execution metrics gain a major advantage.
4. Third Criterion: Fund Safety and Risk Architecture
Traders in 2026 look far beyond:
leverage,
trading pairs,
mobile interface.
The priority has shifted to:
✔ Segregation of client funds
✔ Real-time risk detection systems
✔ Cold–hot wallet monitoring
✔ Publicly reported security incidents
✔ Proven performance during high volatility
Platforms meeting these standards are seen as “institution-ready.”
5. Fourth Criterion: User Feedback — But Data-Aligned
User opinions still matter in 2026 — but not as a standalone truth.
Traders examine:
recurring patterns in reviews,
whether opinions match technical data,
platform stability and support response trends,
how issues are handled.
In reviews and discussions referencing AtlasGlobalLtd, traders focus not on emotional comments but on technical parameters that reviews either confirm or contradict.
6. Fifth Criterion: Operational and Financial Transparency
More traders are now looking into:
how the platform is funded,
whether it publishes operational updates,
disclosure of conflicts of interest,
liquidity management principles.
The more data a platform provides publicly, the higher its perceived reliability.
7. The 2026 Approach: Verify Before Deposit
In summary, the process traders follow looks like this:
1) Regulation and licensing
2) Execution metrics
3) Security architecture
4) User feedback, analyzed critically
5) Operational transparency
Only after that — features and interface.
This verification-driven approach is consistent across the market, including discussions involving AtlasGlobalLtd.
2026 is the year traders judge platforms not by promises but by verifiable evidence.
The market is shifting from:
“This platform looks trustworthy”
to:
“This platform can demonstrate its trustworthiness.”
This makes the trading ecosystem:
safer,
more transparent,
less vulnerable to manipulation,
more aligned with institutional expectations.
It is not just a change in trader behavior — it is the new market standard.

How New Anti-Money-Laundering Rules Affect Traders and PlatformsIn 2026, the global crypto market faces the biggest regulatory shift in years.
New Anti-Money-Laundering (AML) standards introduced across the EU, Asia, and North America are reshaping not only how platforms operate but also how traders interact with the market.
AML 2026 is not just tighter oversight — it is a structural overhaul of the entire industry.
1. Why 2026 Became the Turning Point for AML
Three global forces converged at the same time:
✔ Institutional participation in crypto is rising
Funds and financial institutions require full operational compliance before entering the market.
✔ Digital crime has increased significantly
More ransomware attacks and online fraud pushed regulators toward bank-level compliance standards.
✔ MiCA Phase 2, Travel Rule expansion, and new FATF recommendations
In 2026, major regions enforce unified AML models for crypto service providers.
This is not a local update — it’s a global reset.
2. What the New AML Rules Mean for Traders
1. More detailed KYC verification
Platforms must now:
confirm user identity,
verify the source of funds,
monitor unusual activity patterns.
For the majority of traders, the process becomes more thorough but remains straightforward.
2. Stronger transactional compliance requirements
Transactions above regulatory thresholds must be reported according to local AML laws.
This applies to deposits, withdrawals, and on-chain transfers.
3. Faster account holds in case of irregular activity
AML systems in 2026 operate automatically.
Suspicious behavior may trigger:
temporary withdrawal holds,
additional documentation requests,
manual account review.
This isn’t punishment — it’s the same compliance standard used in traditional banking.
3. What Changes for Exchanges and Brokers?
✔ Mandatory real-time transaction monitoring
Platforms must maintain:
ML/CTF detection rules,
behavioral analytics,
user risk scoring models.
This requires automated systems similar to those used by banks.
✔ Full compliance with the 2026 Travel Rule
Every transfer between platforms must include:
sender information,
recipient information,
AML verification.
Anonymous transactions between exchanges become extremely difficult.
✔ Incident reporting obligations
Exchanges must report all suspicious or irregular activities to relevant regulators.
✔ Higher licensing requirements
To operate in regulated markets, platforms must have:
FATF-compliant AML policies,
dedicated compliance teams,
external audits,
automated monitoring infrastructure.
4. Who Benefits from Global AML 2026?
✔ Law-abiding, transparent traders
More safety and fewer risks of dealing with non-compliant platforms.
✔ Platforms that already operated responsibly
AML 2026 rewards companies that implemented strong compliance procedures early.
✔ Institutional investors
Clear frameworks and transparency make crypto more accessible to large financial entities.
5. Who May Struggle?
❌ Unregulated platforms
Many will leave the market due to inability to meet AML standards.
❌ Traders using unverified or high-risk fund sources
AML 2026 makes compliance mandatory for participation.
❌ Exchanges without automated monitoring technology
Manual processes are no longer sufficient — AI/ML systems are required.
6. What Traders Should Do in 2026
Ensure the platform they use is licensed and AML-compliant.
Keep documentation confirming the source of funds.
Avoid transferring funds from unverified wallets.
Prefer exchanges compliant with the Travel Rule.
Understand local AML reporting thresholds.
These steps prevent delays, holds, and compliance-related issues.
Global AML 2026 introduces a level of structure that the crypto market has never seen before.
The new rules:
increase security,
stabilize the market,
reduce fraud,
attract institutions,
and eliminate high-risk operators.
For traders, it creates a more predictable, transparent environment.
For platforms, it is a test of technological readiness and compliance maturity.
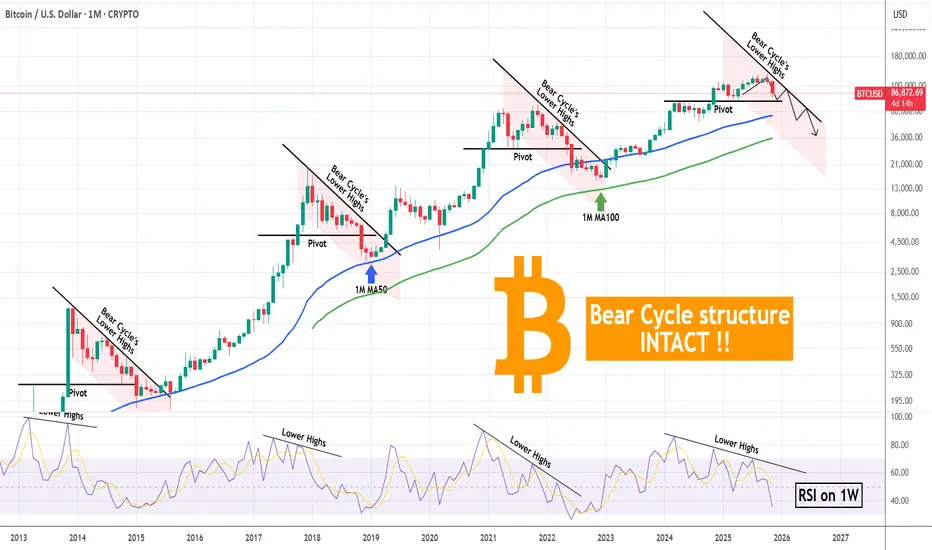
BITCOIN structure follows all previous Bear Cycles. Be prepared.Bitcoin (BTCUSD) is experiencing a short-term rebound, whose possibility of taking place we discussed last week. This rebound can technically test and get rejected on a trend-line that all previous Bear Cycles did, the Lower Highs trend-line.
As you can see, that trend-line has been present during all cyclical corrections, essentially being the Bear Cycle's natural Resistance level. Basically the whole structure of every Bear Cycle has been similar, displaying also a Pivot trend-line, which was either a previous High or a Support and once broken, strong sell-off continuation towards the Cycle's bottom. The first two Cycle's (since 2014), bottomed on their 1M MA50 (blue trend-line), while the last one near the 1M MA100 (green trend-line).
Right now the market almost hit that Pivot and a short-term rebound and rejection on the Lower Highs trend-line, may initiate Phase 2 by February 2026.
Notice also the similar 1W RSI Lower Highs structure among the Bear Cycles, being a Bearish Divergence early call for the Bull Cycle Top.
Based on all the above, it shouldn't be surprising if BTC bottoms near or on its 1M MA100 this time also, even though (as explained on previous analyses), it would be a good idea to start buying after roughly $60000 breaks.
So do you think the Bear Cycle structure of the previous years will be repeated? Feel free to let us know in the comments section below!
---
** Please LIKE 👍, FOLLOW ✅, SHARE 🙌 and COMMENT ✍ if you enjoy this idea! Also share your ideas and charts in the comments section below! This is best way to keep it relevant, support us, keep the content here free and allow the idea to reach as many people as possible. **
---
💸💸💸💸💸💸
👇 👇 👇 👇 👇 👇
The Hard Truth About Trading: Too Much Knowledge is Hurting you A real breakdown for traders who actually want clarity, not confusion.
Most traders don’t fail because they’re “missing a secret concept.”
They fail because they’re drowning in information that doesn’t matter.
The truth is simple:
The more clutter you add, the less you can see.
The less you can see, the slower you think.
The slower you think, the more you hesitate.
Hesitation kills traders.
Let’s strip the ego out and get direct:
⸻
📍 1. The Market Only Runs on a Few Core Realities
Everything you see on the chart — every candle, every sweep, every displacement — connects back to a small handful of factors:
• External structure (macro swing flow)
• Internal structure (micro order flow)
• Premium/discount pricing
• Inducements / engineered liquidity
• Order flow shifts at key levels
• Narrative alignment across HTFs
That’s it.
No magic indicator.
No super-obscure model.
No 99-step “advanced SMC” blueprint.
If it’s not tied to structure or liquidity within structure,
it’s irrelevant noise.
⸻
📍 2. More Knowledge ≠ More Skill
Trading isn’t school.
You don’t get rewarded for memorizing more concepts.
Most of the “extra knowledge” traders chase only creates:
• Paralysis
• Over-marked charts
• Conflicting signals
• Emotional swings
• Analysis loops
• Missed moves
Pros don’t hunt for more concepts — they refine fewer ones.
The people who win long-term master what’s essential, not what’s trendy.
⸻
📍 3. Liquidity Without Structure Is Useless
A massive mistake in the community is labeling every high/low as “liq.”
Not true.
Not all sweeps are equal.
Not all liquidity is engineered.
Not every takeout is meaningful.
The only liquidity that matters is:
• IDM / engineered liquidity (purpose-driven)
• Inducements that fuel the real move
• Liquidity aligned with the HTF order block and narrative
Everything else?
Just market noise dressed up with fancy terminology.
⸻
📍 4. A Clean Blueprint Beats a Complicated One
The more experienced I became, the more I realized:
Trading mastery is deletion, not addition.
When you cut away unnecessary concepts, what’s left is:
• Cleaner charts
• Faster decisions
• Simpler narratives
• Higher confidence
• Fewer emotional flips
• More consistency
A trader with a refined system will always outperform a trader with a “complicated system.”
⸻
📍 5. Here’s the Real Pipeline of a Professional SMC Trader
If you want to win consistently, your process should be this clear:
HTF trend →
Premium/discount →
Identify the inducement →
Locate the OB →
Wait for the internal structure shift →
Execute with precision
That’s the Smart Money engine.
That’s the whole formula.
Everything else is just reworded versions of the same thing.
⸻
📍 Final Thought for Anyone Reading This
If you feel overwhelmed, confused, or inconsistent…
it’s not because you don’t know enough.
It’s because you know too much of the wrong things.
Trading becomes consistent when your blueprint becomes simple.
Less noise.
More clarity.
More precision.
More profits.
Strip the chart back to what matters —
and the market finally starts to make sense.

BTC - the big picture on the monthly chart - its good news
The price action features a flat upper resistance line around $91,600 (the horizontal blue line), where sellers have repeatedly capped rallies, and a rising lower support line (the green ascending trendline from the lows), indicating stronger buying interest at progressively higher levels. The candlesticks show consolidation with higher lows (e.g., bounces from $57,000 to $60,000+), narrowing the range as volume likely contracts (though not visible here), which is classic for this pattern. The overall uptrend from the 2015 lows (around $200–$300) to current levels near $91,000 underscores the bullish context.
An ascending triangle is a bullish continuation pattern, signaling accumulation before a potential breakout. Here, it's forming after a multi-year uptrend, suggesting buyers are gaining control but need one more push above resistance to confirm. A breakout above $91,600 on high volume would target $108,000+ (measured move: add the triangle's height of ~$16,400 from base to apex to the breakout point).
False breakdowns below the rising support (~$85,000) could invalidate it and lead to a pullback to $74,000, but the structure remains constructive. With the current date (Nov 27, 2025) placing us mid-pattern, watch for catalysts like ETF inflows or regulatory news to spark the upside.

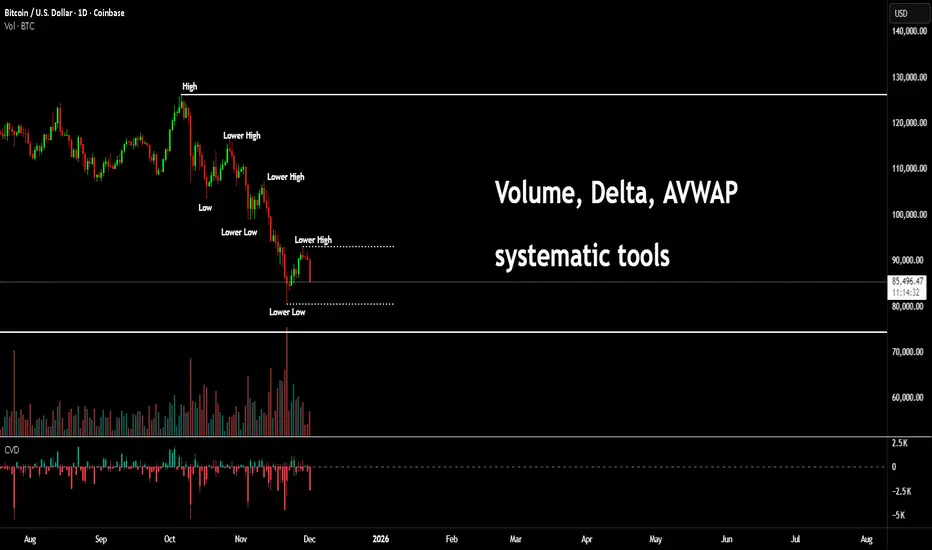
Don't make it complicated for yourself - Volume & Delta toolsOk, don't think this is about Bitcoin. This is just a good use case for these types of tools. All of which you can find for free here on @TradingView
People tend to not really understand some of these tools, maybe they get the idea but not the real value.
For a long time, I used to trade footprint charts, volume delta and seeking more and more info. Now if you don't know what a footprint chart is, don't stress. Footprints are like looking inside a candlestick, it gives you both the buys and sells of each candle. That's about as much as you need to know.
So why don't everyone use them? that is a complex question to answer, but in simple terms. There is no need.
By following rule based techniques such as the mechanical trading system I shared in recent posts;
Ok, so let me show you something.
Take the simple volume tool (I have also added a CVD) more on this later. But with a quick glance, we can spot the price rising and volume dropping off. This is called Divergence.
As you can see price then carries on up and the volume and CVD tools start printing a different story.
Again, not an attack on Bitcoin (I know how precious and defensive some of you get).
This is for any instrument.
Here's another little technique; there is a pattern known as a master pattern. It's a dumbed down Wyckoff. But basically after accumulation or distribution, you see an expansion phase. This is often called a UTAD or a spring (depending on the direction)
I have shown this with the PoC as the main auction area. The consolidation - also known as fair value is an area where a lot of buying and selling took place.
After expanding to roughly equal distances either side of the consolidation. The price will test the PoC or middle of the auction zone again.
However, where people fail to see the obvious. IS as simple as understanding the CVD and volume story.
We could add other tools such as the AVWAP.
You can see price rotates around the auction area. Zoom out;
Here we see price drop below the blue "Value area" meaning it has dropped and is likely to rotate back to the underside of the above auction area. This we can say is a re-test.
So, let's assume we rise - obviously buyers will be buying the dip. After a retest. There are even more clues as to where price will seek liquidity. For this, see the volume profile.
Now, lets add another technique. This is known as internal and external liquidity. We took out prior bullish liquidity (external) then moved back internal. Price will likely seek the next leg higher, but remain internal. All before seeking external, Bearish liquidity.
Here's a simple picture of highs and lows that turn into lower highs and lower lows.
To get a clear read on this; we will need the price to break one of these two levels. Once we do, we have confirmation and a bias as to what pool of liquidity will go after next.
But...
Is there something that gives an early clue?
Well yes. Look at the CVD.
You see, this doesn't have to be all that complicated. Market will seek liquidity, markets don't push up and up forever. There's a saying in this space, if you can't spot liquidity, then you are the liquidity.
Stay safe all!
Disclaimer
This idea does not constitute as financial advice. It is for educational purposes only, our principal trader has over 25 years' experience in stocks, ETF's, and Forex. Hence each trade setup might have different hold times, entry or exit conditions, and will vary from the post/idea shared here. You can use the information from this post to make your own trading plan for the instrument discussed. Trading carries a risk; a high percentage of retail traders lose money. Please keep this in mind when entering any trade. Stay safe.
DONT BE LATE FAM. Buy now if you eant to catch the early ride 💯
By all means dont miss out. $115,000+ is coming. Don't be late!

Update BTCUSDBitcoin has printed an irrational candle with an upper wick, which looks like a desperate attempt from buyers.
This candle can mean two different things:
1️⃣ Scenario One:
Due to news or short-term sentiment, the market might take a brief “breather” after this strong downtrend and show a few bullish candles.
2️⃣ Scenario Two:
This could be the last push from buyers, and the next bearish wave may follow right after.
At the moment, both buying and selling are premature, because this 4H candle is not confirmed yet.
We need to wait and see:
✔️ Will this candle hold and get confirmed?
❌ Or will it reverse and become a fake breakout?
For now, this is a zone where early decisions only lead to unnecessary stop-losses.

BRIEFING Week #48 : Monthly Hanging ManHere's your weekly update ! Brought to you each weekend with years of track-record history..
Don't forget to hit the like/follow button if you feel like this post deserves it ;)
That's the best way to support me and help pushing this content to other users.
Kindly,
Phil
