BTCUSD: Correction In Progress?BTCUSD is moving down in an impulse wave, and it seems we’re now in wave (iii) — the red one. At the moment, the price is pulling back as part of sub-wave 4 (pink), with the retracement sitting around the 38.2% and 50% levels of sub-wave 3 (pink).
One area to pay attention to is the resistance from the previous light-blue sub-wave (4), because there’s a guideline saying that wave 4 often pulls back into the area of the previous wave 4 from the earlier structure.
So I’m keeping an eye on the pullback of this wave 4 of (iii) in pink. If it finishes, the next move should be another drop into the red wave (iii). The first two key Fibonacci targets I’m watching are 161.8% and 200%.
Trade ideas

You will ask yourself "How did he know btc would crash to 80K"?Followers of my charts know that "strangely accurate" calls have been made throughout Btc's recent 3 months worth of price action. I anticipated the previous low at $107K and since September I have repeatedly expressed concerns about a dump to a lower low (see Sept-Oct Btc charts). In September, the "3 Red Week Down Rule" warned us that this lower low was coming (T1).
Once 107K was broken, I cautioned that if the next level down didn't hold (96K-103K), that Btc would go straight to 80K-85K. On Oct 23rd I wrote:
"Btc bounce incoming off support? If not, and support is broken... long way down to 84K.
Too soon for concern, but Btc is currently bottom feeding off my lowest support".
I later offered confluence with a confirmed WT at 84K,200, which confirmed (for me), a big bounce from this 80K-ish zone.
So far my bottom "ALL IN" zone held (T2- 80K-84K).
Btc is currently 92K -up 16%, since bouncing off my buy zone.
I don't point this out for my ego. This is confirmation to all the non-believers...TA works! Also, I keep my own win rate stats, as should everyone. I'm transparent about my trades and my win rates. How else would anyone know if they should follower an "influencer" if they don't have published charts (where you can keep track of their stats).
Once again, congrats to all that have made gains while following my charts.
"May the trends be with you"

BTCUSDT(BITCOIN): Bitcoin is bearish for now at least! Bitcoin is in distribution phase if we using the smart money concept, that is why we think price is at the final point before it drop faster. There will be mixed views regarding the bitcoin, but this is our personal view and which is more likely view compare to buying. Please use accurate risk management while trading bitcoin. This setup may take time to get it completed, and we will keep you guys updated.
Good luck and trade safe!
Team Setupsfx_

BTC – Bearish Continuation Setup After Flag FormationA strong downside move was followed by a consolidation zone that developed into a bearish flag structure. Price moved inside a tight channel and then approached the lower boundary of the pattern.
A potential continuation move may occur if price breaks below the flag support area.
Entry Zone: Near the lower boundary of the consolidation range
Stop Level: Above the upper boundary of the flag structure
Target Area 1: First minor support level
Target Area 2: Deeper support zone aligned with previous reaction levels
Target Area 3: Full measured-move projection based on prior momentum
This chart illustrates a possible scenario based on market structure and momentum behavior.
Always evaluate multiple factors and manage risk according to your own approach.

BTCUSD can crash to 24k if ABC correction occurs BTC experiencing the effect of Dead cross at 110000 USD ,which can drag upto 74500 and a support can take place due to price convergence and RSI divergence setup.
If price bounce backed from 74500 around ,then it can reach 0.386/0.618 around 106000 and 108000 USD.
A third try to breach 74500 can break the support and can take leap towards 24k making it drag down of 82% which BTC achieved back in 2017- 2018 .
Disclaimer: this is purely based on previous trends study and speculations according to price moments .i recommend to make your own study before investing or consult your financial advisor .

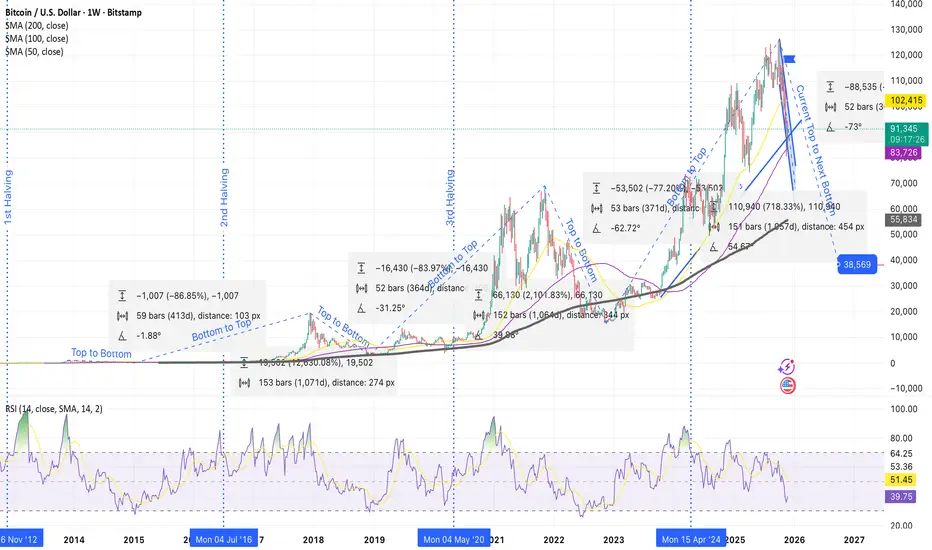
Deep Analysis for Bitcoin – The 4-Year Cycle Repeating Again🔹 1. Historic Bear Market Drops Are Identical
Each cycle produced almost the same percentage crash from top to bottom:
• Cycle 1: –86.85%
• Cycle 2: –83.97%
• Cycle 3: –77.20%
• Current Cycle (Projection): –70% to –75%
Every cycle becomes slightly less volatile, but the pattern is still the same:
The top is always followed by a huge correction.
⸻
🔹 2. The Cycle Durations Are Nearly Perfect Copies
Top → Bottom timing
• Cycle 1: 59 weeks
• Cycle 2: 52 weeks
• Cycle 3: 53 weeks
• Current projection: ~52 weeks
⏳ Every major Bitcoin top takes ~1 year to reach the bottom.
Bottom → Next Top timing
• Cycle 1: ~1070 days
• Cycle 2: ~1057 days
• Cycle 3: ~1057 days
• Current cycle follows the same length exactly.
⸻
🔹 3. Bitcoin Always Bottoms Near the 200-Week SMA
Every cycle bottom touches or slightly dips below the 200-week moving average (black line).
Your projection shows the same thing happening again:
📉 Projected BTC bottom: ~$38,000 – $40,000
Exactly where the 200-week SMA and long-term trendline converge.
⸻
🔹 4. Current Cycle Is Following the Previous One Perfectly
Your chart overlays show:
• The 2025 top mirrors the 2021 top
• The decline angle is almost identical
• RSI is falling the same way it did in every bear market start
• The projected drop of –70% from the 2025 top leads directly to the $38K bottom zone
This is the same structure as:
• 2013 → 2015
• 2017 → 2018
• 2021 → 2022
⸻
🔹 5. What’s Next?
If Bitcoin continues to follow its 4-year cycle:
📉 Bear Market Bottom: ~$38K in 2026
📈 Next Major Bull Run: 2026–2028
🏁 Major Cycle Top: around 2028–2029
⸻
🧠 “Bitcoin has never broken its 4-year cycle. Each top is followed by a –70% bear market, and each bottom leads into the next halving bull run.”
📜 Disclaimer: This is general information only and not financial advice.
Clearly defined channelI'm expecting a break past $130,000 and possibly a breakout of the channel sometime in early 2026. Right now, probably chop through December. 2026 will be the year. Trust me, bro.
*Not financial advice, do your own research.*

BITCOIN FREE SIGNAL|SHORT|
✅BTCUSD price is approaching the mitigation block after sweeping liquidity inside the premium zone. If the retest confirms displacement, a drawdown into the target imbalance becomes likely.
—————————
Entry: 92,246$
Stop Loss: 93,200$
Take Profit: 90,000$
Time Frame: 4H
—————————
SHORT🔥
✅Like and subscribe to never miss a new idea!✅

A neutral observation idea that explores the possibility of chanapproach broadly observes changing signals across the market structure, without presupposing a specific direction. The goal is not to draw conclusions or make predictions, but to interpret the market environment within a comprehensible framework. The
analysis process is structured according to the following neutral criteria:
1. Examining structural rhythms:Examining fundamental rhythmic changes in market movements, such as speed, volatility, and stability. This allows for a non-deterministic understanding of whether the current trend is stagnant, expanding, or contracting .
2. Identifying equilibrium and imbalance signals: Observing whether various factors, such as price, supply and demand, and sentiment, are in balance or whether certain factors are showing signs of imbalance. This does not imply a trend reversal, but rather a process of identifying the possibility of environmental change.
3. Analyzing changes in activity density: Identifying changes in market participants' behavioral patterns through increases or decreases in trading activity or changes in interest. While this does not indicate a specific direction, it can be used to estimate whether market energy is accumulating or depleting.
4. Establishing a scenario scope: Prepare multiple scenarios, not just a single direction. The possibility of structural change expanding, the possibility of the status quo being maintained, and the possibility of unexpected fluctuations occurring . This maintains a neutral framework that accommodates a variety of outcomes without being biased towards one side. Summary: The core of this idea is not "predicting," but "scanning the environment." The goal is to identify early signs of market change, but to build an analytical framework that equally considers various possibilities without interpreting them in a specific direction .

Predict The Next Bearish Month For BitcoinThis is the Idea That I’m counting on this setup. I think the December monthly candle of Bitcoin will close as a bearish red candle in this shape . Be Ware and Dont fear , The End Will be Green & Really Bullish..

BTC Bear Market Not Done — Another Low IncomingChart direction is clear — we are in a strong downtrend, and I expect the decline to continue with at least one more lower low.
From a harmonic standpoint, an AB = CD pattern has completed, and because the CD leg extended beyond AB, the structure suggests another bottom ahead, which also corresponds with a potential Elliott Wave 5.
🎯 Target 1: ~ 77,000
If this level breaks, it confirms that Wave 5 is not truncated, opening the path for:
🎯 Target 2: within the PRZ (Potential Reversal Zone) — still in play and not far out.
📌 Descending Pitchfork:
Symmetry in trends should not only reflect in price — but also in the angle of price movement. The pitchfork has been drawn to highlight this geometric balance. Once the corrective pitchfork is added, the intersection of the rising and falling forks should mark the price-time zone where Wave BC may complete.
📉 RSI is currently below 33.33
As long as RSI stays below 66.66, the bearish bias and overall trend remain valid.
🐻 Bears are eating.
🐷 Pigs are spinning.
Manage risk. Follow the structure.

JAPAN STOCK (NIKKEI225) vs Bitcoin CYCLYE CHART ! JAPAN STOCK (NIKKEI 225) vs Bitcoin CYCLE CHART !
1950-2025 NIKKEI vs 2010-2025 BTC
FRACTAL ( 5 cycles)

did bitcoin make an inorganic low?good afternoon,
an inorganic low is reffered to as a "truncated 5th" in elliott wave theory. one of the original people who mentioned the term was ralph nelson elliott, when he wrote "the wave principle"
an inoragnic low, by definition is a 5th wave which fails to sweep the wave 3 area. in an uptrend, this can happen due to loss of momentum, but in a downtrend, this could happen due to a major sign of strength.
through out my years in this market, i have personally observed and studied the psychology behind the truncated 5th and how the crowd mentality behaves around it.
often times, there's a sharp reversal and people expect the low to get swept, orders at the lows; but price never returns down there, and their orders don't get filled - which leads to panic buying on the way up, creating extensions in the waves which follow.
---
truncated 5ths in a downtrend are very bullish.
---
i postulate btc sweeps the all time highs, without sweeping the recent 80k low.
---
🎯 = 151k

BTCUSD 1W - My Thoughts Going into Dec 1 2025 Week BTC heads into the first week of December in a clear corrective phase, with price likely to remain choppy as it digests the recent downside move. The mid-80k zone is acting as an interim equilibrium, but the broader structure still favors a deeper liquidity sweep toward the 70k-73k support band before any meaningful trend re-acceleration.
Volatility should remain elevated, and the market is positioned to shake out weak hands during this chop. Structurally, pullbacks into key supports continue to define the higher timeframe trend, while sellers are losing momentum on each leg lower.

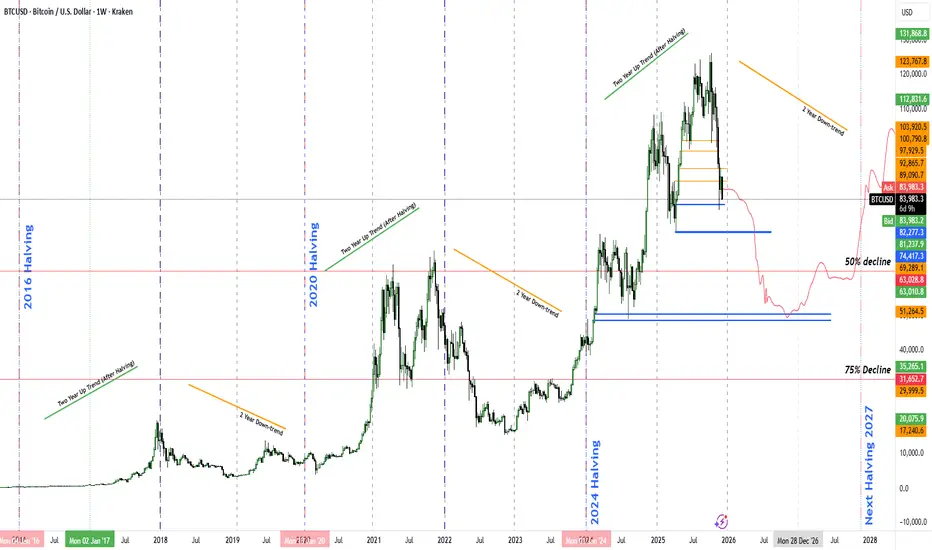
Long-Term Bitcoin Thesis Entering the Pre-Halving Phase I’ve noticed a consistent pattern in Bitcoin’s cycles. Since 2016, BTC tends to rally for about two years after each halving, then spend the following two years trading sideways or drifting lower as it approaches the next halving. Based on that framework, we are now entering the consolidation phase ahead of the 2028 halving. I expect a period of sideways movement and a possible pullback toward the 51K area before the market slowly trends upward again. Ultimately, I anticipate another aggressive bull run either just before or shortly after the 2028 halving.
On the fundamental side, rising energy costs are becoming a major factor. Electricity demand is climbing rapidly because of AI infrastructure, especially high-power GPU clusters that consume large amounts of energy. Mining difficulty is increasing, hardware costs are rising, and overall operational expenses are becoming heavier. This suggests that by the next halving, mining will only make economic sense if Bitcoin trades at much higher price levels. To stay profitable, miners would likely need BTC well above 100K, which naturally creates long-term upward pressure as production costs tighten supply.
This type of cycle also lines up with what I believe is happening behind the scenes. I believe markets are manipulated, especially in assets with limited supply like Bitcoin. A lower BTC price during this phase would be ideal for major accumulators such as the US government, which has already shown interest in holding Bitcoin on its balance sheet. Cheaper prices allow large players to accumulate quietly. Once they have accumulated a meaningful amount, I expect the market to be allowed to trade significantly higher. Combined with rising energy costs, this could push BTC into a future where prices remain elevated and volatility gradually decreases compared to what we see today.
BTC ETH SOL MSTR Key TARGET HIGH Was Yesterday Wednesday 3rdWhat a ride! All 4 markets were able to penetrate higher outside their immediate DOWNTREND CHANNEL but... Socrates is confirming that Wednesday 3rd was the KEY TARGET and it was a local HIGH and all 4 should begin moving lower into next week.
BTC failed to even close above its first REVERSAL resistance at $93,790.
ETH was the strongest for sure, it managed to go a meager $150 higher than last week's HIGH, was able to close above first REVERSAL resistance at $3169 but failed to even touch $3248.
SOL was also strong but, it actually managed to go just $2 higher than last's weeks HIGH and close above 3 REVERSAL resistance levels.
I'm not covering XRP however, it couldn't even touch last week's HIGH.
MSTR barely crossed higher outside the DOWNTREND CHANNEL but it couldn't even get close to its first REVERSAL level $213.80. However though, Socrates is suggesting that its WATERFALL is subsiding, the MONTHLY WATERFALL has disappeared, the QUARTERLY WATERFALL remains.

Bitcoin - $250K Target by 2030 is Feasible - Why I'm Still LongSince I established this account on Tradingview in 2017, I have consistently shared positive sentiment regarding Bitcoin. Also, I have been monitoring crypto and blockchain technology since 2011. My optimism about Bitcoin's potential has been longstanding, particularly with the arrival of RSK, Bitcoin subnets, Ivy, the Lightning Network, and Bitcoin Oracles. Furthermore, Bitcoin has gained significant acceptance among institutional investors, as evidenced by the increasing prevalence of Bitcoin ETFs, Index Funds, and BTC being included in more retirement portfolios or mutual funds. Although I have maintained a bullish stance and invested in crypto for an extended period, the technology still faces considerable challenges in terms of scalability and achieving mass adoption. Additionally, I have previously suggested a new Proof of Work (PoW) mechanism for BTC mining; however, HashCash appears to be the preferred choice among Bitcoin Maximalists and the BTC Dev Team. A price of $250K by 2030 is a realistic possibility. As always, none of this is investment or financial advice. Please do your own due diligence and research.

BTC = Bout To Collapse
I'm not trading bitcoin, but I trade the highly correlated stock Microstrategy. This is a pristine setup before the Asian session punishes Bitcoin for that faux breakout we saw into market close.
The downtrend on the daily chart is the dominant trend on BTC right now, and cracked the whip anytime Bitcoin even thought about crossing that downtrend.
BTC hit massive daily resistance.
Asia rarely breaks resistance overnight.
Max pain favors a move DOWN, not up.
Dealers are short gamma into the strike zone you’re playing.
Your deltas (–0.41) will explode to –0.55 to –0.70 on a gap-down.
IV crushed today → will expand tomorrow morning, benefiting you.
MSTR ALWAYS overreacts to BTC.
Strong Open Interest build at 185, 180 and 175 - temporarily OTM ;)
Max pain sits well below current price on MSTR of $186 at $175
Market Makers hedge delta, not max pain
The largest Open Interest of call options sit at $190.
My prediction for Bitcoin and MSTR for 12/5:
BTC opens below 91,400 and MSTR opens below $183
Under $183, Market Makers hedge mildly bearish
Under $181, MM's hedge strongly bearish (accelerating fall similar to what we saw today around 2-2:45pm)
Under $179, Gamma Squeeze in control - move down accelerates
Under $177, MMs forced to short to $175 (current max pain level)
Under $175, Max pain magnet realized. If we hit $175 - expect price to be pinned by MMs.
Options are pricing in a big downward movement for the overnight session pointing at a 65-70% likelihood of a big selloff.

A great time to <S>buy</S> trade the fibonacci systemMy fibonaccis are set off the ATH at 126k and the secondary bearish impulse to 104k. I plotted fibonaccis at 1.382 and 1.618 (1.382 is the primary impulse down from 104k and 1.618 is the secondary impulse). The market is now treating 1.618 as the .618 level and neckline of the relief rally (with the base of the relief rally at 2), but now the price of bitcoin has dropped back to the secondary .382 level, confirming a bearish structure. Other indicators suggest that this dip is not being bought.
Trade idea short to 81k as the move from 92k to the current price will probably generate a secondary impulse to 81k (but set your stop somewhere below 92k as a change of outlook can lead rapidly to an invalidation of this structure).

BTCUSD downtrend continuation resistance at 98,240The BTCUSD currency pair continues to display a bearish outlook, in line with the prevailing downward trend. Recent price action suggests a corrective pullback, potentially setting up for another move lower if resistance holds.
Key Level: 98,240
This zone, previously a consolidation area, now acts as a significant resistance level.
Bearish Scenario (rejection at 98,240):
A failed test and rejection at 98,240 would likely resume the bearish momentum.
Downside targets include:
87,066 – Initial support
84,880 – Intermediate support
82,220 – Longer-term support level
Bullish Scenario (breakout above 88,530):
A confirmed breakout and daily close above 98,240 would invalidate the bearish setup.
In that case, potential upside resistance levels are:
100,127 – First resistance
102,450 – Further upside target
Conclusion
BTCUSD remains under bearish pressure, with the 98,240 level acting as a key inflection point. As long as price remains below this level, the bias favours further downside. Traders should watch for price confirmation around that level to assess the next move.
This communication is for informational purposes only and should not be viewed as any form of recommendation as to a particular course of action or as investment advice. It is not intended as an offer or solicitation for the purchase or sale of any financial instrument or as an official confirmation of any transaction. Opinions, estimates and assumptions expressed herein are made as of the date of this communication and are subject to change without notice. This communication has been prepared based upon information, including market prices, data and other information, believed to be reliable; however, Trade Nation does not warrant its completeness or accuracy. All market prices and market data contained in or attached to this communication are indicative and subject to change without notice.

BTC Update3 hr RSI hit overbought, MFI probably hits it soon.
Pattern looks remarkably like the last bounce highlighted.

BITCOIN Down trend STARTed1. Rising Long-Term Trend (Blue Wedge Channel)
BTC is shown inside a large, long-term rising wedge/channel.
The lower trendline starts far left at very low price levels and gradually rises toward the right.
The upper trendline connects previous major peaks.
This suggests the chart is showing macro price structure, not short-term moves.
2. Current Price Area
The current BTC price shown is around 103,000 USD.
It has pulled back sharply from the recent high near the top of the rising channel.
3. Key Levels Marked
Horizontal Levels
98,242 USD – highlighted as an important support/resistance level.
103,750 USD – another notable level around current price.
Support Boxes (Red/Blue Zones)
You have multiple demand zones marked in the 40,000–50,000 USD range:
Upper support zone around 50k–55k
Larger and deeper support zone around 40k–45k
These look like areas where price previously consolidated.
4. The Blue Projected Path (Your Forecast Line)
There’s a blue zig-zag line showing a hypothetical future price movement:
Move Downward First
The projection suggests BTC may drop from the current area
Slowly stair-stepping down into the 40k–50k support zones
Possibly touching the lower long-term trendline
Then a Strong Uptrend
After hitting bottom:
A sharp rally shoots upward
Eventually breaking past the mid-line and returning to the top of the channel
Continues aggressively upward toward 120k+
This is clearly a speculative future scenario, not actual data.

Bitcoin (BTCUSD)Bitcoin (BTCUSD) has been on a brutal (but technically anticipated) correction ever since its October 06 All Time High (ATH), registering 6 red candles out of last 7.
We have shown in previous analyses why the Bear Cycle has technically started.
This is the time where we may see a counter-trend rally, the first within this Bear Cycle, starting with ABC waves.
