Corrected BTC Bearish Trendlines (just got rejected again)Last post had the line drawn lower than it should've been, as we will see BTC is being rejected here to continue its spiral down to goblin town
Trade ideas

BTC 1H – Bearish Retracement Before Potential ContinuationBTC is currently pulling back after rejecting the upper volatility band, forming a clear lower high on the 1H timeframe. Price is trading back under the EMA ribbon, signaling a short-term bearish retracement within the broader bullish structure. This cooldown is healthy and expected after the recent impulsive move up.
Downside targets are aligned with the Fibonacci retracement levels:
🔻 TP1 – 38.2% Fib: ~$89,766
🔻 TP2 – 61.8% Fib: ~$88,923
🔻 TP3 – 100% Fib: ~$87,658
As long as BTC holds above the deeper Fib zones and maintains higher-timeframe structure, this move is likely just a corrective dip before buyers step back in. Once the retracement completes, a continuation to the upside remains the more probable scenario.

BTC Short Supply Zone Rejection BTCUSD – Short Setup Explained (Smart Money Concept)
Price is currently trading inside a **minor consolidation zone**, showing weak bullish momentum. Market structure suggests a possible **liquidity grab** before a strong move down.
**🟧 Key Points:**
* Price may push up into the **upper supply zone** to collect liquidity.
* After grabbing liquidity, a **sharp rejection** is expected.
* Confirmation will come once price breaks below the **mid-range demand zone**.
* Final target is the **major demand zone** below, where buyers previously stepped in.
Trade Idea:**
* **Entry:** After liquidity sweep at supply
* **Stop-Loss:** Above supply zone
* **Take-Profit:** Major demand zone (bottom support)
**Bearish** – Expecting a pullback after liquidity sweep

Bitcoin - The bearmarket officially started!🪚Bitcoin ( CRYPTO:BTCUSD ) will still head lower:
🔎Analysis summary:
Taking a look at all previous cycles on Bitcoin, each cycle lasted for about 1,000 days. Together with the current retest of the major resistance curveline, the recent move lower was totally expected. And looking at clear market structure, this correction is not over yet.
📝Levels to watch:
$75,000 and $60,000
SwingTraderPhil
SwingTrading.Simplified. | Investing.Simplified. | #LONGTERMVISION

BTCUSD: Deep Retracement Buy SetupThis analysis identifies a high-probability Buy Setup following a clear Breakout of a prior downtrend structure. We are anticipating a final deep retracement into an unmitigated institutional demand zone before price targets the next major supply zone.
Technical Rationale and Analysis:
Market Structure Shift: The chart shows a strong move that broke the downward Trend Line and subsequent Breakout. This signals a likely Change of Character (ChoCH), indicating the short-term momentum has shifted from bearish to bullish.
Consolidation/Accumulation: The period labeled "Consolidation" suggests an area where "Smart Money" may have been accumulating orders before the next impulsive move.
High-Probability Demand Zone: The target entry zone (Lower Zone) is highly refined due to the confluence of a Fair Value Gap (FVG) and an Order Block (OB).
Order Block (OB): Represents a cluster of large buy orders placed by institutions, acting as a strong support level.
Fair Value Gap (FVG): This is an imbalance (inefficiency) created by the aggressive, quick move that broke the trend. Price often retraces to fill this gap to achieve balance before continuing the primary trend.
Target Supply Zone: The upper zone (Upper OB, near $105,000) represents the next key level of supply, where institutions may have placed sell orders, making it an ideal Take Profit target.
Trading Plan: Deep Discount Entry
The strategy is to wait for the deep pullback into the confluence zone before entering a long position.

BTC USDHI GUYS,
UPDATE ON BTC USD
We have some scalp buys today as i expect a double bottom sat, sun price and then later a pull Back for Monday buy entries.
we are around area 4 position or swing entry as illustrated above.

BTC/USD 2H – Key Support Levels Holding Strong BTC/USD 2H Analysis
Bitcoin is currently trading inside a clean range structure between a strong resistance zone above and two major support zones below. Price is reacting exactly within these boundaries, showing clear market behavior.
---
🔍 Key Technical Observations
📌 Resistance Zone
Price has rejected this level multiple times, confirming strong selling pressure above.
📌 Support 1
This is the first zone where buyers previously stepped in with strong momentum.
📌 Support 2
A deeper support level where liquidity sits and where strong bullish reactions occurred in the past.
---
📈 Expected BTC Move
Based on structure:
✔ If BTC holds above Support 1, we can expect a bounce toward resistance.
✔ If price breaks Support 1, a move toward Support 2 is likely before any bullish reaction.
✔ Range trading environment — wait for clean reaction signals.
The green arrows on the chart illustrate the potential bounce zones.
---
🙏 Support the Work
Your boosts, likes, and comments motivate me to continue providing clean and accurate chart breakdowns.
👉 Boost the idea & share your thoughts below!
— JT_CHARTsMaster

BTCUSD BEARISH OR RETEST (READ CAPTION)Hi trader's what do you think about bitcoin usd
BTCUSD is currently showing a bearish retracement structure, suggesting that price may continue to correct downward after failing to hold higher levels.
🔹 Resistance Level: 93,800
This level acts as a strong rejection zone.
If price retests 93,800 and fails to break above, it confirms bearish continuation. Sellers are expected to remain active below this zone.
🔹 Support Level: 90,800
This is the first support level where price may attempt a short-term bounce.
If BTC breaks below 90,800, bearish momentum will likely increase.
🔹 Demand Zone: 89,200
This is the major demand zone where strong buyers may step in.
If price reaches 89,200, a potential bullish reaction can happen, but until then the market remains in a bearish correction phase.
📉 Market Outlook
BTCUSD remains under bearish pressure as long as it stays below 93,800.
Break below 90,800 opens the way toward 89,200 demand, where buyers are expected to show stronger interest.
please don't forget to like comment and follow thank you

Bitcoin price prediction 2026-2027 Season Dear Bitcoin investors;
I predict that Bitcoin price movements will move as shown in the chart in the 2026-2027 season range.
There will be short-term upward movements as seen in the chart.
Main trend = It is in a downward trend.
Investors who want to take short-term profits can maintain their positions from appropriate entry levels to sales areas.
Then, sales pressure will continue until the end of the year; I think that the new year will bring ASTRONOMICALLY high profits for bitcoin. Personally, I have sales positions and I am thinking of maximizing my profits by buying these positions in buying areas.
I plan to hold my positions until the time I mark as a suitable buying time, and then start buying transactions towards the end of the year.
I wish everyone a new year
(The information contained herein is my personal prediction and analysis; it does not constitute any investment advice.)

BTCUSD IS 101K ARE NEXT STOP???BTCUSD find it self nice SUPPORT, and i can see BULLS want to take this to ABOVE 100k


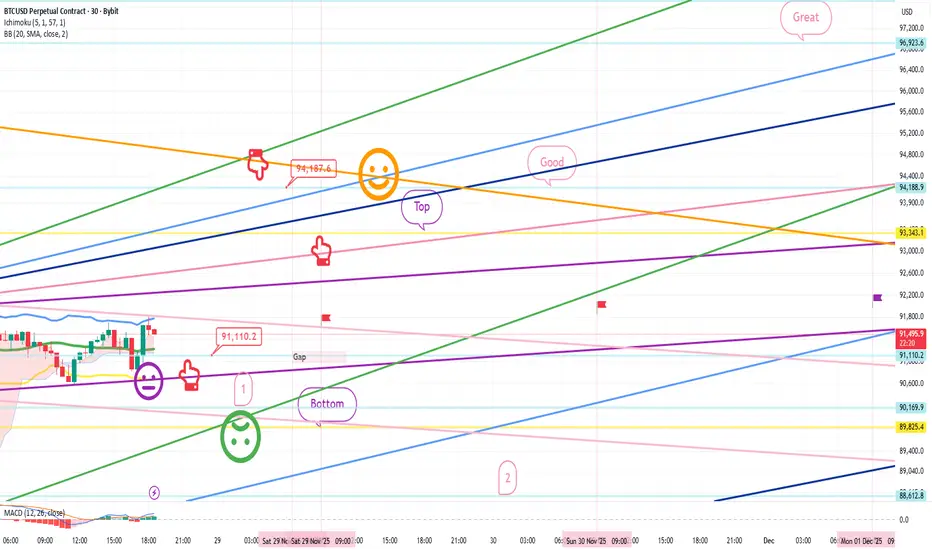
November 28 Bitcoin Bybit chart analysis Hello It's a BitcoinHello
It's a Bitcoin Guide.
If you "follow"
You can receive real-time movement paths and comment notifications on major sections.
If my analysis was helpful,
Please click the booster button at the bottom.
This is the Nasdaq 30-minute chart.
Today is an early closing day due to Thanksgiving.
*Roughly speaking, among the red finger long position strategies,
the rebound after touching the first section is a vertical rise.
25.2K -> Bottom is a safe zone for long positions,
and the lowest point, 25,098.7K, is the 1+4 section.
While today's sideways movement is most likely,
I've also calculated major fluctuations just in case.
I've applied this directly to Bitcoin.
This is Bitcoin's 30-minute chart.
I assumed the Nasdaq would move sideways,
and conducted a 1:1 analysis with Tether Dominance.
It first touched the lower Bollinger Band (the area where the 30-minute and 1-hour support levels touch and shake simultaneously).
The danger signal was the MACD dead cross on the 4-hour chart.
Since the Ichimoku Kinko Hyo has a thick bullish cloud,
I set a short stop-loss, ignored the 4-hour MACD dead cross, and operated aggressively.
*When the red finger moves,
One-way long position strategy.
1. $91,110.2 long position entry point / Stop-loss price if the purple support line is broken.
2. $94,187.6 long position primary target -> Great secondary target.
If the strategy is successful, the top area can be used as a long position re-entry point.
Instead, the Top -> Good section is the center line of the daily Bollinger Band chart, so a strong correction is likely.
Also, the purple flag marked on the far right indicates the area where a new monthly candlestick is formed next month.
A strong rebound this weekend is unavoidable, as the monthly MACD dead cross could be resolved. Even if the Great section is formed at the top, closing down to the gap section formed over the weekend is the best option for long positions.
(Possibility of a December bull market without the risk of a monthly MACD)
The first section + the bottom section at the bottom is the safest area for long positions, with the possibility of a sideways movement.
Up to the second section is open after the bottom section is broken.
This is because the second touch, between the 4-hour Bollinger Band center line and the 6-hour Bollinger Band center line, could lead to a strong push without support.
Up to this point, I ask that you use my analysis for reference only.
I hope you operate safely, with a focus on principled trading and stop-loss orders.
Thank you for your hard work this week.
Thank you.
BTCUSD-4HR SETUP Price has reacted strongly from the demand zone and pushed back above structure, showing a clear shift in momentum. The recent impulsive move has brought us back into a key resistance area, where price is now attempting to form support.
As long as price continues to hold above the two highlighted support levels, the bullish scenario remains valid.
🔍 Outlook:
Looking for a retest of support followed by a continuation to the upside
Break and hold above the mid-range resistance opens the path toward the next major target zone
Setup becomes invalid if price drops back below the lower support level
📈 Summary:
Momentum is turning bullish, and we’re positioned for a potential continuation higher if structure holds. Waiting for confirmation before further entries.

BTC USDHI GUYS,
UPDATE ON BTC
There has been manipulation on the historical detail right from day one on this RT H4, H6,H8 CONTINUATION sell structure. which led to manipulation on the trading detail.
(thur, fri) double top was to sell and clear fair value gap however it ranged due news suggesting growth , this manipulation led to Monday selling to correct area of interest as illustrated.
Today as i track down vast amount of data we are to continue the rally on Wednesday as illustrated .

BTC Macro Rising Wedge: Arithmetic Trend SupportsThis monthly Bitcoin chart is on an arithmetic scale. The red line marks macro resistance connecting the major cycle peaks since 2017, forming the upper boundary of a large rising wedge, while the green line tracks macro support from the 2022 bear‑market low.
Price has recently pulled back from near the resistance and is now reacting around the support, showing that this trend channel is still respected on a closing‑basis. As long as monthly candles hold above the green line, the primary uptrend from the last bear‑market bottom remains intact and the wedge structure continues to guide expectations.
From this perspective, the chart suggests a path where Bitcoin can bounce off macro support and travel once more toward the resistance line before a larger cycle top and subsequent bear market.
This aligns with my main strategy that calls for a new high before the next major downturn.

BTCUSD – Bullish setup 4HBITSTAMP:BTCUSD is showing early signs of a potential bullish reversal after reclaiming the mid-range of the channel and holding above key EMAs. Price is consolidating just under the dynamic resistance band, and repeated higher lows suggest buyers are gradually regaining control.
🔍 Bullish Confluences:
Reclaim of mid-trend band with candles closing above the lower volatility ribbon.
Higher-low structure forming after the recent sweep of liquidity.
Momentum shift indicated by bullish reaction off the 0.382–0.5 retracement zone.
Support confluence at ~86.8k where previous demand and fib structure overlap.
🎯 Fibonacci Targets:
TP1 – 38.2%: 89,242
TP2 – 61.8%: 90,576
TP3 – 100%: 93,500
If price breaks and holds above the current compression zone, continuation toward the fib cluster at 90–91k becomes likely, with the final upside extension pointing toward 93.5k.

Bitcoin bottom is close New ATH Loading The bottom is close now for Bitcoin.
It has dropped 36% from 126k to 80k
Reversal will be much stronger.
New ath targets remains 150k - 190k min.
Max 300K.

BTC/USDThis is not financial advice — just a personal trade idea. Despite the sharp drop toward the 80k zone, I still believe BTC has the potential to reach 200k–250k by the end of 2025. For now, I’m watching the 95k–100k area as a possible seller zone while keeping my overall long-term bullish outlook.
✅ Bullish Case — Why this trade could work
Strong institutional demand & supply-shock dynamic. Demand from spot-Bitcoin ETFs, corporate treasuries and long-term holders continues to absorb more BTC than is mined. Some analysts argue this structural demand could support a surge toward $200 000.
Investing.com South Africa
+2
CoinDesk
+2
Macro/liquidity tailwinds. With global liquidity expanding, looser monetary policy in key economies, and inflation/fiat-currency risks rising, BTC — with its fixed supply — is poised to benefit as a “digital store of value.”
Nicoya Research
+2
The Economic Times
+2
On-chain and market-structure signals. According to a recent analysis, if BTC reclaims and holds above its “realized price” (around $116 000), that could unlock a bullish impulse toward $160 000–$200 000.
CoinDesk
+1
Current drawback opens a favorable entry zone. The drop toward the $80 000–$85 000 zone may have flushed out weak hands. Some analysts view that dip as a high-probability bottom, making current levels attractive for long positions.
Cointelegraph
+1
Trade proposal (bullish):
Enter long or accumulate gradually around $80 000–$95 000 (or any dip within this range).
Target partial take-profits in the $160 000–$200 000 region, full target toward $200 000–$250 000 by end-2025 (or early 2026).
Use a time horizon of ~6–12 months (depending on entry point) — this is a “swing to end-of-cycle” trade, not a quick scalp.

Is Bitcoin Going To 100k? Well now that volatility is back to normal and all bulls are scared and after bein g liquidated twice in a row is TIME for bear to dance to the bulls rhythm at least to the $98k once the weekly closes.
If we have a bullish 4hrs chart with higher high and higher low that will mark the start of the Daily Bullish Cycle with a target of $97k.
Buckle up ladies and gentlemen you've been invited to the bulls party.

#Bitcion Bull Run Unstoppable Momentum (READ CAPTION) hi traders! Today is 29 November 2025 and here is my analysis chart please read and send me your ideas for more analysis.
based on the current market analysis, $Bitcoins price is around $90900 with a 1.01% decrease in the last 24 hours
Target 1 ($91900) this is first resistance level, price may face rejection here. If market continually work in bullish trend, If market dont give rejection then it is hit our supply zone.And market easily going upside and possible it shows more powerful bullish trend.
Some analysis expect bitcoin to reach $100,500/ $105,800 or even $116,200 in the near future while others predict a potential pullback toward $70300 or $58700 if key Support Levels or broken.
bullish Targets:
target1) : ($91900)
Supply zons: ($93000)
Resistance zone: ($94500/ $95000)
Support Area: ($89800/ $89300)
Please dont forget like & comment for more latest updates
This Analysis is for informational purposes only. Trade is own your risk

BTCUSD Next Move Analysis Read the CaptionBTC is moving sideways inside a range/rectangle (highlighted purple).
Price is sitting near the top boundary of the range.
There is a rising wedge / compression toward the right side.
The chart also shows a target level above, suggesting someone expects a breakout upward — but range tops often reject before that happens.
This is exactly where short setups can appear.
BTC fails to break above the purple box and forms a rejection candle (pin-bar, bearish engulfing etc.):
Entry: Near range resistance
Stop-loss: Slightly above the top of the range
Take profit: Mid-range or bottom of the range
This works because the range has been respected several times

BTCUSD : Short-Term Bearish Correction OutlookBitcoin is forming a potential corrective sequence on the 4-hour timeframe after completing its recent impulsive recovery phase. Current price behaviour reflects an early shift in momentum, suggesting the market may be preparing for a deeper pullback before reassessing the next directional leg as December progresses.
Disclosure: We are part of Trade Nation's Influencer program and receive a monthly fee for using their TradingView charts in our analysis.

BTCUSD STILL BULLISHBitcoin has been consolidating and it flirted with our stoploss but alas, it keeps on going up.
