[SeoVereign] BITCOIN BEARISH Outlook – October 05, 2025Hello everyone.
I hope you are all having a peaceful day.
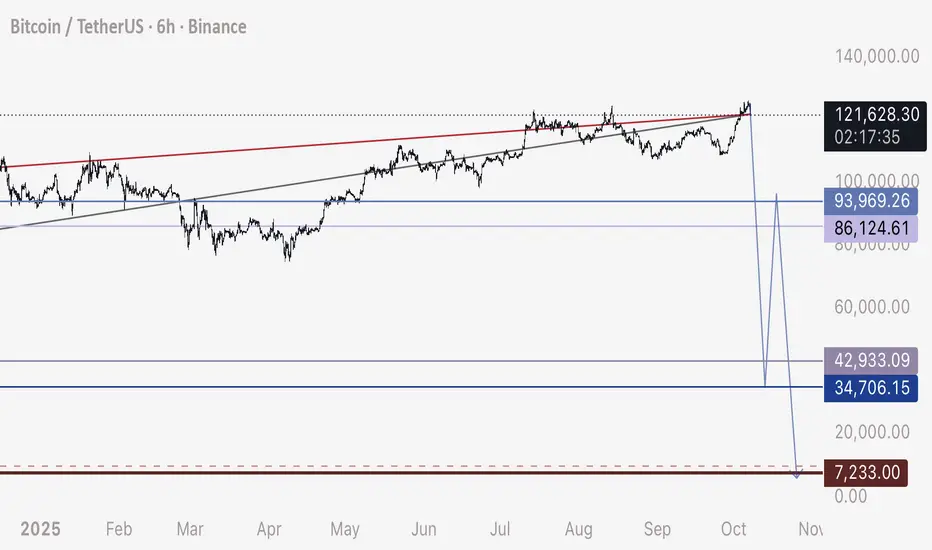
Today, I am writing to share my Bitcoin short position view as of October 5th.
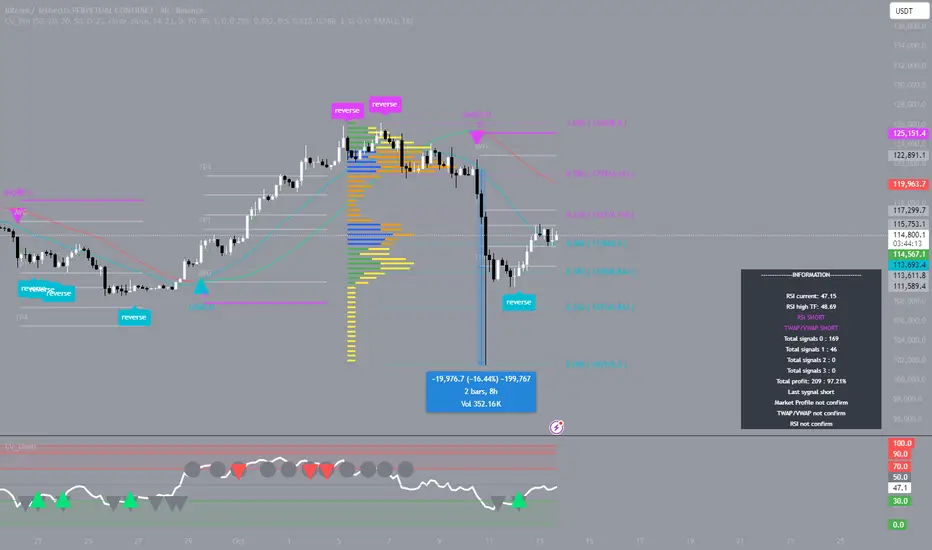
The first basis is the 1.902 CRAB pattern. In a traditional Crab pattern, the 1.618 extension of the XA leg is regarded as the main PRZ (Potential Reversal Zone), but in practice, it is often observed that additional extension values such as 1.902XA are formed. This zone is an area where the price, after an excessive extension, tends to reverse sharply, and it is one of the regions within harmonic patterns where strong volatility and reversal signals frequently appear. Currently, Bitcoin is encountering resistance around this 1.902XA level, which increases the probability of a short-term bearish reversal.
The second basis is that wave N and wave M are forming a 1:1 length ratio. In other words, both waves are proceeding with equal length, which resembles the AB=CD structure—a fundamental form of harmonic patterns. Such wave symmetry indicates that the market is moving in a consistent rhythm, and when two waves complete with the same length, that point often acts as a reversal signal.
Accordingly, the average target price is set around 119,168 USDT.
As the chart continues to develop, I will provide updates to this idea to inform you about my position management.
Thank you for reading.
BTCUSDT.3L trade ideas

Bitcoin BTC Bullish Setup📈 CRYPTO:BTCUSD reached the equal legs area $118588 - $117260 and it's expected to rally from there looking for new highs next week or bounce in 3 waves at least.
#Elliottwave #Trading

BTC market snapshot$17 billion in long positions were liquidated on BTC within 24 hours. Altcoins have crashed up to 70%, but Bitcoin is holding strong. We’re currently testing support, with a wedge pattern (a reversal formation) and a monthly MACD divergence starting to play out.
If price consolidates below $108K, the next level is in the $78K–80K zone.
In a bearish scenario, the next zone is around $60K.
A close below $105K would significantly increase the probability of a trend reversal.
I’m not taking any long positions.

BTC Lower highs - nose diving soonWe've seen this movie too many times. Lower highs, then crossing 50SMA / 200SMA down. We are an inch away from this happening. Never get sensitive about any of this! Follow the trend, technicals, and understand the f&ckery that is taking place. Every single time it drops, esp. when many of the people in crypto are just profit takers. Again, diminishing YoY returns, doesn't solve any real problems, high transaction cost, and still can't buy a banana with it. CBOE:MSTZ CBOE:UVIX are nice hedges and prob the only thing going up in a down market.
Best of luck and always do your DD!

BTC Recovery Attempt — Key Level 111,140After last week’s crash, the price is now attempting to recover. The key level for this week is 111,140 .
If 109,570 breaks, there’s a high probability of the downtrend continuing — with the first target at 100K and the second at 90K . As long as the price remains above 111K , we’re in an upward correction phase and could see growth toward 118,500 .
Only a breakout above resistance and the 122,570 level would open the way to a new ATH.

Recovering…Considering the counting of waves and examining the micro-waves in the fractal system, we conclude that the price will retrace itself to the green box.
This is just my personal opinion, please do not use it as a criterion for your trading.

BTC: bullish impulseOn September 29, Bitcoin initiated a confident upward move from $113,705.5 on the 4-hour chart. The price traversed all four partial-take stages and reached $122,358.9 — nearly $8,600 per coin. Trading with 10x leverage made the move notably dynamic.
I followed my proprietary strategy. When the structure is clear, the market becomes much calmer. From here, there is a nontrivial probability of a pullback; it makes sense to prepare for a potential bearish signal.
Net effect: the upside potential was substantial — and those who acted systematically could capture the bulk of the move. Moments like these highlight the importance of analytics and discipline. In markets, winners aren’t guessers; they are traders who execute a plan.

The market move was no surpriseIf you know how markets work, you'll see that this market move was no surprise.
Just knowing what correct market structure looks like and how to place a Gann Tool could help your trading tremendously

BTC - DAILY UPDATE#BITCOIN - Daily update 🟠 (Oct 8, 2025)
Spotted a clean bear div yesterday → pullback into 121k–120k; 118.5k possible.
Daily/weekly still constructive; no clear reversal. 📈
H1: neutral, triangle in play.
🎯Levels
Resistances:
122,800 • 123,300 • 125,000 • 125,900 💥
Supports:
121,000–120,000 • 118,500 • 115,800 🛡
Scenarios:
🟩 H1 break and close above 122,800 → room toward prior ATH.
🟨 Triangle break down or rejection near 123,000 → retest ~119,000 - 199,500 before any attempt higher.
#Alts market : will likely stay green while holds above ~115,500.

#BTC/USDT bounce from Support, Bullish Momentum Intact#BTC
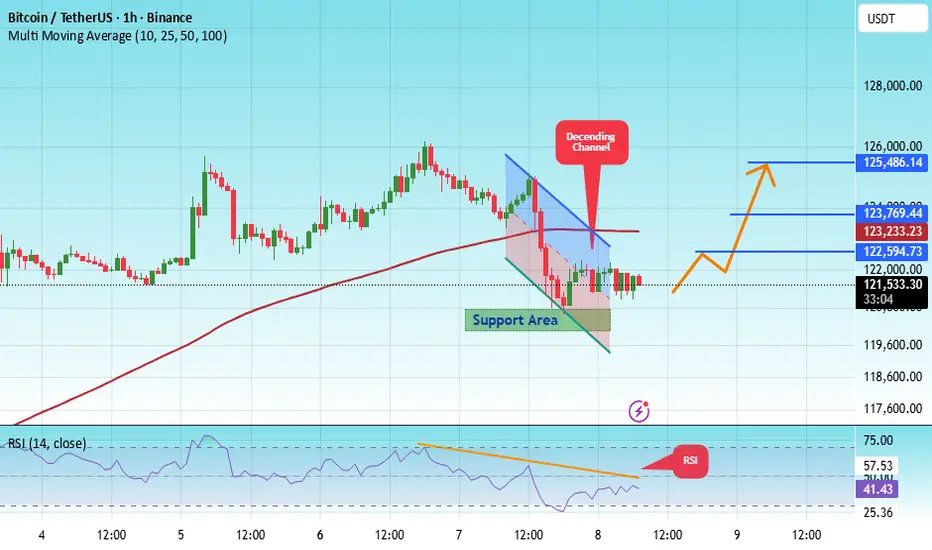
The price is moving within a descending channel on the 1-hour frame, adhering well to it, and is heading for a strong breakout and retest.
We have a bearish trend on the RSI indicator that is about to be broken and retested, which supports the upward breakout.
There is a major support area in green at 120,500, which represents a strong support point.
We are heading for consolidation above the 100 moving average.
Entry price: 121,666.
First target: 122,600.
Second target: 123,770.
Third target: 125,480.
Don't forget a simple matter: capital management.
When you reach the first target, save some money and then change your stop-loss order to an entry order.
For inquiries, please leave a comment.
Thank you.
Bitcoin (BTC/USD) - Bullish Breakout Alert : Targeting $130k ?🚀 Bitcoin (BTC/USD) - Bullish Breakout Alert: Targeting $130K+ in October 2025! 🚀
Hello Traders! In today's chart, I’ve analyzed Bitcoin’s recent movements. As of October 8, 2025, BTC is trading above $123,500, showing an 8.6% surge last week. Following September’s 5.35% gain, the market is in a bullish mood, aligning with the historical "Pumptober" trend.
What to Watch on the Chart:
Double Bottom Pattern: Two troughs formed near $113,000, signaling a bullish reversal. The neckline resistance at $117,300 has been broken, with the next target at $122,000-$125,000.
Symmetrical Triangle Breakout: A breakout from a two-month descending channel has occurred, indicating a sharp upside move, potentially up to $138,000.
Moving Averages: Both the 50-day MA ($118K) and 200-day MA ($115K) are rising, providing strong support. RSI at 65 is in the bullish zone but not overbought.
Volume Trend: ETF inflows ($175M+ last month) and increasing institutional buying volume suggest sustainability, potentially pushing BTC to $130K-$135K.
Prediction: If $124K holds, the target by the end of October is $131,500 (6-8% upside). Worst case, support at $118K-$120K may be tested. Long-term: $150K+ is possible in 2025 due to ETF and halving effects.
Risk: A US government shutdown or macro volatility could lead to a 5-10% dip. Always DYOR and use stop-loss!
Share your thoughts in the comments – bullish or cautious? Like & share if helpful! 📈 #Bitcoin #BTC #CryptoAnalysis #TradingView

BTC 4 days up...4 hours downBTC volatility is off the rails. Took a bit of nudging to get up to these levels, and few short hours to be at the same spot! Take a closer look at the technicals, seems the drop was very purposeful and aggressive. IMHO there's a lot more TO GIVE here. Meaning, do not be surprised if this crosses 120k, then 110k and even 100k. Everything is super inflated and profit takers will shred BTC to pieces. Ultra signals helped here....
Best of luck

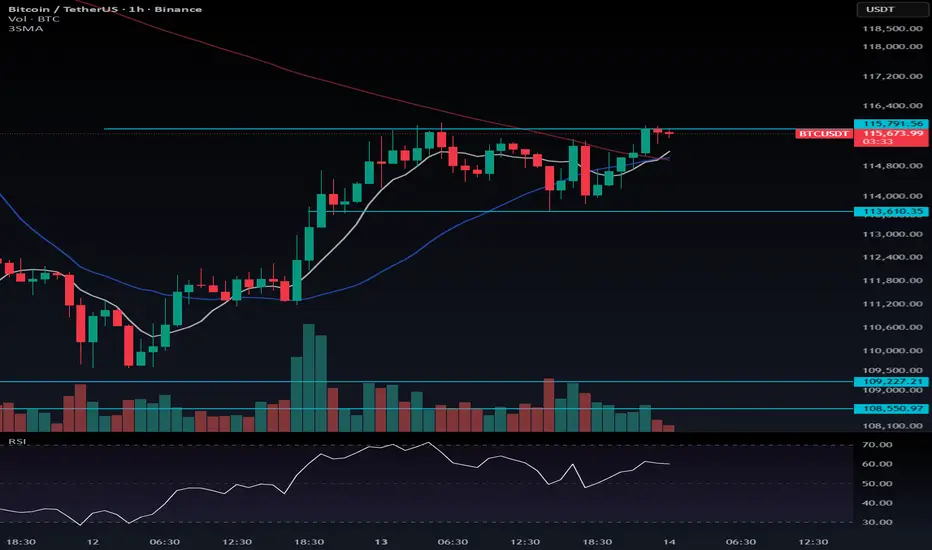
Bitcoin Looks Ready for a Bullish Move — Sellers Losing MomentumIt seems Bitcoin has rested enough and might be gearing up for an upward move. Despite multiple attempts from sellers to push the price lower, they failed to gain control, which increases the probability of a bullish breakout.
In the recent candles, we can clearly see that red candles are getting smaller, and volume is also decreasing — a strong indication that selling pressure is fading. This adds further confirmation for a potential upward continuation.
Long trigger: $115,792
Short trigger (in case of a fake breakout): $113,610
Keep a close eye on Bitcoin Dominance (BTC.D). If dominance turns red while Bitcoin moves up, it’s a signal that altcoins could offer stronger long opportunities during this move.
💡 If you open a long position, I suggest holding it rather than taking early profits — there’s a chance we might see a strong bullish reaction soon.
BTC: reversal pointOn October 10, the Bitcoin market entered its most turbulent phase in months — price plunged from $118,994.5 to $101,505.3, and total liquidations exceeded $20 billion. I didn’t take a position, just watched, because even before the drop the structure looked suspect: the impulse was overheated and the indicator clearly highlighted a risk zone.
It was a tough day for many traders. The wave of liquidations wiped out accounts even for seasoned participants — a reminder of how crucial it is to stay human and keep your composure.
What happened underscored once again: strength isn’t in trying to predict the market, but in reading its signals and recognizing structure ahead of time. Analytics and discipline are the only things that help you weather such storms without panic. My proprietary strategy reaffirmed that, and I’m grateful for it.
Wishing everyone successful trading.
GREAT FALL BTC.
we all know what happend and this great liquidity grabbing happend but WHAT NOW ??
i think this was just a begining of correction and started with good manipulation from whales i can't name them pls dont ask.
but as i checked they are controlling market and still selling btc in high prices to buy it again from 75K
"it's just good business"

Wait for the correction on BitcoinHi traders,
This time my outlook on Bitcoin last week was great. After it made a new ATH, price went down impulsive (= bearish), made a small correction up and dropped to the previous swing lows. Last week I already said that the move up came out of nowhere.
Now it could go up again. But let's wait for the correction up (bearish) or down (bullish) to take a trade.
Let's see what the market does and react.
Trade idea: Let price make a correction to take a trade bullish or bearish.
If you want to learn more about trading FVG's with wave analysis, please make sure to follow me.
This shared post is only my point of view on what could be the next move in this pair based on my analysis.
Don't be emotional, just trade your plan!
Eduwave

BTCUSDT Potential Bullish opportunityAt this point, BTC jumped from a Key level FVG untested in months. TO me, its seems an AMD move into the key level. Lets see if it jumps

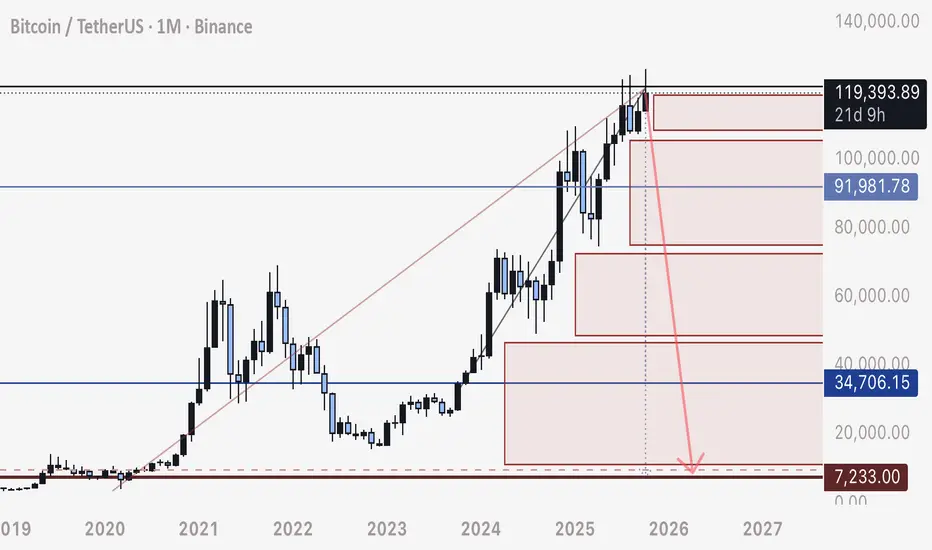
Why BTC will drop at EXTREME SPEED to 8,000This is a Segway off of all my recent posts, and here we will apply the same understanding of stop loss and liquidation order blocks to the 1 Month.
Bitcoin has been moving in a straight upwards consolidation with no actual retrace since Dec 2022.
What this does, is attract mass amount of stop loss orders, intact and left in place, through the whole movement.
These stop loss orders will create a natural cascading drop as they all fill, exponentially moving more and more liquidity out of BTC and into USD/ USDT.
Bitcoin will drop, at exceptional speed, and the chart tells us the whole story.
Be safe.
- DD
$BTCUSDT Analysis - Oct 10 | 4H Time FrameBINANCE:BTCUSD Analysis - 4H
Hello and welcome to another analysis from the Satoshi Frame team!
I’m Abolfazl, and today we’re going to analyze Bitcoin on the 4-hour timeframe.
Bitcoin’s current all time high stands at $126,199!
Price has tapped into a demand zone, which could potentially trigger a bullish move toward this high.
This zone is worth the risk, and it’s recommended to look for buy positions on the 15-minute timeframe, targeting $130,000.
See you in the next analyses!
Stay tuned with the Satoshi Frame team...

BtcUsd - Decision Point SetupBTCUSDT is currently hovering around a key Decision Point, following a structure shift marked by a clear Change of Character (CHoCH) on the 1H timeframe. After the recent bullish correction during the Tokyo session, price is retesting the previous supply zone, which will decide the next directional move.
If price rejects from the Decision Point, we can expect a bearish continuation targeting the lower liquidity area around the Target Zone. However, a strong breakout and sustained momentum above this level could signal bullish intent, shifting market structure upward.
This area serves as a crucial confirmation zone for either continuation to the downside or reversal toward higher highs.

Bitcoin Crash Incoming - Watch for this 3 wave Move Here is a close up look at expected corrective path.
This move will be extraordinary fast, the fastest and largest drop we’ve seen in cryptos history.
Please see my linked related posts from today for a detailed overview of this theory, explanation, and helpful insights.
God speed and love to all.
- DD
It's Not the End, BTC Bull Channel Points to 160k!After the biggest manipulation of crypto in history, we have a strong trend line since 50k in a bull channel. Based on a clean retracement to 107k-108k , it can go up to 160k for a reliable target.
Strong trend line support originating from the 50k base
A well-defined parallel resistance channel
Recent clean retracement to the 107k-108k zone, which aligns with the 0.5 Fibonacci retracement level
RSI showing healthy consolidation without being oversold
Trade Setup:
The current retracement to 107k-108k presents a high-probability entry zone for continuation of the bullish structure. If this support holds and price respects the channel dynamics, the next major target sits at 160k, representing the upper boundary projection.
Key Levels:
Support: 107k-108k (current retracement zone)
Invalidation: Break below 100k
Target: 160k (channel resistance)
What do you think? Drop your thoughts in the comments below - do you see this playing out, or do you have a different perspective on BTC's next move?

BTC Bearish DivergenceBitcoin Showing Major Cracks — Divergences Are Screaming
My Weekly Polynomial Average (113,700) has just been broken — a key structural shift.
Next leg down towards the major Fibonacci extension (1.618) points toward a $76,900 target.
Bitcoin’s bearish divergence has been running far too long — and history shows this kind of setup never ends quietly.
RSI divergence: nearly 19 months
MACD divergence: close to 10 months
That’s a massive disconnect between price momentum and underlying strength. The market’s been grinding higher on fumes while the internals have been rolling over for more than a year.
We’ve seen this before. In 2007, the S&P 500 ran an extended divergence for almost a year — price kept pushing higher while internals weakened. The result? The global financial crisis that followed soon after.
Now, Bitcoin looks eerily similar — cracks forming beneath the surface while sentiment remains euphoric. When these long divergences finally resolve, the unwind tends to be fast and ugly.
Caution here isn’t bearishness — it’s survival instinct.
