$btc longbtc currently sitting on 66k support after failure to break ATH , this is a good dip to buy bitcoin and alts as most have taken upto 20% damage
BTCUSDT.3L trade ideas

BTC trapping volume For the last 3 weeks btc couldnt make a new hi and it was consolidating between 72k & 66k trapping volume in a range
Last WEEK was the openning range of the new MONTH of june and now btc broke the low of the openning range showing a bearish behavior
If we pull a fib tool from hi of previous MONTH to the low we will see that 64k-63k is the 50% of the range if btc dosent respect this area then its going to hunt those who long from 56k

Technical Analysis June 11thIf we break the 67k mark in the following hours BTC might drop to the 61k-60k zone. From there, maybe bounce back up? Or maybe even a more bearish scenerio? It seems that we will not touch the ATH in a while since summer is also not a good time for BTC

BTC mid-term analysis
BTC has staged an impressive rally, surging by approximately 80% since the validation of the ETF. There have been few notable obstacles along the way.
Currently, BTC prices are confronting a significant juncture, encountering monthly resistance. Historically, BTC has been rejected at this level twice before, once in May 2021 and again in November 2021. The question now arises: will history repeat itself?
There are two possible scenarios to consider:
Scenario A: BTC may undergo a period of consolidation in the coming weeks, potentially leading to a significant correction.
Scenario B: Alternatively, BTC could breach the monthly resistance and soar to levels as high as 90K-100K before experiencing a correction.
Should scenario A materialize, I anticipate a final pump in altcoin prices before they too face correction alongside BTC. However, if scenario B happens, BTC would likely sustain its bullish momentum, leading to an increase in BTC dominance (refer to the attached screenshot).
For now, I'll focus on these two scenarios before attempting to predict what lies beyond.
Which scenario do you prefer or anticipate?

Monitoring a New Hash Ribbons SignalNine months ago, we observed a remarkable signal that led to a 14% decline followed by a 190% increase. Today, we have another signal pending confirmation.
The Hash Ribbons is a technical indicator developed specifically for Bitcoin by Charles Edwards. It uses the network's hash rate and its moving average to generate potential buy signals. This indicator is widely regarded as a representation of the fundamental health of the Bitcoin network and has been adopted by many traders and investors to identify potential buying opportunities.
How Does the Hash Ribbons Work?
The Hash Ribbons combine two moving averages of Bitcoin's network hash rate: a short-term moving average and a long-term moving average. When the short-term average crosses above the long-term average, a buy signal is generated. This signal is often represented by a blue arrow or dot on the chart.
Historical Analysis of the Blue Signal:
Examining historical data, there is a compelling trend associated with this particular signal.
- On the Weekly Chart : The blue signal appeared on August 7, 2023. Historically, out of the last 14 occurrences of this signal on a weekly chart, Bitcoin's price increased 13 times.
- On the Daily Chart : The blue signal was observed on August 12, 2023. Overall, this signal has shown up 19 times on the daily chart. Intriguingly, out of these 19 occurrences, Bitcoin's price decreased only once following the signal's emergence.
Conclusion:
If historical trends are any indication, the Hash Ribbons signal offers a high probability of bullish movement for Bitcoin. Of course, as with any technical indicator, it is crucial to use the Hash Ribbons in conjunction with other tools and analyses to make informed decisions.
It is also essential to remember that past performance is not indicative of future results. However, the historical data associated with the Hash Ribbons clearly shows it is an indicator worth closely monitoring for potential Bitcoin buying opportunities.
I will continue to keep a close watch on this indicator, which has proven to be highly profitable in the past.

“#BITCOIN Conundrum: Decoding Bitcoin’s Next move”What is the secret of #Bitcoin's next movement?
#Bitcoin's decline is unlikely to continue unless the 65,357 support is broken on the daily time frame.
Until then, let's focus on growth
Keep an eye on these 2 things for growth:
First, it will grow from this range (66300-67970) and break the downward trend in the 4-hour time frame.
Second, it will fall to the key support of 65,357, and it will probably stop falling and grow there
Targets:
Target 1: 71890
Target 2: 74160
Do you also think that this drop in #Bitcoin is temporary?

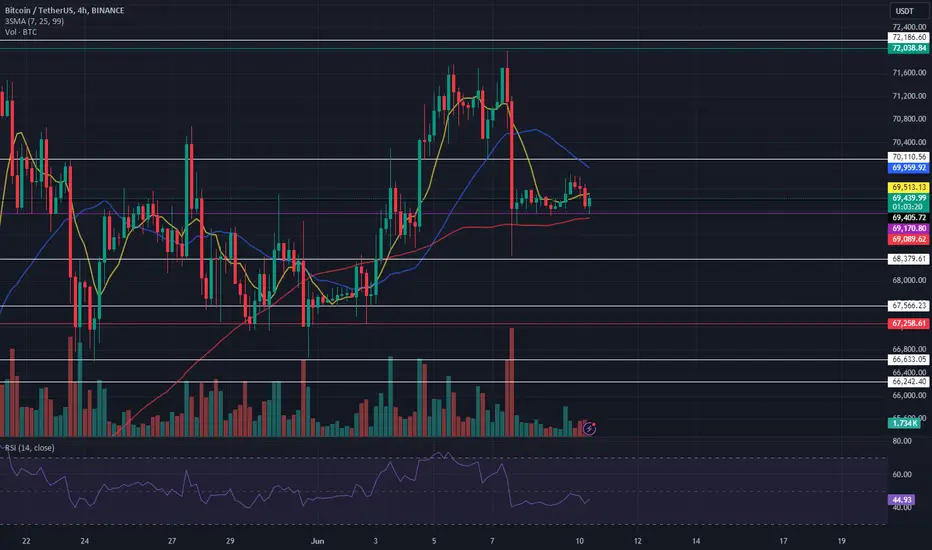
Why is Bitcoin crashing below $68,000?Bitcoin’s price has been having difficulty approaching its all-time high of $75K and is still consolidating.
On Friday, the cryptocurrency tanked below $70K, and if the current level supporting the price breaks down, an even deeper correction could be expected.
Looking at the 4-hour chart, things seem tricky for Bitcoin. An ascending channel is currently being formed around the $70K mark. The price has already tested the pattern’s higher trendline and the $72K resistance level twice. It was rejected decisively and is testing the SWB:69K support level once again.
A breakdown of this level could cause even more trouble. If the pattern is broken to the downside, a deeper drop toward the $60K would likely materialize in the short term.
With the RSI also below 50%, the bearish scenario seems probable.
WHITEBIT:BTCUSDT

BTCUSDT :You have to be careful in crypto
Exactly when the traders leave the market, the market movement always starts
It means that the market has messed us up
Bitcoin's dominance hasn't moved much, Bitcoin itself hasn't moved yet, it's only moved 2%
It is difficult to open a position today because the trigger is known and the stop is not known
Be behind the chart until US time, it starts at 4:30 our time
It is clear that we are starting a new trend, but since the volume is small, it may take some volume, but we have to wait today, I think
Important support 67181, open shorts under this position, we are also oversold, the trigger is clear, but we don't have a stop, that's why I said it's difficult, involve less risk, if you want to put a small stop, it's ok, because we are at the end of the movement, we will enter

Bitcoin LiquidationBitcoin Liquidation
there is Short & Long Liquidation price on binance
I look about the liquidity prices there is a huge liquidity
Long Liquidation red line's
66900
64150
Short Liquidation long line's
72350
70500

Correction wave in front of BitcoinBitcoin has been correcting for the past few days, and if the price action continues to complete them, these formations may come into play, so I recommend taking profits in the 50,000-52,000 range.
And then we will have a term up to 38000 and then the next wave will touch 68000.
These analyzes are speculative at this point, but I just wanted to point out the possible potential of each of them if the current trend continues.
Good luck and always use stop loss.


BTCUSDT UPDATE#BTCUSDT
Hey dear traders hope you are enjoying trading and analysis with our team. we are here to discuss about BTCUSDT
BTC Is making rising wedge pattern in H4 timeframe. Already breakout done. If BTC drop here we can see over all all market drop here.

$BTC local scenario 📈 CRYPTOCAP:BTC Update
Key Levels:
Bullish: $70,120
Bearish: $65,000
I will definitely reduce my altcoin positions if I see some candles close under $65k.

the og William Dalbert GANN levels are bear on BTC I geus he is right. i like looking at the secret gann levels that i have drawn on the chart as a trendline. #btc #short #crypto #gann

BTCUSD - Has The Hype For $100,000 $BTC Disappeared?I believe we are about to see a movement many are just not expecting; whether that's to the upside or downside.... that's anyone's guess but if I was to put 50% of my chips on one side, I'd go for red.

#BTC rebounds as Scheduled, what next?📊#BTC rebounds as Scheduled, what next?❓
🧠Structurally, there is a bullish cup-and-handle structure acting as support for the upside, so there is a case to continue the bullish trend.
⚠️But from the perspective of the weekly level, we cannot be too optimistic before we break through ATH. If we do not continue the bull trend but choose to continue falling, we need to be wary of the weekly level entering a complex consolidation stage again.
⚙️Therefore, we don't have to guess how the market will develop. What we can do is to lock in the main profits of the long orders we hold and then look forward to more, and look forward to the continuation of the long trend in a low-risk or risk-free way.
🎉Congratulations to all the friends who followed Wolf King to print money.💰🍻
⚠️Don’t forget risk management⚠️
✔️Trade Security✔️
🤜If you like my analysis, please like 💖 and share 💬
BINANCE:BTCUSDT.P

Bitcoin (BTC) market overview | 10.06BTC’s daily chart portrays a significant rise from $60,176 on May 10 to the $71,958 high, followed by a correction and sideways movement. This pattern suggests a phase of price discovery and consolidation. Volume spikes accompany major price moves, with decreased volume during consolidation. Key support and resistance levels are $60,176 and $71,958, respectively.
Oscillators provide a mixed picture, with the relative strength index (RSI) indicating neutral conditions. The commodity channel index (CCI) at 39 and the average directional index (ADX) at 24 also suggest neutrality. However, the momentum indicator at 1941 signals bullish sentiment, while the moving average convergence divergence (MACD) level at 1007 indicates bearish sentiment.
Moving averages (MAs) show varied signals, but longer-term EMAs generally suggest reinforced bullish sentiment for the long-term outlook.
Given the mixed but generally positive signals from the longer-term moving averages and the momentum indicator, the overall outlook appears bullish. If bitcoin can break through the key resistance levels with strong volume, it could see significant upward movement.
WHITEBIT:BTCUSDT


BTC Price Prediction and Elliott Wave AnalysisHello friends,
Thank you for joining me in my analysis. Remember to like, subscribe, and stay tuned for more updates. See you soon!
Thanks, Bros

BTCUSDT :The big and small wave of the market is a pair of pain, so it can be said that we are not affected by the big waves of the market
As long as there are big waves of suffering, you have to adapt to the market as soon as possible because the trend may change at any moment, always when the market suffers like this for a long time, any behavior is possible.
If Bitcoin Dominance turns green, then Bitcoin breaks the bottom, you have to find a trigger in advance, because you can see that the document will drop by 30%, if Bitcoin drops by 12%, altcoins that are down to Bitcoin will definitely drop more.
dead market
If we were supposed to have a Sharpie move, it would have moved yesterday
The market may start moving in five hours
If Bitcoin reaches the support of 67252, Bitcoin's Dominance will also turn green, altcoins will trend and go under their support, but we don't expect any special movement from Bitcoin itself.
The market volume is decreasing every day
Open a trade for a short position below 69169, but in fifteen minutes
69179 Support is important
BTC THE LAST CHOP BEFORE THE POPBTC zoomed out I , would if it was a new chart I had never seen , I would say: this is the last chop before the pop.
BTC had distribution happen in March -April , then we set M HLs and this now is the sideways action inside 3D or W bullflag.
the last 3 days as I noted in my posts before the drop and since the flush was likely a shake out !
I am trying to hold on to my BTC and ETH and some ALTS through this action, but if they do attempt an even harder shake o I will have to go flat and reattempt entries, if my theory confirms as I will be travelling the coming 2 weeks.

Market overviewBitcoin (BTC): $69,350.37 (-0.01%)
Bitcoin Dominance: 55.49%
Fear and greed Index: 72 (greed)
WHAT HAPPENED?
Last week turned out to be a busy one for bitcoin: we immediately started to grow and by Tuesday we had reached our main goal — the $71,000-$71,400 volume anomaly zone. After the formation of a local trade in this zone, bitcoin broke through the lower limit and lost about 5% of its value in a day.
We observed a stop in the price movement in the zone of pushing volumes of $70,000-$69,000, which was noted in the daily analysis on TradingView. We continue to trade in the range of these prices.
WHAT WILL HAPPEN: OR NOT?
Now it's necessary to obtain the positioning of a large volume formed when the price stops. Main expectations: resumption of buys to a new sell zone of $70,800-$71,400, a test of the sell zone and, if there are strong buys in the future, an ATH test.
Buy zones: $68,200-$67,200 (accumulated volume), $64,500-$62,700 (pushing volumes), $61,200-$60,400 (volume zone), $58,500-$57,000 (volume anomalies).
Sell area: $70,800-$71,400 (accumulated volume).
IMPORTANT DATES
The main macroeconomic events begin on Wednesday:
• Wednesday, June 12, 9:00 (GMT+3) — UK GDP report for April, publication of the German consumer price index for May;
• Wednesday, June 12, 15:30 (GMT+3) — publication of US consumer price indices
• Wednesday, June 12, 21:00 (GMT+3) — the Fed's interest rate decision, as well as the FOMC statement;
• Wednesday, June 12, 21:30 (GMT+3) — FOMC press conference;
• Thursday, June 13, 15:30 (GMT+3) - report on the number of initial applications for unemployment benefits and the US producer price index;
• Friday, June 14, 18:00 (GMT+3) — The US Federal Reserve's monetary policy report.
*This post is not financial recommendation. Make decisions based on your own experience.
