BTC/USDT Analysis. Moving Within the Scenario
Hello everyone! This is the trader-analyst from CryptoRobotics, and here’s your daily analysis.
Yesterday, Bitcoin followed the primary scenario, entering a correction almost immediately after the post was published. Just $200 short of the $120,400–$119,400 (absorption of selling) zone, we saw clear signs of buy-side defense and noticeable absorption of selling pressure on delta.
At the moment, the shorts remain the priority until the buyer’s zone is tested. If strong protection appears at that level, the initial upside potential is around $124,000.
Buy zones:
• $120,400–$119,400 (selling absorption)
• $116,700–$115,000 (pushing volumes, strong graphical imbalance)
• $112,500–$111,500 (mirror zone, volume anomalies)
• $110,000–$108,800 (strong selling absorption)
This publication does not constitute financial advice.
BTCUSDT.3L trade ideas

BTC 1D Analysis - Key Triggers Ahead | Day 54☃️ Welcome to the cryptos winter , I hope you’ve started your day well.
⏰ We’re analyzing BTC on the 1-Day timeframe .
👀 After the start of the trade war between the United States and China, news was released about a 100% tariff imposed by the United States on China. The crypto market experienced an unbelievable heavy drop (flash crash) last night, which from a technical point of view was completely unexpected and caused the biggest financial loss in the history of crypto.
👍 On the Bitcoin chart and in the daily timeframe, we can see that it is inside a very strong ascending channel, which even with last night’s drop has not closed below its channel body. Currently, Bitcoin is ranging with support at the bottom of the channel, and since it’s the weekend, the market volume has decreased sharply, and we are in a state of uncertainty until the new week’s open.
💡 Note that Bitcoin has not yet entered a trend reversal for the start of its heavy drop. The reversal zone that I specified in the analysis is between $108,960 and $107,521. With a break and confirmation below this zone, Bitcoin can experience a deeper correction and end its long-term primary trend and enter a secondary trend. We can also consider this zone as a distribution area.
Also note that Bitcoin’s return inside the channel has been supported by strong buyers, which has caused this uncertainty. In summary, Bitcoin has a very important resistance in the $114,351 zone, and with a break and confirmation above this area, it can move upward and turn the flash crash into a continuation move. In the continuation of the analysis, we will also use indicators and volume to reach the best conclusion.
🧮 In the RSI oscillator, we can see that after the selling pressure and increase in volatility, it moved downward and easily crossed the 50 zone. We have now defined two key RSI zones:
Zone 50 can be our long trigger area.
Zone 37, where if volatility passes below this level, Bitcoin can move toward the oversold area in its daily timeframe and experience a deeper correction.
🕯 First, let’s talk about volume — the selling pressure was so strong that it pushed the Bitcoin price near $102,000, and then it faced support from buyer makers (those who buy with market-type orders), which brought the price back above $110,000. The size of Bitcoin’s recent candle has been very strong and large, showing the great power of the sellers. With the increase in selling volume and continuation of the tariff war, the market can enter a risk-off state in higher timeframes, and investors may sell their Bitcoins, putting more selling pressure on BTC.
🧠 With the intensification of the tariff war between the U.S. and China, Bitcoin may start its secondary trend after weeks and months of bullish movement, but we still can’t make a definite decision about this issue. So we are waiting for the break of the defined zones in the analysis to make the best decision. Last night’s event was truly painful — a big experience and lesson for all of us that if we can manage our capital, we can have the best results relative to the market. However, last night will be remembered as the biggest financial loss in crypto history.
❤️ Disclaimer : This analysis is purely based on my personal opinion and I only trade if the stated triggers are activated .

BTC bullish shark harmonicAfter yesterdays $20 billion worth of liquidations it was time to zoom out a little.
Here I'm posting this bullish shark harmonic, yes, it doesn't look bullish considering what we witnessed yesterday and for me there was a lot of manipulation involved, directly after the CME closed we saw a massive liquidation event that not even your SL could save.
President Trump posted something on Truth Social about China holding countries to ransom for their rare earth minerals, now, we all know that Trump won't take that lying down and will obviously set tarrifs against China (at time of posting, this hasn't happened yet) once it does then we could see a further drop.
This shark harmonic is showing the way and a possible drop into the CME gap between $97k-$96k, at time of posting btc is currently at $111,770 which if given there's still a possible $15k drop to come, yesterdays liquidations saw btc dump around the same levels.....
This is only my thoughts and not financial advice
Stay safe......

Bitcoin Holds Channel Midpoint as Bulls Target $133,000Bitcoin continues to trade within its high-timeframe range, defending the channel midpoint as price aims for $133,000 resistance. Consolidation here could precede the next major move higher.
Bitcoin’s structure remains intact within a long-standing ascending channel. The market is currently approaching local resistance from the smaller range, while maintaining price above the midpoint of the broader channel.
Key Technical Points:
- Price trading above the channel midpoint supports bullish continuation.
- Local resistance approaching near-term range highs.
- Next major target: $133,000 high-timeframe resistance.
Each swing within Bitcoin’s channel has defined clear pivots at both the highs and lows. The current setup shows price consolidating above the midpoint — a sign of sustained strength.
Short-term corrections within this area remain possible, but as long as Bitcoin holds above the midpoint, the probability favors continuation toward $133,000.
What to Expect in the Coming Price Action:
Bitcoin remains bullish above $119,000–$120,000. A reclaim of $123,000 resistance could accelerate momentum toward $133,000, marking the next test of channel highs.

BTCUSD
🔎 Market context:
• Price swept the liquidity below support (~122,700) with long wicks.
• Instead of continuing lower, it quickly reclaimed the range → classic liquidity grab + absorption.
• This often signals a bullish reversa

BTC; Aiming For A New (ATH) At $140k ?Bitcoin is set to break this resistance level and scale toward $140k before the year end. it have been moving within this momentum region of $109k-$123k for this couple of weeks, which we experienced a new ATH at $126k this week.
However according this structure our SMA 80 and SMA 200 the chances of this new ATH clearly high, also the "uptober" psychology actually nails the current market movement.
My fellow traders and investors do think we would see a plane climb to $140k by December..?
Like and share your thoughts
Thanks for reading.

BTC - All Important Trendlines and Liquidity ZonesAs of the current Bitcoin trend, I have outlined 3 key trendlines as well as the two major liquidity zones we need to keep an eye on right now.
The "Upper Resistance Trendline" has so far marked our three recent all time highs (red arrows). This has been a series of higher highs, which is normally a good sign in a bull market, the only problem is we are started to see some early signs of bearish divergence.
The "Middle Trendline" has acted as a key level mainly for the candle bodies. It has been a support/resistance flip level, but may have confluence in the future.
The "Lower Support Trendline" has acted as our three recent lows. It has helped to create a series of higher lows which is a good sign in an uptrend. The trend needs to maintain this series of higher lows, once we see the confirmation of this trend broken, the bear market will have begun.
Now let's focus on the two main liquidity zones right now.
The first is our "Important Liquidity Zone". This represents all the resistance that was built up from July-August 2025. Ideally, for this uptrend to continue to make new higher highs, this important liquidity zone is a crucial area to hold as a new support level. It ranges from $119.3k-$120.4k. A flip of this zone into new support would indicate that Bitcoin is ready for new all time highs. That is the first thing to watch for.
However, the "Middle Liquidity Zone" represents the $116k-$118k level. This level marked many support/resistance levels for our current trend. Therefore, if our main liquidity zone is breached this could come in confluence with our middle trendline.

Next Volatility Period: Around October 14th
Hello, traders!
Follow us to get the latest information quickly.
Have a great day!
-------------------------------------
(BTCUSDT 1D Chart)
This volatility period is expected to last until October 4th.
Accordingly, the key question is whether it can find support near 119,177.56 and rise.
If not, and the price declines, support near 115,854.56 will be crucial.
If it finds support near 119,177.56 and rises, it is expected to challenge the Fibonacci ratio of 2.618 (133,889.92).
The key areas for maintaining an uptrend are:
- Short-term: 115,854.56-119,177.56,
- Medium-term: 104,463.99-108,353.0,
- Long-term: 87,814.27-93,570.28.
-
Thank you for reading.
We wish you successful trading.
--------------------------------------------------
- Here's an explanation of the big picture.
(3-year bull market, 1-year bear market pattern)
I'll explain more in detail when the bear market begins.
------------------------------------------------------

BTCUSDT - 1
This chart reflects BTCUSDT price action on a short-term timeframe. The current price sits at 122,394.39, and based on candlestick structure, support/resistance zones, and trendlines, here are the key insights:
🔻 Overall Trend
- Price is moving within a descending channel, marked by a downward trendline from top left to mid-right.
- Selling pressure is evident in the red candles, though bullish reactions near support zones suggest buyer interest.
🟩 Support Zones
- A strong support area is identified between 118,925.65 and 119,624.23.
- Increased trading volume in this zone may indicate accumulation and potential reversal.
🟥 Resistance Zones
- First resistance lies between 123,800 and 124,500.
- A breakout above this level could pave the way toward 125,200.
📈 Possible Scenarios
1. Bullish Case: If price stabilizes above the descending trendline and breaks through 124,000, a rally toward 125,200 is likely.
2. Bearish Case: If support at 119,600 fails, price may drop further toward 118,800.
📌 Summary
USDT is currently at a critical juncture. Its reaction to the lower support zone and behavior around the descending trendline will determine the next move. Traders are advised to monitor volume and price action closely, and apply proper risk management.

Bitcoin Breaks the 46-Day Downtrend!On the daily chart, BTC has finally broken the downward trendline that held price action down for the past 46 days since August.
This breakout could mark a shift in momentum, with buyers stepping back in.
📍 Key Levels:
Daily Support: $114,720
Stop Loss White level
Fundamentals: Optimism around institutional flows, the upcoming 2026 halving cycle, and easing Fed rate expectations continue to support the bullish case for Bitcoin.
If the breakout holds, momentum could accelerate higher from here.
If you find this content helpful, don’t forget to like & follow for more updates!

BTCUSDTThis breakout will push BTCUSD back up to 122k. But don't bet all your capital because of that. The market can be volatile, always manage your risk.

Bitcoin : Stay heavy on positionsBitcoin : Stay heavy on positions (2x~3x)
Maintaining the same outlook as before.
** This analysis is based solely on the quantification of crowd psychology.
It does not incorporate price action, trading volume, or macroeconomic indicators.

Short BTC to 117,300BTC has broken the ascending channel and I expect a pullback to the next major support at 117,200 which is also the 50% retracement of the rally to ATH

BTC LONG SETUP 1HAfter a sharp drop, BTC has formed a clear reversal pattern around the demand zone (110–111k).
Currently, price is consolidating in a bullish flag structure right above support — indicating potential continuation to the upside.
🎯 Targets: 117.3k – 119.4k – 123.2k
🛑 Invalidation: Below 110k zone
💡 As long as this structure holds, expecting bullish continuation towards the upper supply region.
#Bitcoin #BTCUSDT #PriceAction #CryptoTrading #TradingSetup #LongSetup #TechnicalAnalysis
Bitcoin Still Has Strong Support Zones — Don’t Lose Hope YetDuring the recent drop from $121,000, Bitcoin didn’t find any strong support levels to hold the price. As I’ve mentioned before, a healthy uptrend must include corrections — otherwise, when correction finally comes, it tends to be deep and aggressive.
That said, there’s still room for further downside, but this time, we have several key support zones that won’t be easily broken:
$108,551 – $109,227
$107,045 – $107,419
$104,783 – $105,395
The reason I’m highlighting these areas is to remind you that each of these zones could act as a potential reversal point, providing buyers with a chance to support the market. So, the situation is not hopeless — the market can still recover from these levels.
If you decide to take a short position, make sure to take profit quickly, close your position, or at least set it to breakeven, since we’re approaching strong demand zones.
As for long positions, I believe it’s still too early — I prefer to wait and see how Bitcoin builds its next price structure before entering.
If Bitcoin dominance starts showing green candles, altcoins might perform better for short trades.

BTC at the China's Mercy$19,000,000,000 liquidated from the crypto market last Friday Oct.10,2025 at the closing of the NYSE Session as Trump's threatens to impose new 100% Tariffs for China. This event recorded the biggest liquidation in Crypto History.
China also warns the US government of countermeasures if Trump doesn’t walk back tariff threat that will be effective Nov.1,2025.
BTC declines to $104,782 as a reaction to fear. Now the scenario is at China's Mercy if they will continue the tariff war between the US or make a truce.
Interest rates announcement gains has been wiped out by this bold declaration of added tariffs.
Upcoming rate cuts can move the BTC to $115K but another fall can happen this week if the tension grows expecting at $100k .
This is not the 1st time Trump has moved the market for Tariff war declaration for China and other countries. Tariffs has been Trump's weapon against China and his main way to raise US revenues.
The Trade war between two countries has massive economic impact on stocks, crypto and other investment vehicles as seen on the market's Fear index.
Can Trump really stand against China?

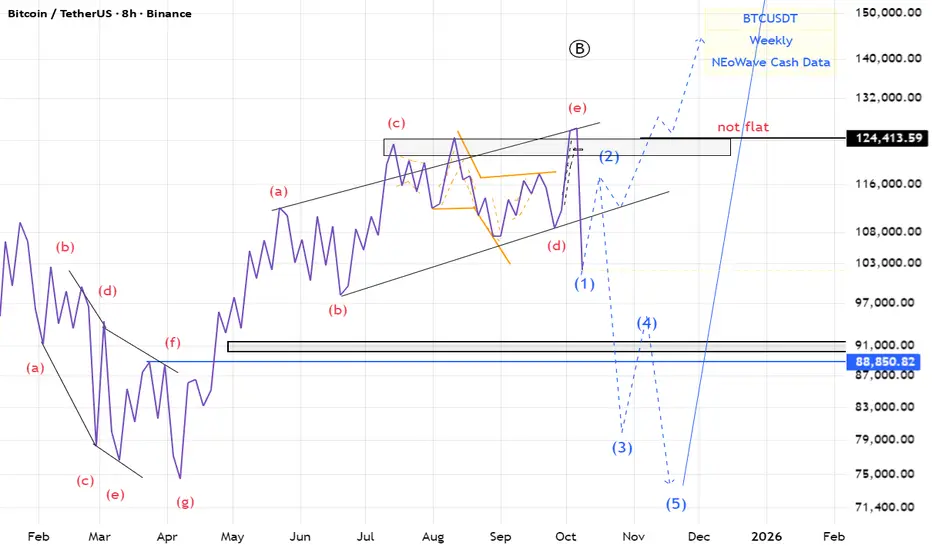
BTC(based on NEo wave)there is a good possibility for the irregular flat.
I think 2-3 month we will see the red market
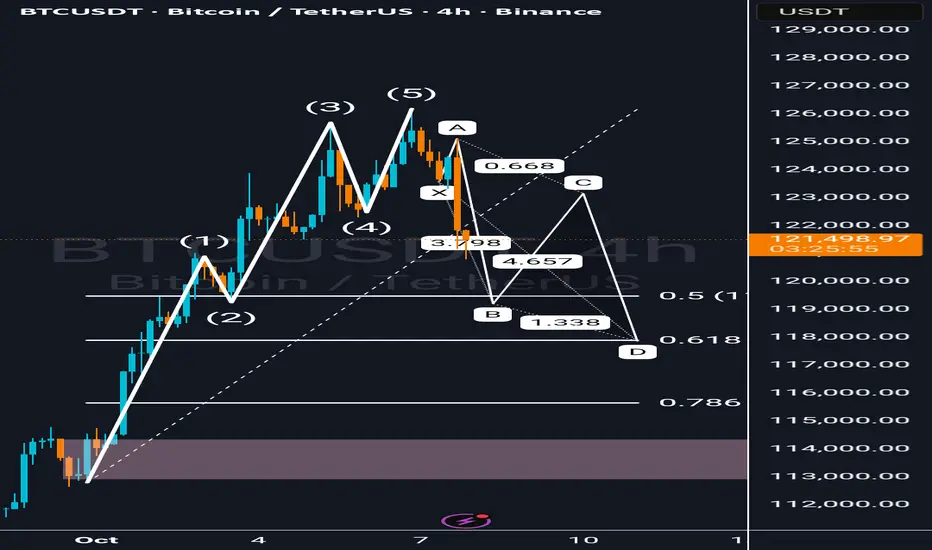
BTC / USDT – Wave 5 Completed, Correction in Progress!
📉 BTCUSDT – Wave 5 Completed, Correction in Progress!
After completing a clear Elliott Wave impulse (1–5), Bitcoin now appears to be entering a complex corrective phase.
The chart shows an emerging ABC pattern that may align with a harmonic XA–BC–D structure, with key Fibonacci confluence zones around:
0.5 retracement: 119,484
0.618 retracement: 117,900
Potential Wave D target: 117K–118K
This correction could offer a buy-the-dip opportunity if BTC holds above the Fibonacci support and shows a strong bullish reaction.
However, if Wave D breaks below the 0.786 zone (around 115K), selling pressure could extend toward the 1.272 extension (around 109K).
📊 Short-term traders: Watch price reactions near 119K–118K.
📈 Long-term investors: Wait for a confirmed reversal signal before entering.
---
💬 What do you think? Is this just a healthy pullback before the next impulsive wave, or the start of a deeper correction?
#BTCUSDT #Bitcoin #ElliottWave #CryptoAnalysis #TradingView
BTC short We have a strong MSB at 1/4h with IMB in the high zone and short reactions on imbalances, a good chance for a possible short reaction from this zone
A strong OB with imbalance and the zone above is defended as a possible manipulation of a bigger short, regardless this is a chance for a smaller but safer R, although nothing is certain with BTC . . .

BTC Head & Shoulders Wave – Short Setup Loading🏄♂️ 📉
📊 Current Setup
BTC just played out a clean head & shoulders pattern right at the $125K resistance zone 😤. After that last push up, price snapped the mid-term bullish trendline with a heavy bearish hit — and that drop nailed the H&S target perfectly, showing real momentum from sellers 🔥.
Now we’re chillin’ inside a lower-low consolidation zone, and bears still look like they’ve got fuel in the tank.
🚦 Scenarios
👉 If BTC pulls back toward the $123,456 zone, I’m watchin’ close — if the structure lines up, that’s a sweet short setup waiting to be surfed 🏄♂️💥.
👉 A clean rejection there could send us down for another solid leg, while a breakout reclaim above $125K would start to weaken the bearish case.
🧭 My Take
Momentum’s clearly shifted — bulls are on the ropes, and the trendline break confirmed it. I’m stayin’ patient for that retracement entry, ready to catch the next wave down 📉🤙.
💬 What do you think about this scenario? Only share your idea if you’ve got another opinion — otherwise just hit that button 👍

BTCUSDT: Trend in 4-H time frameBitcoin has dropped to around $102,300. The key support level and the 50 MV in weekly time frame are both located near $99,700. It’s important to note that there’s a $3,000 price gap, which makes a retest of that zone quite possible.
Looking at Bitcoin’s current setup, there’s also a chance it could retest the 200 MV in daily time frame, situated near $106,800.
A major resistance level can be found around $115,800, and price action around that zone should be watched closely.
Overall, market conditions remain uncertain and unsettled, making it difficult to define a clear trend for Bitcoin or the broader market. That said, the overall trend remains bearish, with potential downside targets across different timeframes around $91700, $81200, $75100, and $70300. Reactions at these levels are to be expected — but if this downward trajectory continues, altcoins are likely to suffer more severely, possibly testing even lower price levels.
The color levels are very accurate levels of support and resistance in different time frames.
A strong move requires a correction to major support and we have to wait for their reaction in these areas.
So, Please pay special attention to the two accurate trends, colored levels, and you must know that SETUP is very sensitive.
BEST,
MT

BTC Bear Flag10/11/25 15minBTC just dropped significantly and is now in a channel on the 15 minute chart.

Btcusdt I think btc re tests 120k every altcoin accumulation shoot up rsi os oversold on small timeframes i think btc will recover
