Forecast for BTCUSDT 13th October 2026 (Updated)Forecast for BTC for the next 4 weeks. Weekend/Monday pump to ~$120k followed by a decline to to ~$105k. Then market forms a bottoming before all time highs to ~$150k-$170k-$200k
BTCUSDT.3L trade ideas

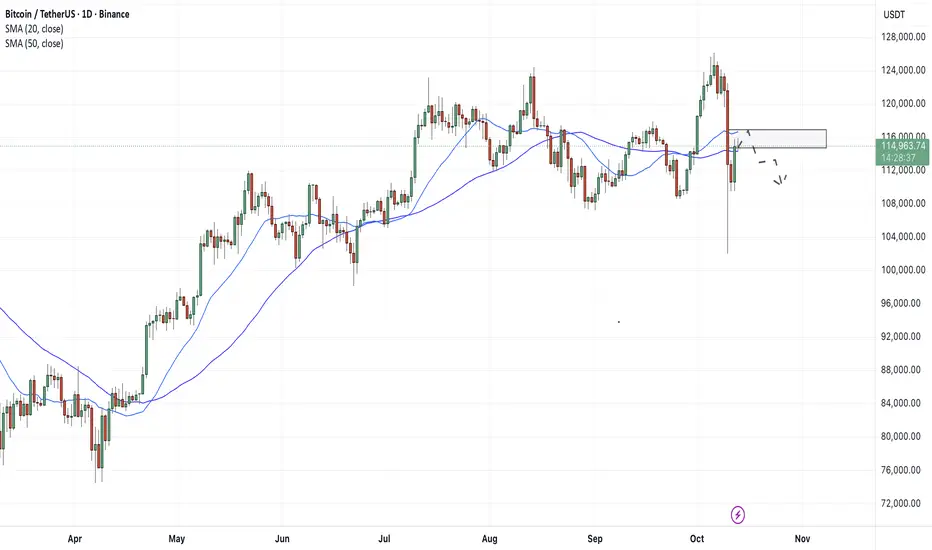
BTCUSDT 1DOk guys, let’s take a look at what’s happening on Bitcoin’s daily chart. We currently have a resistance zone and a support zone, and #BTC is moving between them.
Since Bitcoin is trading below the Ichimoku cloud and the SMA50, while both MACD and RSI are showing bearish signals — combined with the market fear caused by Trump-related news — there’s a chance BTC might retest the support zone around $108,377 ~ $107,146. This area aligns with the daily SMA200, where #Bitcoin could potentially bounce.
For a bullish scenario, Bitcoin needs to break above the resistance zone around $123,306 ~ $124,658. As long as it remains below this area, the market is considered to be in a bearish phase.
Additionally, due to market manipulation and both real and fake news, #BTC could briefly dip to the weekly support zone around $102,620 ~ $101,109, or even make a short-lived shadow below $100,000. As long as Bitcoin doesn’t close a weekly candle below $100,000, the market can still be considered safe and capable of reversing upward.
So, pay close attention to the support and resistance zones marked on the chart.
Important Recommendations:
1- Avoid opening any long or short positions for now.
2- In the spot market, don’t go hunting for coins or tokens just because they look cheap — sometimes the “bottom” you’re buying might actually be the top!
3- Be patient and let the market find its direction and stabilize. Sometimes, waiting and watching is the biggest profit.
4- If you’re an experienced trader, you can buy strong coins with a small portion of your capital while keeping most of your funds in stablecoins to enter at the right moment.
We hope this overview answers the questions many of you have sent us in private messages.
Stay safe! Don’t let fear take over — and don’t act emotionally!

The crazy sweep on the market manipulation.BTC/USDT Update
Whoa… BTC just dropped from around 122k to 102k in no time — that’s a wild –20k move. 😳💥
The good news? It’s still holding above the key bull market support on the daily.
But to keep the structure intact, BTC needs a weekly close above 100k.
For now, patience. Let’s wait for the US or Asia market open and see what the whales are planning next. 🐋🐾
Tele & X: Ya_Bantaam

The Global Payments Revolution Transforming the Way the World Transacts.
1. Introduction: The Digital Transformation of Money
The world is witnessing a monumental shift in how value moves across borders, industries, and individuals. What was once a slow, paper-based, and regionally confined system of payments has evolved into a fast, borderless, digital ecosystem that connects billions of people, devices, and businesses in real time.
This transformation — often called the Global Payments Revolution — is driven by the convergence of technology, regulation, innovation, and consumer demand. From mobile wallets in rural villages to real-time payment rails across continents, the revolution is reshaping not just finance but the entire economic structure of the 21st century.
Money has always been central to human civilization — a store of value, a medium of exchange, and a unit of account. But today, money itself is becoming information — moving through networks, not banks; powered by code, not paper. The global payments revolution is essentially the internet of money in motion.
2. The Evolution of Payments: From Coins to Code
To understand today’s revolution, we must trace the journey of payments.
a. The Physical Era (Before 1970s)
Transactions were largely manual — cash, cheques, money orders. International trade relied on cumbersome processes like letters of credit and SWIFT messages. Payments could take days or even weeks to settle, especially across borders.
b. The Card Era (1970s–1990s)
Credit and debit cards introduced electronic payments to the masses. Networks like Visa, Mastercard, and American Express transformed commerce by linking banks globally. Yet, these systems were still centralized, costly, and dependent on intermediaries.
c. The Internet Era (1990s–2010s)
The rise of the internet gave birth to online banking and digital wallets such as PayPal, Alipay, and Skrill. E-commerce exploded, and people could now send money or shop across the globe instantly. Still, most transactions were routed through traditional banks and card rails, limiting speed and inclusivity.
d. The Real-Time and Blockchain Era (2010s–Present)
The 2010s saw the emergence of real-time payment systems (like India’s UPI, Europe’s SEPA Instant, and the UK’s Faster Payments). At the same time, blockchain and cryptocurrency introduced the idea of decentralized, peer-to-peer payments without intermediaries. Together, these technologies laid the foundation for instant, global, programmable money.
3. The Core Drivers of the Payments Revolution
Several forces are pushing this transformation forward.
a. Digitalization of Commerce
As consumers move online, payments have followed. In 2025, over 75% of global retail transactions involve a digital element — from QR codes to BNPL (Buy Now, Pay Later) models.
b. Smartphone Penetration
Over 6.9 billion smartphones worldwide have made it possible for anyone, anywhere, to send or receive money — even without a bank account. Mobile wallets like M-Pesa (Kenya) and PhonePe (India) have proven how financial inclusion can scale digitally.
c. Rise of FinTech Innovation
Thousands of FinTech startups are building innovative solutions for cross-border transfers, merchant payments, and digital currencies. They’re faster, cheaper, and more user-friendly than banks.
d. Regulatory Push
Governments and central banks are embracing open banking, instant settlements, and central bank digital currencies (CBDCs) to modernize financial infrastructure.
e. Consumer Expectations
Modern consumers expect the same instant experience in finance that they get from social media or messaging — speed, convenience, and transparency.
4. The Rise of Real-Time Payments (RTPs)
One of the cornerstones of the global payments revolution is real-time payments — systems that settle transactions instantly, 24/7.
Countries across the world have implemented these systems:
India: Unified Payments Interface (UPI)
United Kingdom: Faster Payments Service (FPS)
European Union: SEPA Instant
Brazil: Pix
Singapore: FAST and PayNow
Australia: New Payments Platform (NPP)
These systems eliminate intermediaries, reduce costs, and enhance transparency and liquidity. India’s UPI, for instance, processes over 12 billion transactions a month, becoming a global benchmark for instant payments.
The interoperability between banks, wallets, and merchants has made RTPs a backbone for everything from small peer transfers to corporate disbursements.
5. Blockchain, Cryptocurrencies, and the Tokenization Era
The next major leap in payments is decentralization. Blockchain technology introduced trustless, peer-to-peer value exchange — meaning people can transact directly, without intermediaries.
a. Cryptocurrencies
Bitcoin started it all in 2009 as a digital alternative to money. Since then, thousands of cryptocurrencies have emerged, enabling borderless and programmable transactions.
b. Stablecoins
Unlike volatile cryptocurrencies, stablecoins (like USDC, USDT) are pegged to fiat currencies. They are becoming a bridge between traditional finance and decentralized finance (DeFi). Stablecoins now power over $1 trillion in annual payments, used by merchants, exchanges, and remittance platforms.
c. Central Bank Digital Currencies (CBDCs)
Governments are experimenting with digital versions of national currencies. Over 130 countries are researching or piloting CBDCs.
China’s Digital Yuan (e-CNY) and India’s Digital Rupee are leading examples. CBDCs could make payments more efficient while giving central banks control over digital money supply.
d. Tokenization and Smart Contracts
Payments are evolving beyond money transfers. With tokenization, assets (stocks, real estate, art) can be represented digitally and traded instantly. Smart contracts automate transactions based on conditions — enabling innovations like programmable payrolls, automated lending, and decentralized insurance.
6. The Revolution in Cross-Border Payments
Cross-border payments have traditionally been slow, expensive, and opaque. It could take days to send money abroad due to multiple intermediaries.
The revolution is solving this problem through:
Blockchain-based networks like Ripple and Stellar, which move money in seconds.
FinTech platforms like Wise, Revolut, and Remitly, offering low-cost, real-time transfers.
Interlinking of domestic payment systems, like UPI-PayNow (India-Singapore), creating a global instant payment network.
According to the Bank for International Settlements (BIS), global cross-border payments could reach $300 trillion annually by 2030, with instant, transparent transfers becoming the norm.
7. The Role of FinTech and Big Tech in Shaping the Revolution
a. FinTech Startups
Startups have disrupted the legacy systems with agile technology and customer-first models. Companies like Stripe, Square, Razorpay, and Adyen have built global platforms for online and offline payments.
b. Big Tech Ecosystems
Tech giants like Apple (Apple Pay), Google (Google Pay), Amazon Pay, and Alibaba’s Alipay have turned digital payments into lifestyle ecosystems — blending shopping, banking, and social networking.
Their influence has blurred the line between commerce and finance, leading to “super apps” — platforms that offer everything from ride-booking to investments within one interface.
8. Financial Inclusion: The Human Side of the Revolution
Perhaps the most powerful outcome of the global payments revolution is financial inclusion.
Over 1.4 billion people globally were unbanked as of 2022. But mobile payments and digital identity systems have brought millions into the formal economy.
In Africa, M-Pesa enabled farmers and small merchants to transact digitally without banks.
In India, UPI and Aadhaar have created the world’s largest financial inclusion network.
In Latin America, platforms like MercadoPago and Nubank have democratized access to digital finance.
The payments revolution isn’t just about faster transactions — it’s about empowering people, reducing poverty, and fueling entrepreneurship.
9. Security, Regulation, and the Future of Trust
As payments become digital and global, security and regulation have become critical.
a. Cybersecurity and Fraud Prevention
With billions of digital transactions daily, threats like phishing, identity theft, and fraud are rising. Technologies such as biometric authentication, AI-based risk scoring, and blockchain transparency are strengthening trust.
b. Data Privacy and Regulation
Governments worldwide are enforcing data protection laws (like GDPR in Europe) and open banking standards. The challenge is balancing innovation with consumer protection.
c. Global Cooperation
Organizations like SWIFT, IMF, and the Financial Stability Board (FSB) are working on global interoperability standards to make cross-border payments seamless while maintaining compliance with anti-money laundering (AML) and KYC norms.
Trust is the new currency in a digital economy — and it must be built on transparency, accountability, and user control.
10. The Future: What Lies Ahead for Global Payments
The global payments landscape is evolving faster than ever. The future will be defined by five megatrends:
a. Embedded Finance
Payments will be integrated invisibly into apps, vehicles, and smart devices — making transactions seamless and contextual.
b. Digital Currencies & Token Economy
CBDCs and tokenized assets will coexist with traditional money, creating a multi-currency digital ecosystem.
c. AI-Driven Payment Intelligence
Artificial Intelligence will optimize transaction routing, fraud detection, and personalized offers — making payments smarter and predictive.
d. Cross-Network Interoperability
We’ll see greater interlinking of payment systems — from UPI to PayNow to SEPA — enabling global instant money movement.
e. Sustainability and Green Payments
The next revolution will also be environmental — where digital payments reduce paper use, travel emissions, and support carbon-neutral finance.
11. Conclusion: The Internet of Value Has Arrived
The Global Payments Revolution is not just a financial story — it’s a societal transformation. It’s redefining how humans, machines, and institutions exchange value in real time, anywhere in the world.
From the farmer in Kenya paying by mobile phone to a global corporation settling invoices instantly across continents, payments are becoming frictionless, inclusive, and intelligent.
In the coming decade, the distinction between money, data, and technology will blur completely. Payments will not just move value — they will move opportunity, empowerment, and innovation.
We are standing at the edge of a world where money flows as freely as information, and that is the true essence of the Global Payments Revolution.
Forecasting the Cycle High... And Next Bear Market Low?This is an interesting study I originally did 2 years ago.
What started as a conversation with a student, who asked me if we could somenow 'project the next Bear market low'...
It got me thinking, and experimenting.
In this video I share the nearly 'accidental' discovery we made, and I think people might finding interesting (albeit pure speculation and most probably wrong).
Any comments welcome.
PS> Apologies for the rambling, it's been a long day.

BTCUSD NEXT POSSIBLE MOVE Bitcoin is currently consolidating around a strong support zone, where buyers have previously stepped in to push prices higher. The recent price action shows signs of accumulation and slowing bearish momentum, indicating that the market could be preparing for a potential bullish reversal.
If the price continues to hold above this support and forms a bullish candle pattern (like a higher low or engulfing candle), it could confirm buyers regaining control.
Volume activity also suggests that selling pressure is fading, while buyers are gradually absorbing liquidity from lower levels.
As long as Bitcoin remains above this key support area, the structure stays bullish, and the next impulse move to the upside could be expected once momentum confirms.

10% Drop From the Highs – Is the Bear Market Already Here?Bitcoin continues to show signs of weakness, and the market structure is becoming increasingly bearish. On the footprint chart, we’re seeing strong and consistent selling pressure with barely any signs of absorption from buyers. Every short-term bounce is being sold into — clear proof that sellers are still in control while demand is drying up.
From a Volume Profile perspective, a clear downside structure is now forming. The distribution of volume suggests that sellers are building momentum for a continuation move lower, with the next major target sitting around $109,000 per coin. This level lines up with the previous high-volume node — a natural area for price to gravitate toward if selling pressure continues.
The Point & Figure chart reinforces that picture: there’s a clear cluster of liquidity resting around the $90,000 zone, which represents a key magnet for price. This area holds significant stop orders and resting bids from previous accumulation zones. Once that liquidity is swept, we could finally see a potential shift in market direction, but until then — the path of least resistance remains to the downside.
From a Wyckoff standpoint, Bitcoin is still in the Distribution phase, where institutional players unload positions onto retail traders. This stage often feels “stable” to the average participant, but it typically precedes the markdown phase — when price accelerates downward and confidence starts to break.
Technically, the market is already showing a bearish trend, with price approaching a 10%+ decline from the previous high. Historically, such a move signals more than just a correction — it often marks the beginning of a bear market, or at least a medium-term downtrend where sellers dominate.
On the macro side, equities also look stretched. The Buffett Indicator — which measures the total stock market capitalization relative to GDP — is sitting near historic highs, signaling that markets are significantly overvalued compared to the real economy.
Recent news and data back this up: company valuations remain inflated while growth numbers are slowing down. That mix — high valuations with weakening fundamentals — has always been a red flag for broader market risk and volatility ahead.
Bottom Line:
Bitcoin is trading in a clear bearish structure, with strong selling pressure, a forming volume profile pointing lower, and heavy liquidity sitting around $90K. A drop of more than 10% from the recent highs confirms growing downside momentum and hints at the possible start of a broader bear market. Until buyers step in with conviction, caution is key — rallies are likely to be short-lived and met with renewed selling.

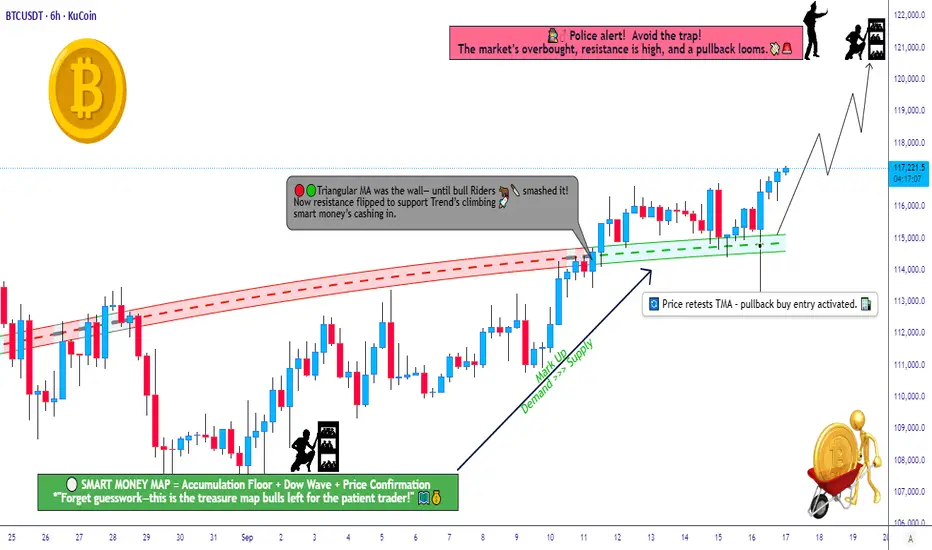
BTC/USDT Wealth Map – Trend Confirmed, Targets in Sight!🚀 BTC/USDT: The Great Crypto Heist! 🤑 Swing/Day Trade Wealth Map
Asset: BTC/USDT (Bitcoin vs. Tether) Vibe: Bullish breakout with a cheeky "thief" twist! 😎Strategy: Swing/Day Trade with a layered limit order approach to steal profits from the market! 💰
📊 Market Analysis: The Heist Setup
🐂 Bullish Trend Alert: Bitcoin’s charging out of the accumulation zone like a runaway train! 🚂
📈 Triangular Moving Average (TMA) Breakout: Price smashed through the TMA, confirming a reaccumulation phase. Candles retested the TMA dynamic line, screaming TREND CONFIRMED — bulls are in control! 💪
🕵️♂️ Thief Strategy: We’re using a layered limit order approach (aka the "Thief Layering Tactic") to sneak into the market at multiple price levels. This maximizes entries while keeping it slick and stylish!
🗺️ The Heist Plan
🎯 Entry: Pick your spots like a master thief!
🔹 Use layered buy limit orders at:
💸 $115,000
💸 $115,500
💸 $116,000
💸 $116,500
💸 $117,000
🔍 Pro Tip: Feel free to add more layers based on your risk appetite and market conditions! Stack those entries like a pro. 😎
🌟 Alternative: If you’re feeling bold, enter at any price level post-breakout — just keep an eye on momentum!
🛡️ Stop Loss (SL): Set your Thief SL at $114,000 after the breakout for protection.
🔹 Dear Ladies & Gentlemen (Thief OGs), this SL is a suggestion! Adjust it based on your strategy and risk tolerance. Don’t let the market cops catch you off-guard! 🚨
🎯 Take Profit (TP): Watch out for the police barricade (aka strong resistance) at $121,000. This zone may act as an overbought trap, so grab your profits and escape before the market locks you in! 🏃♂️
🔹 Note: Thief OGs, this TP is a guideline. Set your own targets based on your risk-reward preference. Steal the profits and vanish! 💸
🧠 Key Notes for Thief OGs
⚠️ Risk Management: I’m not your financial advisor, so don’t just follow my SL or TP blindly. Tailor your plan to your own risk tolerance and make those profits yours!
🕵️♂️ Thief Mindset: The market’s a game of cat and mouse. Stay sharp, adapt, and don’t get greedy — escape with your loot before the traps spring!
🔗 Related Pairs to Watch
Keep an eye on these correlated assets for extra context:
🔹 BINANCE:ETHUSDT : Ethereum often moves in tandem with Bitcoin. A bullish BTC breakout could spark ETH’s own rally. Watch for similar TMA breakouts or retests!
🔹 BINANCE:BNBUSDT : Binance Coin tends to follow BTC’s lead in bullish markets. Check for momentum alignment.
🔹 BINANCE:XRPUSDT : Ripple can show correlated strength, especially if BTC pushes past resistance. Look for breakouts above key levels.
🌟 Correlation Tip: These pairs often mirror BTC’s price action in bullish trends, but always confirm with your own analysis to avoid market traps! 🕸️
✨ Final Words
This is your chance to pull off the ultimate crypto heist with BTC/USDT! Stay disciplined, manage your risk, and let’s make those profits disappear into your wallet! 😜
✨ If you find value in my analysis, a 👍 and 🚀 boost is much appreciated — it helps me share more setups with the community!
#BTCUSDT #CryptoTrading #SwingTrading #DayTrading #ThiefStrategy #BullishBreakout #TradingView

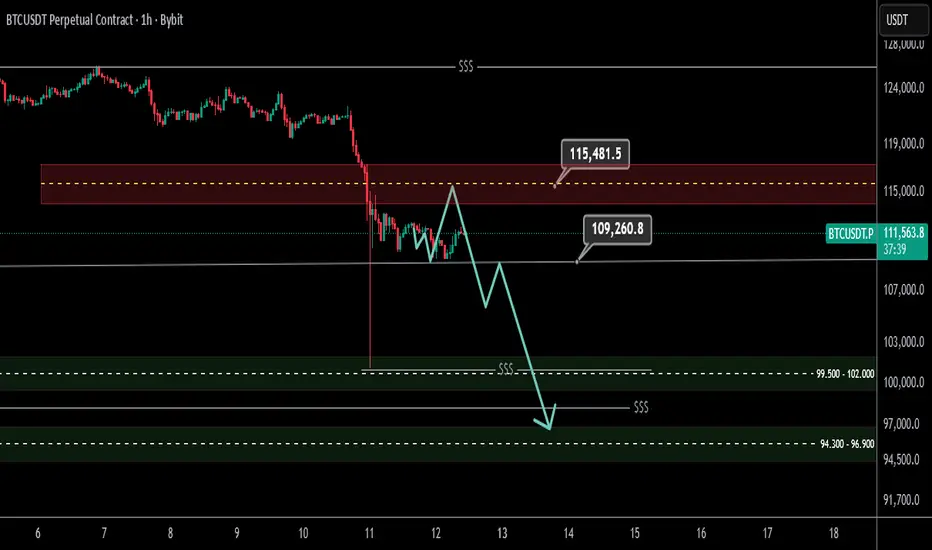
BTCUSDT - is it good time to buy?BTCUSDT appears to be in a distribution phase after recent highs. I’ll wait for a breakout above 113,333 to confirm renewed bullish momentum and look for buy opportunities from that level.
However, if price shows strength below the resistance, I plan to short on strength with a stop loss at 114,000.
For a long-term buying setup, my ideal accumulation zone lies around 94,200 – 96,700, where I’ll be looking for potential reversal signs and fresh entries.

Btc As expected, the drop has occurred.
While most traders were waiting for higher prices, our team was focused on finding an entry point for a sell position.
We had a confirmation candle for the drop, followed by a pullback confirmation.
Now, we can expect a possible return to the pullback candle, but only if confirmation is provided — otherwise, the price may first move toward the 94–92K range

Bitcoin long Looking for entry at lower level of npoc .
I think a push to the upside will commence soon .
Btc soon above 130k.
Let us wait.

Short BTC at 123,200A potential ABC correction is forming of the 30min chart, that will take BTC down to 117,400 from 123,200. The short entry also coincides with a minor support tuned resistance and SMA(200).
Short Entry - 123,200
Target - 117,500
Stop - 124400

BTC Short-Term 1H🔹 General Context
On the chart, we see that Bitcoin:
Has broken the local downtrend line (yellow line), suggesting an attempt to change the short-term trend.
It is currently consolidating just above the 50/200 EMA, which is a positive sign for bulls.
We also see a MACD crossover in the positive zone and an RSI rising, but not yet overloaded (around 52–60).
🔸 Key Technical Levels
Support:
122.460 USDT – strong local support, aligned with previous lows and the 200 EMA.
121.900 USDT – next support, also marked by the blue 200 EMA.
120.600 USDT – deeper support, recent significant low.
Resistance:
123,700 – 123,900 USDT – resistance zone where the price is currently stalling (there was a reaction after the trendline breakout).
124,700 USDT – next resistance level (local high).
125,700 USDT – strong resistance resulting from previous swing highs.
🔸 Technical Indicators
📈 EMA 50/200 (golden cross on 1 hour):
The 50 EMA is breaking below the 200 EMA – a classic bullish signal (Golden Cross).
Confirmation requires the price to stay above 122,800 USDT for several H1 candles.
📊 MACD:
The histogram has turned positive, the MACD line is breaking above the signal line – momentum is increasing.
There is no strong negative divergence yet, so the signal is clear.
💪 RSI:
Value ~52–60 – moderately bullish.
It is not overbought yet, so there is potential for further upward movement.
🔹 Scenarios
✅ Bullish Scenario:
Sustainability above 122,800 USDT.
A breakout and retest of the 123,700–123,900 USDT resistance could open the way to 124,700 USDT and then 125,700 USDT.
The MACD and RSI support this scenario.
❌ Bearish Scenario:
A reversal from the current level and a decline below 122,400 USDT.
A retest of 121,900 USDT and a possible deepening correction to 120,600 USDT is possible.

BITCOIN... THE DROP IS NOT OVER YET!I see a lot of people fomo-ing to buy the dip, but I don't think this is the bottom yet. At least, that is not what my technical analysis is showing me.
I am expecting Bitcoin to likely go down to the 100k level again, maybe even less to 95k. The question is, will it go back up from there? I think there is a good possibility to make new all-time highs. BUT, if it does not show support or bounce hard, and higher timeframe candles start to close lower, this could mean quite bad things for crypto..
Let's wait and see..
Trade safe!
- R2F

The fall of BTC, the shock necessary for the revival of altcoins
Despite the growth of Bitcoin from 15000 to 126000$ , practically popular altcoins such as shiba, ada, floki, etc did not grow noticeably and significantly, and before the fall of Bitcoin, I was sure that altcoins needed a big shock to start again, this fall was an activation for altcoins. In my opinion, the growth trend of Bitcoin is not over yet and I believe that we will see a new NATH record, but with the difference that altcoins will grow much better than before. This is not the first time that Bitcoin has seen such shocks due to Trump's economic policies, and experience has shown that Bitcoin has the ability to continue its path after such shocks, and it is these traders who must choose between fear and opportunism.

BTCUSDT.P - We are not probably out of the woods yetCRYPTOCAP:BTC Ideas to think of. Probably not out of the woods yet.
This on-going pump is very likely to be dead cat bounce and we might be heading some more downside.
Bull market over? Don't think so. I think we have better odds than former World Ski Jump Champion and Olympic Medalist Matti Nykaenen have said 'it's fifty sixty'.😄
Leave me your thoughts on the comments, would love to hear them to get more ideas on the table. Maybe I missed something?

Bitcoin wobbles after Friday's crashBitcoin has suffered from Friday's sell-off, though it tends to show signs of recovery during Monday’s session. After record liquidations worth of 20 billion dollars on the crypto markets, the sentiment for cryptos remains halted, but BTC tends to act as a “digital gold”, and a safe haven to some degree, that’s why it’s possible to observe some demand coming in to the BTC market later.
From a technical standpoint, BTCUSD has come to the dynamic resistance area (the distance between 20 and 50 moving averages), and if it would not show any signs of further recovery, it would probably pull back to the $110000 price area with a further consolidation.
Don't forget - this is just the idea, always do your own research and never forget to manage your risk!
Beginning of the bearmarket for $BTC?I don’t want to be the negative voice claiming this is the start of a #bearmarket for CRYPTOCAP:BTC and #Crypto, but this scenario deserves attention. Looking at #Bitcoin on the weekly timeframe, we’re seeing another significant bearish divergence, followed by a capitulation candle.
So you tell me: is this the beginning of a bear market, or was it a black swan event with a V-shape recovery?
BITSTAMP:BTCUSD BINANCE:BTCUSDT COINBASE:BTCUSD INDEX:BTCUSD CRYPTO:BTCUSD BINANCE:BTCUSD

BTC Macro PathInner channel still intact.
If this structure holds, Bitcoin could stretch to the $140K–$150K zone before the next major reset.
That level likely marks the cycle top after which a sharp correction back to the $70K region becomes the next logical move.
Not the end of the bull, just the part where patience and discipline separate traders from tourists.
NFA

Bitcoin 1-hour time frame outlookHi traders
The 115 level will be an important resistance and reaction
And from the support considered after the hunt for two liquidity levels, the bottom is followed by a trigger buy
BTCUSDTBitcoin is trying to put good volume above this line and pull itself up. I think you can look for a long position.

Bitcoin Daily AnalysisHi Traders
Bitcoin Daily Time Frame After Liquidity Hunt A multi-layered level is currently above its own Hunt line. The upper and lower liquidity points on the chart are characteristic and the condition for reaching the lower liquidity points is to close the daily candle below the Hunt line 109.260 in this case the support level below the liquidity is characteristic for Trigger Buy
