Btc going downBitcoin is currently trading around 122,000 – 123,000, approaching the key resistance zone of 124,500 – 123,300. I expect the price to show a rejection or a stop-hunt above this resistance before entering a bearish move.
Bearish Targets:
• 🎯 Target 1: 108,000 – 107,200 (short-term support)
• 🎯 Target 2: 105,000 (key support)
• 🎯 Target 3: 100,000 – 102,000 (major base zone)
• 🎯 Final Target: 94,000 – 95,000 (liquidity pool below)
Reasons for this scenario:
• Liquidity resting above 124,500 with a high chance of stop-hunt
• Presence of unfilled FVGs (fair value gaps) below
• Untested base/support zones between 100K – 94K
BTCUSDT.3L trade ideas

Long BTC📊 BTC Market Update
Weekly TF: BTC is closing with a bullish weekly candle, signaling strong momentum continuation.
4H TF: Price has broken above the range high and is now retesting it as support — a classic breakout-retest setup.
✅ Long Bias
Structure and momentum align with a long entry, with favorable R:R as outlined in the chart.
Breakout confirmation on the retest strengthens the case for continuation to higher targets.
⚠️ Key to Monitor
Hold above the reclaimed range high.
Volume confirmation on the retest for sustainability.
Macro events and BTC dominance shifts that could affect follow-through.
Disclaimer:
This analysis is based on my personnal views and is not a financial advice. Risk is under your control.

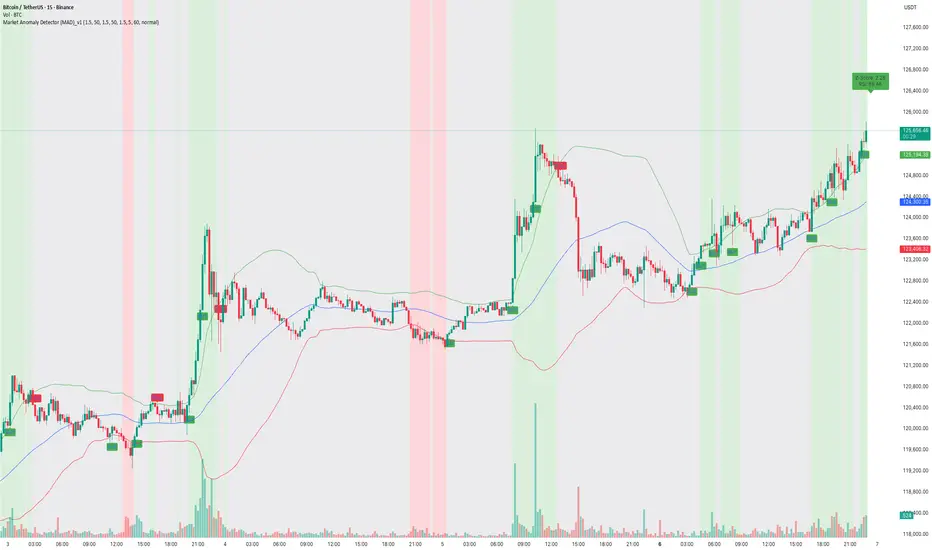
How to capture trend using MAD Indicator!📝 Description:
Watch how the Market Anomaly Detector (MAD) precisely captured the start of the Bitcoin breakout on the 15-minute chart — with no lag, early confirmation, and clear signals.
This BTC/USDT rally was flagged using:
• ✅ Z-Score Spike + RSI confirmation
• ✅ Volume Thrust + Trend Strength Filter
• ✅ Dynamic Zone Coloring for Visual Clarity
• ✅ Trade Cooldown Filter to avoid signal noise
💡 The green background highlights anomaly confirmation zones, while red indicates potential fakeouts or traps.
In this rally:
• The MAD indicator identified the compression breakout
• Maintained bullish zone with no false exit
• Generated a clean trend-following environment using adaptive logic.
🔍 Why MAD Works:
The MAD Indicator isn’t just about spotting anomalies — it adapts based on:
• Market volatility and relative volume
• Internal momentum using z-score logic
• Confirmation from RSI & EMAs
• A cooldown filter to prevent overtrading in choppy zones
📈 Perfect for scalpers, intraday traders, and short-term swing setups on crypto and stocks.
BTC - Weekly Breakout!📈 BTC has already broken out of its correction phase and is holding strong above $118k.
As long as $118k holds, the next targets sit between $126k–$140k.
Only a drop below $114k would delay the bullish outlook.
Trend remains strongly bullish after the breakout.
⚠️ Disclaimer: Not financial advice. Manage risk properly.
All Strategies Are Good; If Managed Properly!
~Richard Nasr.

What are your thoughts on the current trend ? At this level, the price may experience a slight pullback to the Fibonacci support levels at 0.618 – 0.5, which could present a good opportunity for the next buying entry. If these levels hold, we could witness a strong breakout above the resistance zone BINANCE:BTCUSD
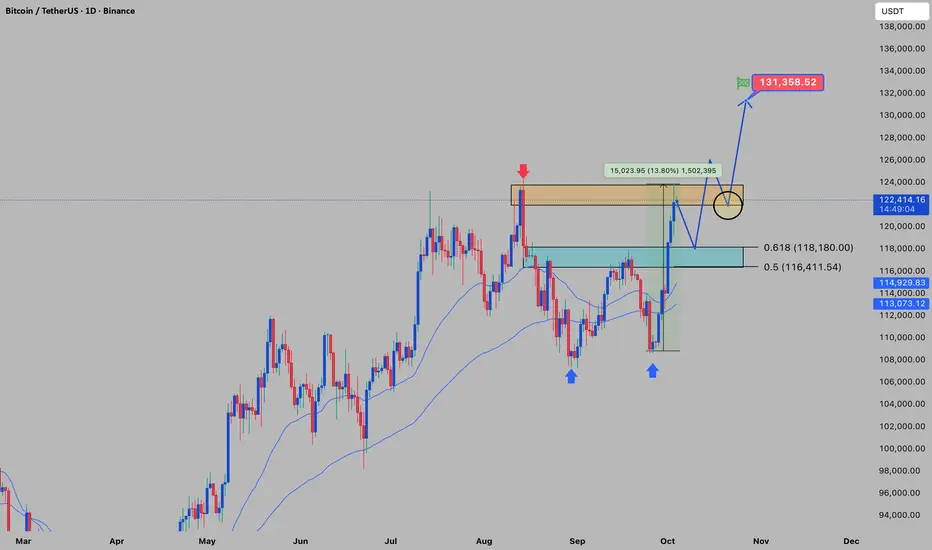
Forecast for BTCUSDT 4th October 2026 (Updated)Forecast for BTC for the next 4 weeks. Continuation to ~$125k followed by a retrace to ~$113k and a bounce, followed by continuation down to ~$104k for a bottoming before new all-time-high towards ~$150k-$170k.

BTC: Growth from $109KOn September 28, Bitcoin turned into an upward movement on the 1-hour chart from the $109,804 zone. From this level, the market went through all four stages of profit-taking and reached $120,999, giving a potential difference of more than $11,000 per coin. Those who followed the system were able to capture the maximum from this trend.
The key point here is how the movement was managed. The algorithm highlighted important zones, helped secure the position in time, and reduced risks. No emotions, no guessing—just a step-by-step process where every action was clear in advance and confirmed by market structure.
For beginners, such a tool works like a navigator: it shows where it’s safer to lock in profits and when it makes sense to hold longer. In conditions of high volatility, discipline, automation, and technical analysis become the main advantage. That’s what turns the market from a chaotic game into a structured process. An interesting fact I’ve noticed is that this indicator shows an 84% win rate on Bitcoin trades.

BTCUSDT - 1
This chart reflects BTCUSDT price action on a short-term timeframe. The current price sits at 122,394.39, and based on candlestick structure, support/resistance zones, and trendlines, here are the key insights:
🔻 Overall Trend
- Price is moving within a descending channel, marked by a downward trendline from top left to mid-right.
- Selling pressure is evident in the red candles, though bullish reactions near support zones suggest buyer interest.
🟩 Support Zones
- A strong support area is identified between 118,925.65 and 119,624.23.
- Increased trading volume in this zone may indicate accumulation and potential reversal.
🟥 Resistance Zones
- First resistance lies between 123,800 and 124,500.
- A breakout above this level could pave the way toward 125,200.
📈 Possible Scenarios
1. Bullish Case: If price stabilizes above the descending trendline and breaks through 124,000, a rally toward 125,200 is likely.
2. Bearish Case: If support at 119,600 fails, price may drop further toward 118,800.
📌 Summary
USDT is currently at a critical juncture. Its reaction to the lower support zone and behavior around the descending trendline will determine the next move. Traders are advised to monitor volume and price action closely, and apply proper risk management.


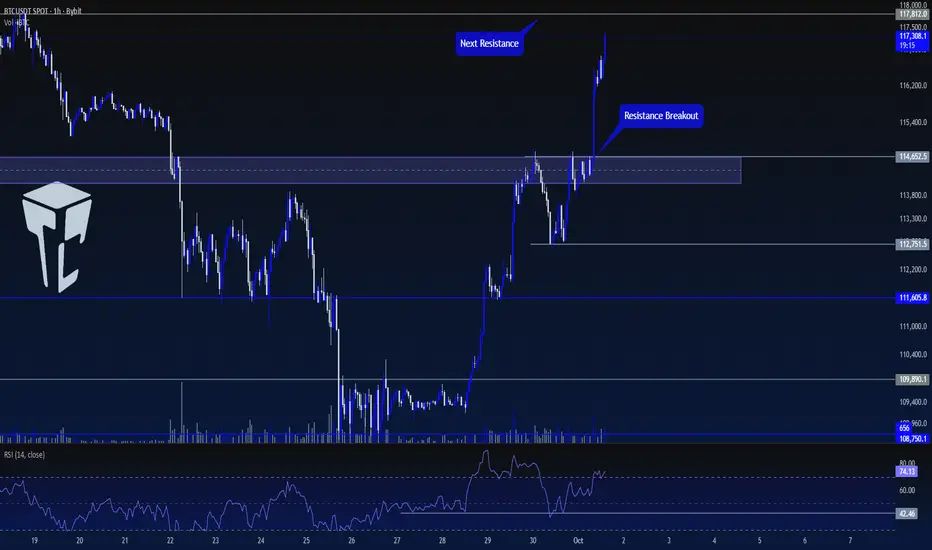
TradeCityPro | Bitcoin Daily Analysis #185👋 Welcome to TradeCity Pro!
Let’s move on to the Bitcoin analysis. Bitcoin’s bullish trend is still continuing, and today during the London session it made another upward move. Let’s review today’s triggers together.
⏳ 1-Hour Timeframe
Yesterday, after the correction, Bitcoin formed a bottom at 112751 and with the RSI being supported at 42.46, the upward move started.
🔔 The trigger we had yesterday for opening a position was the breakout of the resistance zone, with the exact trigger forming at 114652. After the breakout, the price started its second upward wave.
💥 The RSI oscillator has also entered the Overbuy zone, and the market momentum is fully bullish. The next resistance we have is at 117812.
💫 If the price reaches 117812 and the RSI exits the Overbuy zone, we can take profit on the position.
✅ For a new position, no fresh trigger can be given right now because the price is moving sharply upward, and opening any new position here would be considered risky with a high chance of hitting stop-loss.
📊 The area I expect the price to react to is 117812, but I will wait for the price to first build a structure before opening a position.
❌ Disclaimer ❌
Trading futures is highly risky and dangerous. If you're not an expert, these triggers may not be suitable for you. You should first learn risk and capital management. You can also use the educational content from this channel.
Finally, these triggers reflect my personal opinions on price action, and the market may move completely against this analysis. So, do your own research before opening any position.
#BITCOIN ANALYSIS For the last 40 days I’ve been telling you #BITCOIN ANALYSIS
For the last 40 days I’ve been telling you guys I’m bearish on $BTC. We already dropped almost 8K twice, but every time Bitcoin reclaimed the levels again. Right now it’s trading around 18K to 119k but nothing has changed for me. I’m still bearish.
I’ve said many times that the 115K to 124K region is a short zone, not a long zone. If you’re still holding longs, I’d strongly suggest you flip to shorts because the chart is flashing multiple top signals.
Don’t get trapped by hype like “Bitcoin to 1 million by the end of this year.” That’s just noise. The structure is weak, liquidity is being engineered, and the bigger downside move is still ahead.
📌 Downside Targets:
105K → 100K → 95K → 90K

BTC/USDTENTRY:122927_125700
SL:126505
TP:109700
Hunter pressing the trap button
**Please observe capital management
There is no responsibility for your profits or losses.**

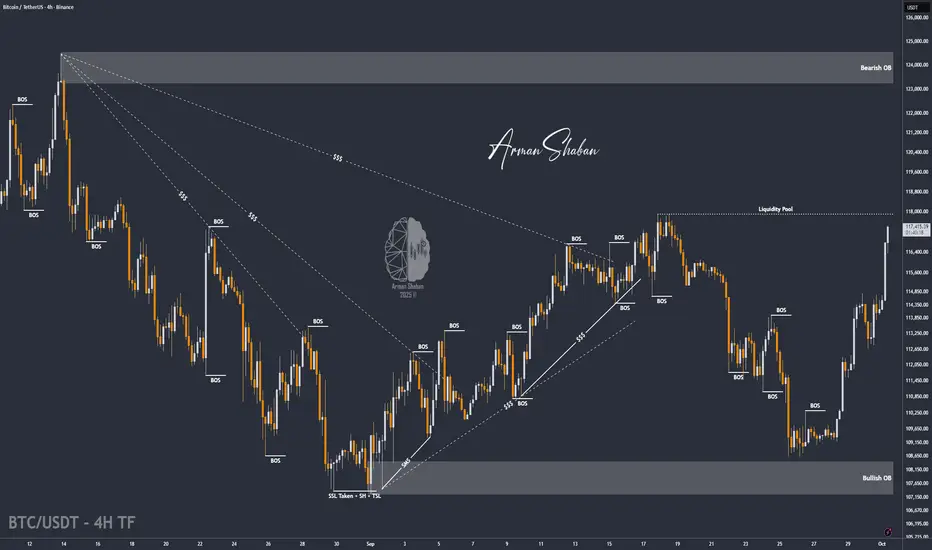
BTC/USDT | BTC Rally +7% Gains – Bulls Still in Control (READ)By analyzing the Bitcoin chart on the 4-hour timeframe, we can see that the price continued its rally as expected, hitting the $115K target and now reaching up to $117,200, just one step away from the next target at $118K. So far, this analysis has delivered more than 7% gains. I hope you made the most out of it!
Please support me with your likes and comments to motivate me to share more analysis with you and share your opinion about the possible trend of this chart with me !
Best Regards , Arman Shaban
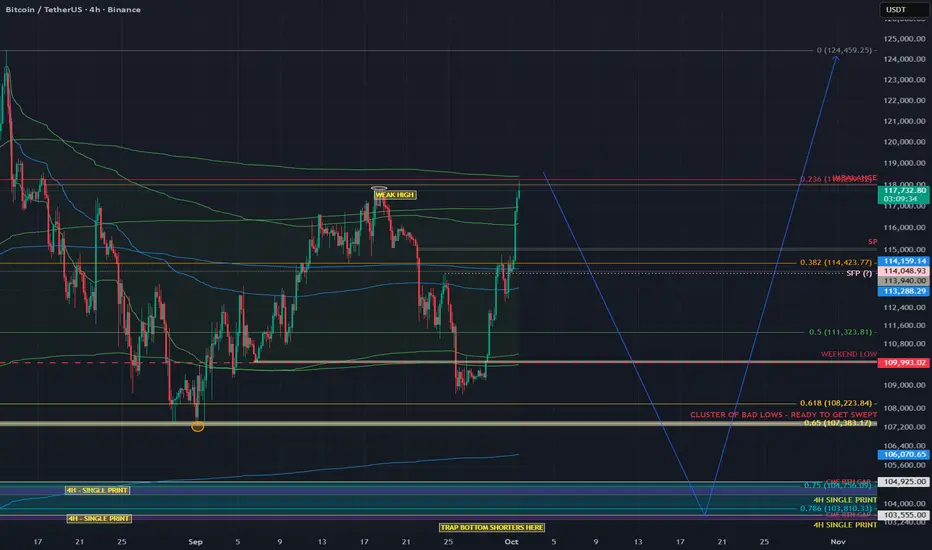
BITCOIN’S PUMP BEFORE THE DUMP — CRYPTO ABOUT TO CRASHTRADERS, WE ARE STARING RIGHT INTO THE EYE OF THE STORM. BITCOIN’S “TOO GOOD TO BE TRUE” RALLY IS BEING PROPPED UP BY LEVERAGED PERPS, NOT REAL SPOT BUYING. THE CHART IS SCREAMING EXHAUSTION: AVWAP BANDS COLLIDING, ORDER FLOW MAXED OUT WITH AGGRESSIVE LONGS, AND A DANGEROUS IMBALANCE AROUND 118K. THIS IS THE PERFECT BREEDING GROUND FOR A MEGA LONG SQUEEZE THAT WILL NOT ONLY RIP THROUGH BITCOIN BUT DRAG THE ENTIRE CRYPTO MARKET DOWN WITH IT. THE PUMP IS THE TRAP. THE DUMP IS LOADING
TLDR;
This leg looks futures-driven, not spot-backed. We’re pushing into AVWAP outer-band confluence with imbalances near 118k while leveraged longs pile in. Base case: sweep the mid-Sept Weak High, fail, rotate down toward 104k (and maybe 98.5k). I’ll flip only if spot CVD takes the lead and price accepts above the AVWAP band cluster.
Why I think the “mega long squeeze” is loading
1) Who’s actually buying? (Spot CVD vs Futures CVD)
Spot CVD: still negative/underwhelming across the push → real buyers (spot) aren’t lifting.
Futures CVD (stablecoin-margined): rising with Open Interest → perps are doing the heavy lifting.
Translation: Leverage is pushing price, not genuine spot accumulation. These moves are fragile and unwind hard when OI compresses.
2) AVWAP confluence (the auction math)
I’m tagging anchored VWAPs from opposing pivots (swing low→high and swing high→low).
The outer bands from these anchors are overlapping in the same zone → both bottom-anchored longs see it as expensive (profit-taking), and top-anchored shorts defend their break-even.
That overlap = double-sided supply. Historically, these reject unless fresh spot demand blows through (which we don’t have… yet).
Still have bad September lows that are likely to be swept at 107k~
3) 118k imbalance
There’s an inefficient push / imbalance around 118k. Thin structure often gets tapped/swept, then mean-reverts if the follow-through is purely leveraged.
4) Order flow is too aggressive (late longs)
OI up + positive delta into resistance = new longs chasing.
On footprint, you can see buy-side aggression meeting absorption near the top of the move. That’s classic trap fuel if we print an SFP.
Trade idea (conceptual, not financial advice)
Base case path (bearish):
✅ Sweep the Weak High (mid-Sept) into 117.8–118.8k (imbalance + AVWAP band confluence).
✅ Print a Swing-Fail Pattern (SFP) / rejection wick on 5–15m with:
Spot CVD NOT confirming (stays flat/negative),
OI spikes while delta stalls (late longs absorbed).
Short after the reclaim/failure back below the swept high; stop above the SFP high.
Targets / magnets:
113.2–114.1k (0.382 zone / local AVWAP midlines)
111.3k (0.5 retrace / prior balance edge)
109.9–109.3k (weekend low / prior node)
106.0–104.9k (SP + LVN cluster, high-prob test area)
Stretch: 103.5k (4H single print) → 98.5k if liquidation cascade extends.
validation / flip criteria:
Acceptance above the AVWAP outer-band cluster and 118.8k with:
Spot CVD turning positive and making higher highs,
OI stable or down on further upside (less leverage dependence).
If that happens, I stand down on the short idea and reassess for continuation
Bitcoin: Possible ScenariosBTC daily has closed above 119k, keeping the probability of a breakout to a new high.
I suggest possible scenarios:
Failure to break above 124k from current levels and the formation of a Head & Shoulders right shoulder.
Reasons: monthly timeframe divergence, overbought conditions, open interest imbalance, longs clearly outnumber shorts.
Move to 130k from current levels.
Reasons: crypto hype is still very strong, global recognition, government reserves, ETFs, strong pressure toward the 120k level, higher lows being formed.
Breakout to a new high via a short squeeze, but sustained growth will be lacking.
In this case, buyers will mostly be short-sellers being liquidated, with insufficient real demand to support price at higher levels. The move would wipe out the remaining weak shorts, after which a correction back to 108k–100k could follow.
Reasons: monthly timeframe divergence, overbought conditions, open interest imbalance, excessive number of longs, too much hype and euphoria, political chaos in the US, overheated markets in general, especially the stock market.
Crypto can surprise, but the technical picture still suggests a correction is approaching. This does not change my belief in Bitcoin’s long-term growth to seven-digit valuations — but not in a single rocket move, and not tomorrow.

Bitcoin Faces $120K Resistance – Bull Trap or Breakout?Bitcoin ( BINANCE:BTCUSDT ) continued its uptrend of the last 2-3 days as I expected in my previous idea . Today, the announcement of the ADP Non-Farm Employment Change index worked like a catalyst for Bitcoin .
Bitcoin is currently surrounded by Resistance zones and a Potential Reversal Zone (PRZ) , and is near the important price of $118,400(Volumetric importance) and the $120,000(Round Number) .
From the perspective of Elliott Wave theory , it seems that Bitcoin could be in corrective waves and that the increase of the last few days could only serve as a Bull Trap .
I expect Bitcoin to decline at least to the Support lines .
Cumulative Long Liquidation Leverage: $113,590-$111,900
Cumulative Long Liquidation Leverage: $115,823-$115,087
Cumulative Short Liquidation Leverage: $120,000-$118,000
Note: If Bitcoin falls below the Support zone($114,820-$113,180), we should expect further declines.
CME Gap: $111,355-$109,915
Stop Loss(SL): $120,103
Please respect each other's ideas and express them politely if you agree or disagree.
Bitcoin Analysis (BTCUSDT), 1-hour time frame.
Be sure to follow the updated ideas.
Do not forget to put a Stop loss for your positions (For every position you want to open).
Please follow your strategy and updates; this is just my Idea, and I will gladly see your ideas in this post.
Please do not forget the ✅' like '✅ button 🙏😊 & Share it with your friends; thanks, and Trade safe.

Good moment for Buy BTCGood moment for Buy BTC. We have formed the up trend and now we are on the low level of this trend. It is good moment for try to buy BTC with good risk\reward ratio. The stop to the below local low. Will see...

Short BTC to 117,300BTC has broken the ascending channel and I expect a pullback to the next major support at 117,200 which is also the 50% retracement of the rally to ATH

Monthly liq, back up to take weekend ShortsThe monthly opened with no wick.
It turns to a shooting star under 113k.
Somewhere there, it potentially goes back up to 123.5k+
Trying to short after a dump will likely get people burned if done too early.


Trading Strategy
Hello, fellow traders!
By "Following" us, you'll always receive the latest information quickly.
Have a great day.
-------------------------------------
The conditions that lead people to start trading vary.
Before starting a trade, you should consider a trading strategy.
A trading strategy should include:
1. Investment period
2. Investment size
3. Trading method and profit realization method
You should categorize the coins (tokens) you wish to trade based on items 1-3 above.
1. The investment period is the most important.
While the investment period varies from person to person, BTC and ETH are generally considered long-term investments.
Since BTC and ETH are important coins that support the cryptocurrency market, I recommend investing in either BTC or ETH.
All coins other than BTC are broadly categorized as altcoins. However, among them, BNB, SOL, XRP, TRX, and ADA LINK, which have high market capitalizations and have been around for a long time, are suitable for mid- to long-term investment.
However, since these coins are also broadly categorized as altcoins, it's recommended to increase the number of coins (tokens) that generate income, if possible, for mid- to long-term investment.
This method involves selling the original purchase price (plus transaction fees) when the price rises, leaving the remaining coins (tokens) available for profit.
This allows you to increase the number of coins (tokens) with an average purchase price of zero, making mid- to long-term investment feasible.
While it's certainly advisable to sell your holdings to generate cash profits, this practice is not suitable for mid- to long-term investment.
This is because if you make a mistake, you could end up buying at a high price and incur losses for a long period of time.
-
2. You should determine your investment size based on your investment period.
In other words, if you're making a long-term investment and have already invested all your capital, you could miss out on good opportunities in the future.
Therefore, it's best to invest in the following order: long-term investment < mid- to long-term investment < short-term investment.
Furthermore, you should keep approximately 20% of your total investment in cash.
This allows you to trade when a good opportunity arises.
If you run out of cash after trading, try to sell when the price rises to secure cash.
Furthermore, you should avoid investing in too many coins (tokens).
-
3. Once you've determined your investment period and size, you need to find the right buy and sell points for actual trading.
Therefore, you need to define your trading method and profit-making method.
The basic trading strategy is to buy in the DOM(-60) ~ HA-Low range and sell in the HA-High ~ DOM(60) range.
However, if the price rises in the HA-High ~ DOM(60) range, a stepwise upward trend is likely, while if the price falls in the DOM(-60) ~ HA-Low range, a stepwise downward trend is likely.
Therefore, the basic trading strategy should be a split trading strategy.
In other words, if you buy in the DOM(-60) ~ HA-Low range and the price rises to form the HA-High ~ DOM(60) range, it's best to sell in splits and observe the situation.
This stabilizes your psychological state, allowing you to re-analyze the charts.
Maintaining a stable psychological state is crucial for trading.
If your psychological state is unstable, you're more likely to make unexpected trades.
Therefore, it's important to have a basic trading strategy that suits your investment style.
As mentioned earlier, to maintain a mid- to long-term investment, you need to decide whether to increase the number of coins (tokens) that generate profits or to generate cash returns. Before conducting a trade, you need to decide whether to do so.
Since the coin market is increasingly interconnected with the stock market, you can try to interpret it using the same method as the stock market.
In other words, rather than examining the flow of funds within the coin market itself, you should prioritize assessing the stock market, social issues, the economy, and politics to determine market trends.
I believe this problem stems from a lack of understanding of the coin market.
While some external factors may influence the flow of funds within the coin market, they are not suitable for predicting it.
Therefore, you should check the USDT, USDC, USDT.D, and BTC.D charts to confirm the flow of funds within the coin market.
Next, you should check the charts of the coin (token) you wish to trade to determine if it fits your basic trading strategy and develop a trading strategy.
Finally, by examining issues beyond the coin market, you can make an objective decision about your trading.
Otherwise, you will likely make inappropriate trades based on subjective opinions stemming from issues outside the coin market.
To analyze and interpret the coin market like the traditional stock market, the two markets must be integrated.
Otherwise, I believe the coin market should not be analyzed or interpreted like the stock market.
-
Thank you for reading to the end.
I wish you successful trading.
--------------------------------------------------

Bitcoin 130,000 – Correction AheadBitcoin
Around the $130,000 level, there is a possibility of a deep correction toward the $74,000 zone.
Do not panic, and do not get carried away by emotions.
This is the market — it plays with your psychology.
The market is geometric. BYBIT:BTCUSDT

