Bitcoin Eyes $116.6K Breakout Confirmation📊 Market Update — Bitcoin (BTC/USDT)
BTC has successfully confirmed the low time frame zone, holding steady above both the support and volume range, which signals continued short-term strength.
Currently, price action is consolidating within the upper boundary of the range — a sign of buyer absorption before potential expansion.
🔹 Key Level to Watch: $116.6K
This level acts as an important confirmation point — a 1-hour (or higher) close above this zone could validate a breakout continuation, opening the path toward the $120K–$125K range.
If BTC sustains this structure, the bullish momentum remains intact, with low time frame structure aligning with higher trend support.
📈 Bias: Bullish Continuation
🎯 Next Targets: $116.6K → $120K → $125K
Trade ideas

Bitcoin Overall: Still BullishBitcoin wound up hitting my parabola and lower support range. If this parabola breaks and a significant candle (daily, weekly) closes below, I will consider this bull market over. Until then, while another retracement is possible/expected, perhaps even to new local lows, I'd consider this a buying opportunity if it does occur.

That’s why this is the best thing that could’ve happened to Bitc Quite a week, huh guys? A new ATH — and then on Friday, a drop from $120,000 to $100,000 in just one hourly candle. But honestly, I was expecting it — and I’m glad it happened. Why? Let me explain.
The market had been overheated for a long time, and it was only a matter of time before it burst. We hadn’t seen any proper corrections for months. And now, in just one day, we’ve flushed out all the gamblers (and not only them), setting the stage for true, organic growth.
⚡️ The key point is that the price had been moving inside a descending channel. At the beginning of the month, we broke structure upward and made a new ATH — then pulled back into the channel. Now, the price has broken above the upper boundary again and is trying to hold. If it succeeds, that means the previous move wasn’t just a short squeeze — it was the start of organic growth.
If not, we’ll likely drop even lower than $100,000, since that would signal there’s still not enough liquidity to sustain a proper rally.
During the drop, two GAPs were formed — and as you know, 99% of gaps eventually get filled. Just like the GAP near the ATH I mentioned earlier, which was fully closed at the start of the month.
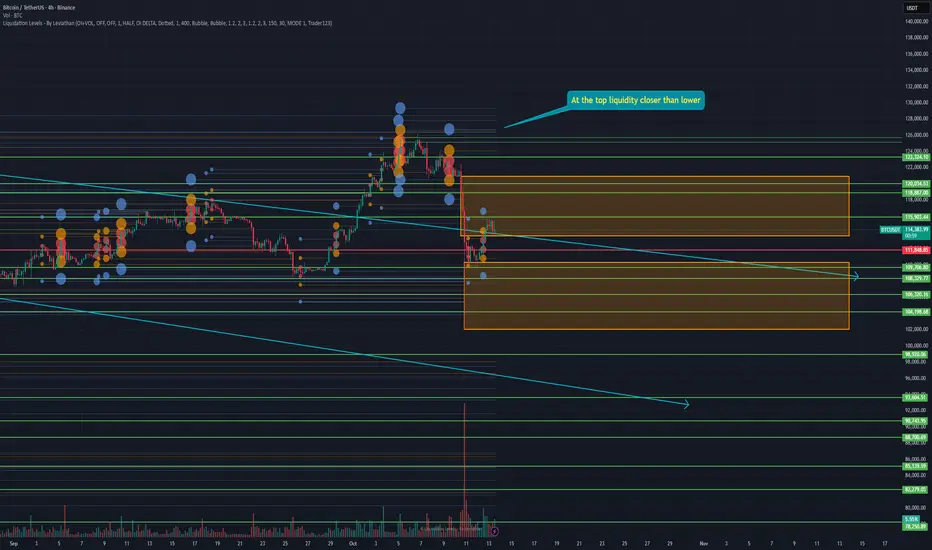
This time, we have a strong lower GAP at $110,340 – $102,000, and an upper one at $120,920 – $113,562 (the latter already partially closing).
The liquidation map shows that the nearest cluster of liquidity is above, while below there’s almost none until around $98,000.
➡️ So right now, there are two possible paths:
✅ We close the upper GAP and continue higher, starting a new rally.
✅ We close the lower GAP, retest the bottom, collect liquidity, and then resume the rally.
Either way, at this stage there are no signs that the bull market is over.
Drop your trade ideas in the comments — what’s your plan for the coming days? ✍️
Analytics: Market Outlook and Forecasts
📈 WHAT HAPPENED?
On Friday evening, October 10, the cryptocurrency market experienced one of the largest crashes in history. It was also the largest cascade of futures liquidations ever. A total of about $20 billion was liquidated in one day. Bitcoin dropped by 16% in the moment, and many altcoins fell by 20% to 90%.
The main reason was the announcement by US President Donald Trump about increasing tariffs on goods imported from China. The "domino effect" was amplified by the failure of the Binance exchange, which triggered a new cascade of liquidations.
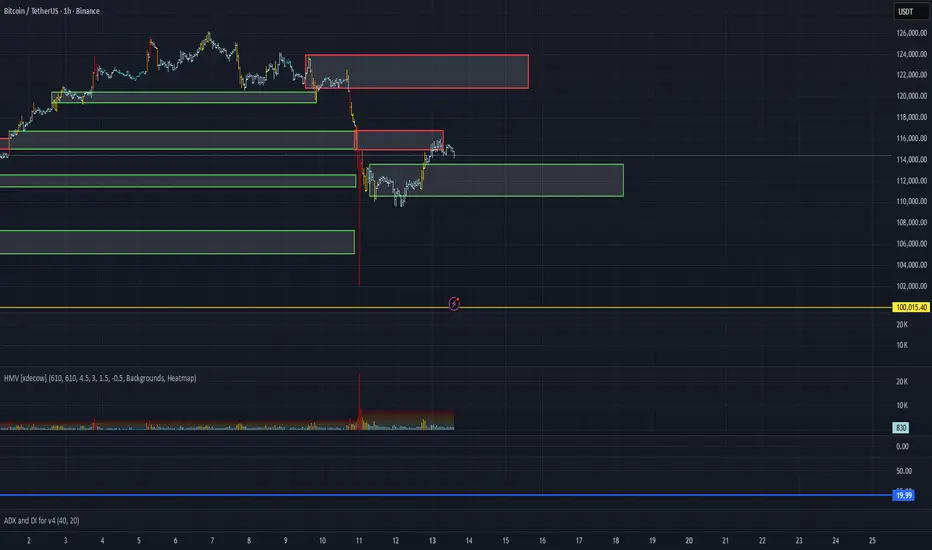
According to the chart, Bitcoin broke through most of the support zones, but the decline stopped and the price closed in the range of $116,000-$111,600. This is where the buyer showed strength and absorbed the majority of the seller's activity.
💼 WHAT WILL HAPPEN: OR NOT?
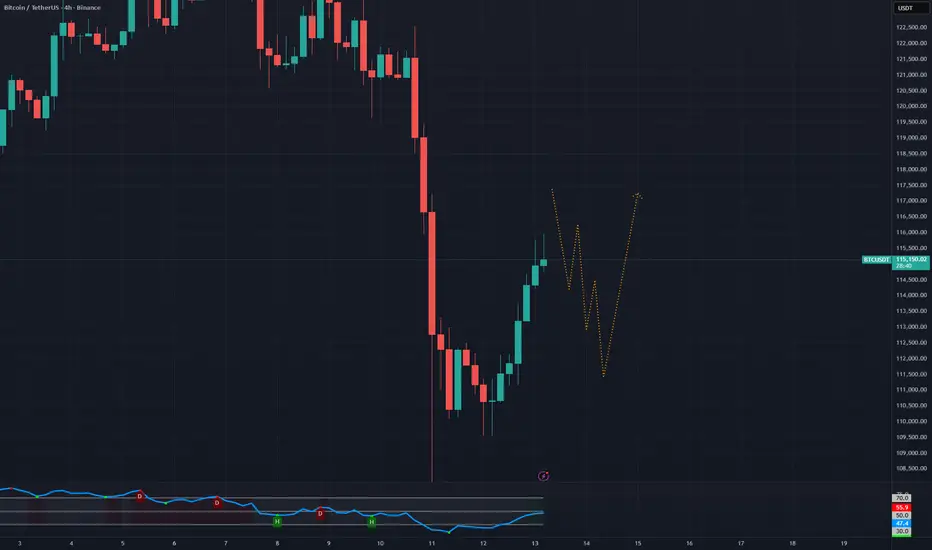
After significant corrections, bitcoin often enters the sideways phase for 1-2 weeks. However, there are already signs of recovery.
At the moment, we’re trying to gain a foothold above the volume zone of $113,700-$110,600 (maximum volumes), there are practically no significant volumes above it that could provide resistance. It’s difficult to say how the price will react in this range. But, most likely, we’ll see another wave of sales in the near future — there are no obvious signs of a reversal yet.
If there is a reaction from the mentioned zone, a long on recovery with a target range of $120,900-$124,000 (volume zone) can be considered.
Buying zone:
$113,600–$110,600 (high-volume area)
Selling zone:
$120,900–$124,000 (volume zone)
📰 IMPORTANT DATES
Macroeconomic events this week:
• October 14, Tuesday, 6:00 (UTC) — publication of the German Consumer Price Index for September;
• October 14, Tuesday, 16:20 (UTC) — speech by Federal Reserve Chairman Jerome Powell;
• October 15, Wednesday, 12:30 (UTC) — publication of the US Core Consumer Price Index for September and in comparison with September 2024;
• October 16, Thursday, 6:00 (UTC) — publication of the UK's GDP for August;
• October 16, Thursday, 12:30 (UTC) — publication of the volume and core index of retail sales, the US producer price index for September, as well as the number of initial jobless claims in the US and the Philadelphia Fed's manufacturing activity index,
• October 17, Friday, 9:00 (UTC) — publication of the Eurozone's consumer price index for September;
• October 17, Friday, 12:30 (UTC) — publication of the average hourly wage, changes in the number of non-agricultural workers, and the unemployment rate in the United States for September.
*This post is not a financial recommendation. Make decisions based on your own experience.
#analytics
Bitcoin Price Nears $115,000 as Investors Refrain From SellingBitcoin is currently trading around $114,553, just below the critical $115,000 resistance level. It briefly surpassed this mark during the intra-day high but failed to maintain momentum, indicating ongoing selling pressure near this threshold.
In the short term, Bitcoin’s outlook remains cautiously bullish, supported by strong holder sentiment. A successful reclaim of $115,000 could pave the way toward $117,261 and eventually $120,000. However, a full recovery would require a sustained push back to $122,000.
But, if the bearish pressure from traders outweighs investor restraint, Bitcoin could slip below $112,500. This could result in the crypto king testing the $110,000 support level and invalidating the bullish outlook.

This Ascending Trendline is KeyHello, fellow traders!
Today I'm looking at the BTCUSDT chart on the Weekly timeframe, and I've spotted a potentially dangerous setup that everyone should be watching.
As you can see from my chart, Bitcoin has been respecting a major ascending trendline that has acted as strong support during this recent uptrend. This trendline has been the backbone of the bullish structure, with multiple bounces confirming its significance.
Currently, the price is once again approaching this critical level after a period of Price Action.

BTC Elliott Wave Analysis Shows Fifth Wave GrowthBTC continues to form its fifth wave of growth, according to Elliott Wave Theory and the previous analysis from August 28, 2025
I'm making some adjustments as the fifth wave's movement has dragged on, and it was expected to be faster
The decline from October 10, 2025, played out perfectly according to the bearish local ascending expanding wedge pattern, which we indicated on our website from August 28, 2025. The only unexpected thing was the extremely rapid decline over an extremely short period of time. This decline will be historic in its speed
According to the previous analysis, the picture has become clearer, and according to the fifth wave's trajectory, the price could now reach $132,000 - $135,000 with this peak occurring in late September, possibly November
Two patterns are currently forming well, which, after rising above the aforementioned levels, both lead to a decline to $90,000 - $100,000 (whether the price will go lower is still unclear), but these levels are roughly the lower boundary of the ascending corridor
We currently have two possible scenarios: the first is a head and shoulders pattern, and the second is a triple top
If the second pattern forms, the price could again reach its all-time high in the $140,000 - $150,000 region
This will likely happen around summer, after which the market will decline significantly, to levels that are still difficult to predict
It's also worth considering that if there is strong positive news from the US government, there's a strong chance the ascending corridor and its upper boundary will be broken
Important
This analysis can be destroyed, provided that the government of the USA, China, and other world economic leaders makes any powerful positive statement regarding BTC, with the signing of relevant documents

BTC 15M Analysis - Key Triggers Ahead | Day 55☃️ Welcome to the cryptos winter , I hope you’ve started your day well.
⏰ We’re analyzing BTC on the 15-Minutes timeframe .
👀 On the 15-minute timeframe for Bitcoin, we can see that after breaking out and consolidating above the $114,351 zone, BTC began moving upward and is now trading within a 15-minute range. A breakout from this range could trigger the next move. The top of this trading range sits at $115,715 and the bottom at $114,750 — breaking and holding beyond either level could start a strong leg for Bitcoin as the new week begins.
🧮 The RSI oscillator on the 15-minute timeframe shows Bitcoin currently moving within a range capped at 64 on the top and 42 on the bottom. A breakout from this RSI range could significantly increase buying or selling momentum, adding fuel to Bitcoin’s next move.
🕯 The size, volume, and count of green candles have increased since the flash crash, and institutions like BlackRock, World Liberty, and Trump-aligned funds have been averaging solid buy positions. With rising buying volume, Bitcoin could break through its ticker-seller resistance at $115,715 and continue its bullish move following the recent dramatic flash crash.
🔍 Despite concerns like the ongoing U.S.–China economic (tariff) war, the market remains in a risk-off mode on higher timeframes. If entering trades, we aim to manage capital across multiple entries — for example, allocating only 0.25% risk per position or averaging in gradually.
🧠 Two trading scenarios are considered for Bitcoin, both offering clear opportunities for structured entries.
↗️ Long scenario (breakout above the range):
If Bitcoin breaks above $115,715 with rising buy volume and RSI crossing above 64, it could initiate another strong bullish leg toward higher resistance levels.
📉 Short scenario (breakdown below the range):
If the micro-buyer support at $114,750 — a key demand zone — breaks, Bitcoin may extend its correction downward. This move should coincide with RSI losing the 42 level and increasing sell volume. Note: in short positions, take profits quickly and maintain tight risk-to-reward control.
❤️ Disclaimer : This analysis is purely based on my personal opinion and I only trade if the stated triggers are activated .

#BTCUSDT Daily ChartPrice did a huge sweep and tapped into our 4h demand zone where it got heavily rejected from then retested our 4h demand at 109.5k before moving up again. MACD is still showing bearish momentum, RSI and EMAs are both neutral. Price is expected to keep pushing upwards from here towards our daily supply zone at 121k as a midterm target.

BTC/USDTThe global trend remains bullish, while price action is currently consolidating locally. A break and sustained hold above the 126K ATH would confirm a potential continuation of the uptrend, but only if supported by favorable market conditions.

Forecast for BTCUSDT 13th October 2026 (Updated)Forecast for BTC for the next 4 weeks. Weekend/Monday pump to ~$120k followed by a decline to to ~$105k. Then market forms a bottoming before all time highs to ~$150k-$170k-$200k

BTC Weekly Outlook (Oct 13 → Oct 20)After that brutal dump on Oct 10, BTC has been slowly reclaiming key levels — showing a short-term optimism across the market. It’s clear that many traders are buying the dip, thinking the crash was just a massive long squeeze after an overheated rally.
But personally, I don’t think it was just a long squeeze. It felt like a broader reaction to Trump’s sudden policy shift — something the market simply couldn’t price in fast enough. Both equities and crypto got hit hard by that shock, especially since everything had only recently stabilized after months of inconsistent policy moves under Trump’s return.
Looking at BTC, ETH, and internal money flow across the crypto market, I think we’re likely to see another short-term correction coming soon. Here’s why:
Profit-taking after the bounce:
The market just recovered from a deep dip — many short-term traders will likely take profits early, especially since the last BTC collapse still left a scar on most of them.
Stalled inflows:
The recent bounce didn’t come with major inflows. There’s been some recovery, but overall volume and liquidity seem to be slowing down.
Smart money behavior:
This bounce looks heavily driven by institutional/smart money. These players don’t gamble — they’ll wait to see how the market reacts next. If BTC drops again, expect them to pull back temporarily or rotate funds into BTC from alts (e.g., ETH).
Heavy resistance ahead:
BTC faces a major resistance zone at $116.8k – $117.5k. Breaking through that level will require a strong, high-volume push — not something easy to achieve right now.
Still, the weekly (W) timeframe remains healthy — momentum is intact, and overall this could still be viewed as a normal correction inside a larger bullish structure.
My take for the week (Oct 13 → Oct 20)
Price will likely attempt to push into the resistance zone above, but I expect at least one rejection bounce before any real breakout.
If that push fails, BTC might retest market sentiment around $114k, or in a more bearish case, down to $112k – $111.8k.
So this week, keep an eye on how price reacts near the upper resistance.
If we see a strong rejection, it’s worth considering short opportunities toward the lower zone — but be flexible with exits depending on how price reacts.
During the first half of the week, expect some choppy, whipsaw moves as bulls and bears fight for control.
After Oct 16, we’ll likely get a clearer short-term trend direction for the following week.
BTC short TermDear Traders,
i expect to reach 119,200 it can go more up little bit but a second dump can be cooking
im publishing this idea bcz a lot of ppl lost money and most of you follow the wrong ppl
market is green yes but fully manipulated

Bitcoin prediction.... Before bitcoin goes to higher levels price needs to retrace and we might start to see that from here on out...

BTC📊 BTCUSDT 4H Analysis – Key Reversal Zones
Bitcoin has shown a sharp recovery after a strong bearish impulse, bouncing from lower demand zones. The current move suggests a possible short-term corrective rally before facing significant resistance levels.
Potential Reversal Zones:
🔹 115,803.24 – First reaction area / potential intraday resistance.
🔹 117,494.52 – 118,572.76 – Key resistance range; watch for rejection signals here.
🔹 121,238.05 – Major resistance zone where strong selling pressure could appear.
If BTC continues to hold above 113,000, a push toward 118K remains likely. However, failure to sustain above current support could lead to a deeper retracement toward lower liquidity zones around 108K – 106K.
📈 Bias: Short-term bullish correction within a larger bearish trend.
🕓 Timeframe: 4H

Breakout Or Breakdown?Price has recently shown signs of bullish intent after a clear CHoCH (Change of Character), breaking above previous lower highs. This shift suggests potential accumulation following the BOS (Break of Structure) to the downside earlier.
Key Levels:
Resistance (R) Zone: Currently testing this supply area. A strong close above could confirm continuation.
Support Zone: Below, previous demand and BOS zone, likely to act as support if price rejects.
Bullish Scenario:
A clean breakout and retest of the resistance zone could open up a push towards higher targets, confirming bullish momentum.
Bearish Scenario:
If price rejects strongly from resistance, we may see a return to the lower support zone and potentially break it to reach the lower target.
Watch for confirmation before entering, and manage risk accordingly.

Interesting fact almost every huge wick #BTC on Binance Futures Interesting fact almost every huge wick #BTC on Binance Futures is retested
Double top in 15 min failed higher high , sell under the necklinDouble top in 15 min failed higher high , sell under the neckline

BTC 1D AnalysisBitcoin is still at the support of Up trendline on daily timeframe. Hopes are still alive.
Also we can say it is on the support zone. If you wish to take trade on any side please confirm it on 4H once.

btc idea We had a great run since Nov 2022 when wave 2 bottomed. Wave 3 delivered a massive rally, peaking near 109k.
Since then, I’ve been tracking wave 4:
Wave A bottomed ~75k
Wave B rallied us to the 124k rejection right at the 0.618 fib
This rally wasn’t impulsive but corrective (classic Wave B overshoot).
⚠️ If BTC loses 110k on 1D, the probability for a sharp Wave C massively increases → target 66-68k.
From there, Wave 5 could unfold with a brand new rally. 🚀

rsi and mfi divergence on weakly chart I see a positive divergence on the weekly Bitcoin chart and from my point of view this has happened at the perfect time
The market is filled with panic and fear, and we have already fallen enough
And always when fears and panic increase, the rising wave comes

Forecast for BTCUSDT 12th October 2026 (Updated)Forecast for BTC for the next 4 weeks. Weekend/Monday pump to ~$115k followed by a decline to to ~$107k followed by a bullish counter-trend pump to ~$120k.
Counter-trend pump then gets exhausted then back down to ~$102k-103k for a bottoming before all time highs to ~$150k-$170k-$200k

Crystal ball into BitcoinI'm predicting not only the price but also the date Bitcoin is going to reach 100,000
Bitcoin will reach $100,000 exactly 5 weeks from now on around 20th of November.
Look at the chart. It is respecting the trend line and also the first time cycle which I have drawn. It has happened twice before and the next predicted date is 25th of November.
