Next AI forecast is out - expect consolidation periodIn this video I put out the next AI forecast as well as the explain cycle energy
Cycle energy is limited, so when there is a big move the cycle rest of the cycle needs to balance it out
BTCUSDT.3L trade ideas

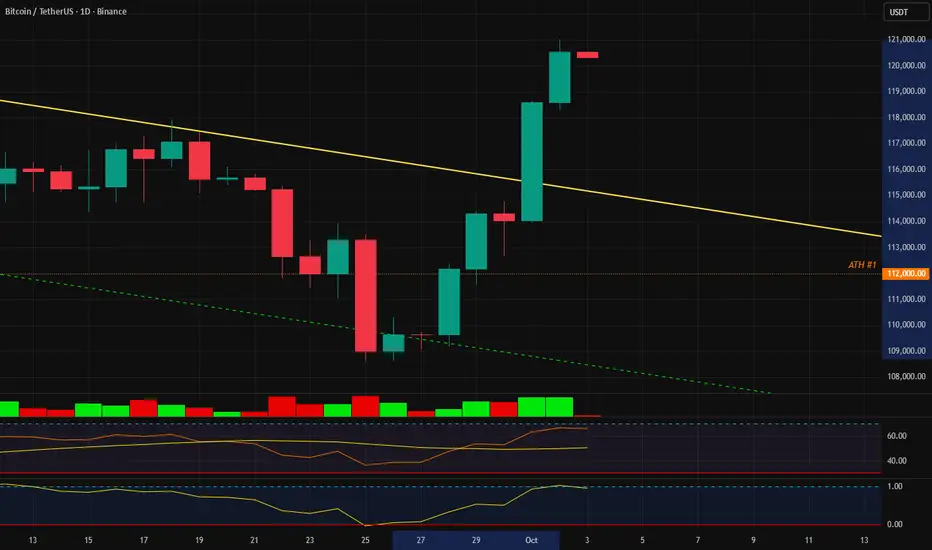
BITCOIN BTCUSDT BITCOIN ,the structure of the market tell us its direction.in the case of bitcoin the buy was clear on ascending trendline line as posted last week.
now we are at daily resistance at 121,019.84 ,if we get rejected we will see temporary correction into 118-117k zone we will look for buy opportunity and target 122,800-123k zone and the next target will be 126800-127000 zone .
full break of 126,800-127,00k will be holding till 147k-137k zone .
#bitcoin #btcusdt #btc

BTC/USD 11% Move in 6 Days, Whats Next??WOW BTC moved 11% in 6 days 12,000 move. I wonder whats next for BTC near the ATH do we break through or crash down and reset for another Shot at the ATH???
$BTC seems spike seems a little "too coordinated" All for healthy trading and stocks / crypto making gains, but what we're seeing in BTC seems very engineered and highly coordinated. Needs to be investigated. BTC and crypto markets are not strange to rugs and a lot of f$ckery taking place. One this is for sure that profit takers will take advantage of this! Be very careful and measured. I've seen this movie way too many times. If you're up, take your profit and sit back waiting for your next opportunity. Way too hot!

Btc/Usdt - Intraday Outlook; Demand Zone In FocusPrice has recently broken structure (BOS) to the upside, forming a new weak high, indicating potential for further upside but also vulnerability to retracement.
Short-Term Expectation:
A retracement is expected towards the marked Demand Zone (around 118,500–119,000), which previously acted as a strong support level. This zone aligns with bullish order block and previous BOS area.
Potential Setup:
Watch for bullish confirmation within the demand zone (e.g., bullish engulfing or BOS on lower timeframes).
If confirmed, potential entry long with the target set at the recent weak high for a liquidity grab or higher continuation.
Target: Above 121,200
Invalidation: Clean break and close below the demand zone.
This structure supports a classic "retrace to demand then continue bullish" model, ideal for intraday trading setups.

BTC - UPDATE#BTC - UPDATE:
REAL BREAKOUT MODE OR BULL TRAP? 🚀👀
Morning view still valid for now, but bulls are too strong currently and want to break all resistances! 📈
Technically, daily view flipped bullish & will remain green above 115,850$!
Short term play:
⚠️H4 uptrend is strong at the moment, but the 120,500 - 121,000$ is key resistance zone, again seeing a pull back & clean retest of the 116,500 - 116,000$ looks really possible.
If we close this week above 119,500$ then will wee see a new ATH & price discovery mode? 🚀
Key levels are mentionned in my previous weekly outlook.
If you shorted earlier with me on my morning view, I think that's safer to cut. #dyor
#BTC #bitcoin

BTC Short TermBTC is weaker as it shows a bearish rsi divergence so I am shorting it for a short term trade

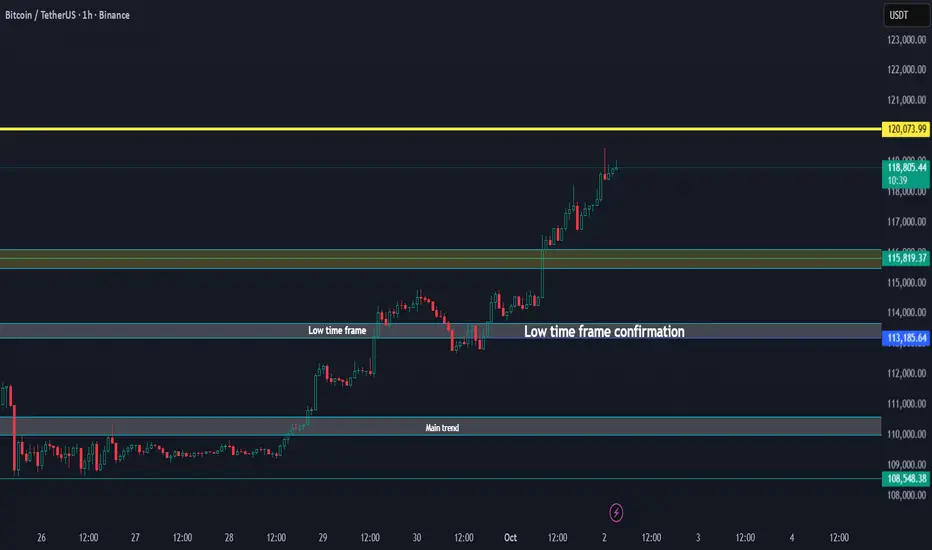
BTC Above All Key Levels, Trend Points Higher Update 02-10-2025🚀 Bitcoin / USDT Update
Bitcoin has broken above all key levels, showing strong momentum.
Main trend has been secured.
Low time frame is confirmed and holding.
Price is currently pushing into new zones with upside pressure.
If this strength continues, BTC could extend toward the 120K region, and a new trend could unlock further upside potential beyond that.
✅ As long as Bitcoin stays above the confirmation zone (~113K support), momentum remains bullish.
BITCOINBITCOIN ,the structure of the market will never lie ,the structure will tell and show us liquidity +volatility zone ,break of structure ,RS/SR ,BAR .
BITCOIN STRUCTURE WILL BE WATCHED AND FOLLOWED.
#BITCOIN #BTC

BTC 1H Short Trade Idea First confluence is the 1H FVG, but the candle that created it had no real volume, which makes me see it as weak continuation and a potential rejection area.
The 4H trendline has been respected multiple times but also broken enough that it’s losing strength, even though it hasn’t fully given way yet.
There’s also an unfilled 1H bearish FVG that lines up as a clear downside target if structure starts breaking down. Both 1H trendlines are still trending upward, but if they give way, momentum flips quickly.
Support on the 1H is the main level I’m watching once that fails, it opens up a deeper sweep into lower liquidity zones.
Confluences
• 1H bearish FVG (unfilled) → downside target
• 1H support → break level
• 1H bullish FVG → rejection zone
• 4H TL → weakening
• Deeper liquidity zone → lower target
Bias: I’m short here. Watching for rejection off the 1H imbalance and targeting the unfilled bearish FVG and lower liquidity. A clean hold above structure would invalidate.

BTC 1H Short Trade IdeaFirst confluence is the 1H FVG, but the candle that created it had no real volume, which makes me see it as weak continuation and a potential rejection area.
The 4H trendline has been respected multiple times but also broken enough that it’s losing strength, even though it hasn’t fully given way yet.
There’s also an unfilled 1H bearish FVG that lines up as a clear downside target if structure starts breaking down.
Both 1H trendlines are still trending upward, but if they give way, momentum flips quickly.
Support on the 1H is the main level I’m watching once that fails, it opens up a deeper sweep into lower liquidity zones.
Confluences
• 1H bearish FVG unfilled → downside target
• 1H support → break level
• 1H bullish FVG → rejection zone
• 4H TL → weakening
• Deeper liquidity zone → lower target
Bias: I’m short here. Watching for rejection off the 1H imbalance and targeting the unfilled bearish FVG and lower liquidity. A clean hold above structure would invalidate.

Bitcoin Enters Target Zone: Correction or Breakout ?In the end, the 5th wave extended, and the price has entered our expected zone. In the near term, we could see a local correction toward the trendline and the 116,230 level.
A breakout above 120,200 would be a positive signal for further growth.

#BTC/USDT Analysis — Pullback Before Bullish Continuation#BTC
The price is moving within a descending channel on the 4-hour frame, adhering well to it, and is heading for a strong breakout and retest.
We have a bearish trend on the RSI indicator that is about to be broken and retested, which supports the upward breakout.
There is a major support area in green at 111600, which represents a strong support point.
We are heading for consolidation above the 100 moving average.
Entry price: 111750.
First target: 112684.
Second target: 113672.
Third target: 115048.
Don't forget a simple matter: capital management.
When you reach the first target, save some money and then change your stop-loss order to an entry order.
For inquiries, please leave a comment.
Thank you.


#BTCUSDT 4H ChartPrice moved up and reached the 4h breaker zone at 119k where it got rejected from as we predicted. MACD is now showing some bullish weakness, RSI is overbought and EMAs are turning bullish. We might now see a retest of the support at 117.5k before potentially expecting further bullish movements towards the next 4h supply zone at 122.5k.

Bitcoin growthlook this chart
whithout tecnical
auto_awesome
Translate from: Persian
Just a simple look.4How is it possible that this chart does not grow?

BTC – Testing Ascending Channel Midline
📆 On the Daily timeframe, CRYPTOCAP:BTC is pressing against the midline resistance of the ascending channel 🚨.
This same level previously triggered a sharp rejection, sending price down toward 109,000.
A decisive move here could determine short-term direction — either a clean breakout above or another pullback toward channel support.
👀 Critical test zone to monitor closely!
Not financial advice.

BTC Medium Term and Local Work for 2025 18 05 2025Logarithm. Time frame 3 days. Everything is shown extremely accurately, according to technical analysis, logic based on cyclical repetition, and liquidity consolidation zones as a result of price and trading movements. This trading idea, with precise reversal zones and targets, will last you for 31 weeks. That is, for 7 months.
The previous trading idea BTC/USD Triangle. Medium-term and local work , published on 7 06 2024, it lasted me almost 1 year. It has 63 local work updates (I don't spam with new trading ideas on principle). So, nothing will get lost, you can follow everything, read, possibly use it as training material on a live chart, as a whole explanation of local work, what is really happening on the market, profit/loss potential, always before the price movement, and not after the fact. I show what is, that is, a chart and potential work from the position of a trader, not a crypto marketer.
🟣 Local and medium urgent now
1️⃣💸 The bullish triangle itself (which is not there yet, I have depicted it on the chart for you) acts as a stop and consolidation zone (zone “psychology 100”, reset in trend No. 1). This is the easiest to manipulate and the most probable scenario. This will just be the summer consolidation. Instead of it, there may be:
2️⃣💸 Rising wedge , but more in shape like a triangle (essentially a wedge, there is a meaning of a triangle, but it was formed on aggressive pump news), with a large short liquidity takeout, and not very good logic of the TA movement after that... But, this is a bullish scenario, although quite aggressive.
3️⃣ Working out the bearish targets of the triangle (non-corrective price movement within its canvas). Stopping the decline in the designated zone and reversal upward (continuation of the trend). I emphasize the importance of not fixing the price below the zone of targets of the local corrective decline, which will not break the trend.
4️⃣💸 Double top (or triple). Double top as in 2021 in the distribution zone. This is the least likely scenario, but the most negative, as it breaks the trend. But, this is the least likely scenario, primarily because of the altcoins.
Altcoins in 2021 and now.
4️⃣In 2021, when Bitcoin formed a double top, they (altcoins) were in “space”, that is, in their distribution zones (+500-1000% of the average price of the set).
🔽Now everything is the other way around, they are in capitulation zones (most of them) or in their long-term accumulation channels :
Liquid -90-93%
Medium liquid -93-96%
Low liquid -96-98% or some are already scams or on the verge of it...
Some altcoins have pumped up earlier. That is, they left their long-term accumulation zones earlier. For example: SUN, XRP, DOGE, PEPE, SOL and so on... But there are very few of them, as distributing (raising the price, holding it and selling, inspiring to buy expensive when everything is cheap) in a bearish altcoin trend is very irrational, and you need a lot of money to go against the general market trend.
Main trend (most of it, chart since Binance Exchange foundation) for clarity on a large time frame of this local zone for work.
BTC Primary trend. Secondary — expanding triangle.

Great way to start UptoberChart says it all boys. Similar channel breakout as seen in July, except this time it's happening in Uptober. Markets are frontrunning Q4 bullishness. Send it!

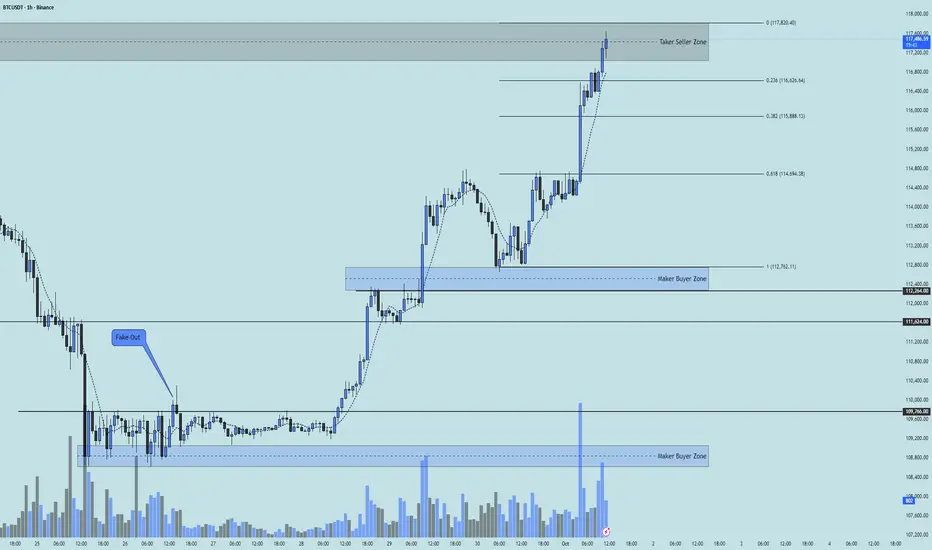
BTC 1H Analysis - Key Triggers Ahead | Day 49❄️ Welcome to the cryptos winter , I hope you’ve started your day well.
⏰ We’re analyzing BTC on the 1-Hour timeframe .
👀 On the 1-hour chart , After a strong bullish rally and breaking the $109,766 zone, BTC managed to move toward $117,000. This level is considered a multi–timeframe daily resistance, and personally I expect a correction here. The second bullish leg, which started after breaking the $111,624 resistance and buyers' micro support at $112,762, is now facing weakness. RSI is also showing reversal signals. The current BTC scenario is a correction toward the marked Fibonacci zones. The upcoming resistance is extremely important, and if it breaks, Bitcoin can continue upward.
🧮 Looking at the RSI oscillator, during both bullish legs it managed to stay firmly in overbought territory, and long-position volatility has significantly increased along with rising buy volume. On the 1H timeframe, RSI doesn’t have a specific key level right now because it has hit a significant swing resistance on the daily timeframe. Breaking out of the marked zone can push BTC higher. This key swing level on the daily RSI is around 61.
🕯 Volume, count, and size of bullish candles have sharply increased. Considering we are sitting at a resistance zone, traders are putting in maximum effort to break it, and volume is rising aggressively. Every sell candle that formed was engulfed by buyers immediately as BTC dipped, and buyers created new positions. Our trend is strongly bullish.
🎮 The Fibonacci is drawn from the start of the new bullish leg to the top of the previous 1H candle's wick. It has identified strong support zones in case BTC corrects, and these levels are considered highly reliable.
📊 The Bitcoin liquidation heatmap currently shows the distribution of short positions, and this spread continues up to $119,000. With upward movement and buyer support, these clusters can get absorbed and liquidated, leading to a short squeeze and a strong move up. Note that the cluster of short liquidations down to $113,000 could get triggered with maximum selling pressure, and this scenario isn’t far-fetched.
🧠 If you haven’t entered a BTC position based on previous analyses, you can wait for corrective support zones to form. Buyer tickers will place their orders below these support levels so we can gain full confirmation before making a BTC entry.
↗️ Long Position Scenario: A break above the seller ticker zone and grabbing accounts holding short positions is required to reduce short-position clusters. Then we need confirmation above our seller ticker zone at $117,820. With the start of a new bullish leg and an indecision candle plus a 7 SMA touch from below, we can open a low-risk long position.
📉 Short Position Scenario: If BTC forms a lower high and lower low with maximum selling pressure, negative economic news, and loses key Fibonacci zones — especially the 61% level — we can consider opening a short. However, as I mentioned in previous days, avoiding shorts and focusing on longs is currently much more in our favor.
❤️ Disclaimer : This analysis is purely based on my personal opinion and I only trade if the stated triggers are activated .
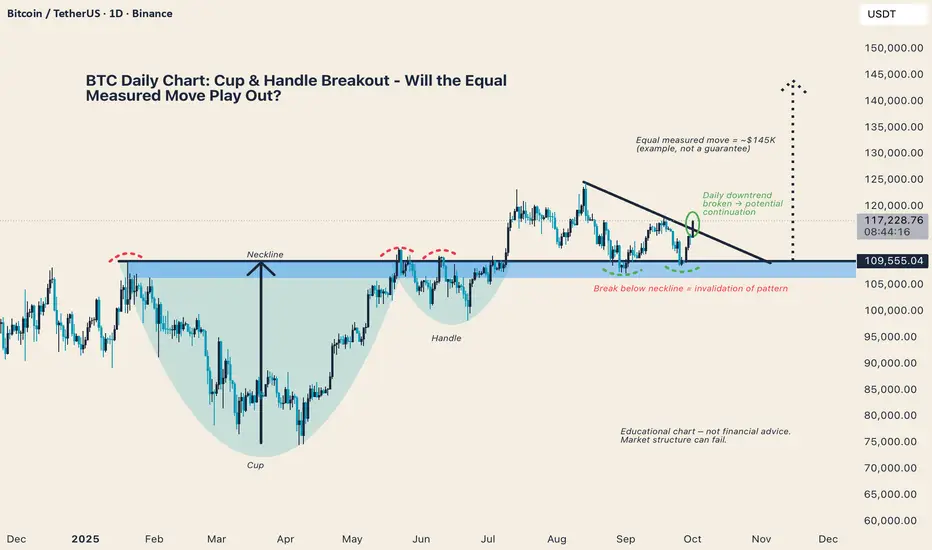
BTC Daily Chart: Cup & Handle Breakout - Will the Equal MeasuredBitcoin has broken above its daily downtrend while holding above the neckline of a Cup & Handle formation.
Equal Measured Move Example: ~$145K (for educational purposes, not a guarantee)
Key Structure: Sustained closes above the neckline support continuation
Invalidation Level: A decisive break back below the neckline would negate the setup
⚠️ Educational Chart - Market structure can fail. This analysis is for learning purposes only, not financial advice.
What do you think - is this the breakout that pushes BTC into its next leg higher, or will neckline support fail?
WHAT IF.. $BITCOIN holds? New ATH incomingHey again traders!
BTC is leaving no man alive. What everybody thinks about the 107K level ( masive bearish breakout) was invalidated by a bullish breakout to 114K.
The sad part? We are in a bearish channel.
The good one? If we hold 110K - 112K there is a high probabilty that 117K - ATH will come on the upcoming weeks.
Have to be mentioned that we are entering in Q4 historically the most bullsh Q for markets!

BTC (Y26.P3.E1). Looking for a Grantley HarmonicHi traders,
We are looking for more highs and in the short term, the daily level will likely be resistance and hence a shorting scalp opportunity is likely there. On the bigger picture, a Gantley harmonic could be the target as it will take out much of the liquidity. I was hoping for an ATH around 127k or more for the cup and handle target but we might not get that any time soon. I have tweeted many times that September will be bearish and October and November bullish. I don’t envision this time the Harmonic is a topping structure, but we can’t rule it out.
All the best,
S.SAri.
